Commercial Metals Company (ticker: CMC)
2024-02-07
 Commercial Metals Company (CMC) operates within the materials sector, focusing primarily on the manufacture, recycling, and marketing of steel and metal products. With its headquarters situated in Irving, Texas, CMC has established a significant presence not only in the United States but also on an international scale, with facilities and operations spread across key global markets. The company deals with a broad range of products that include reinforcing bar (rebar), structural beams, merchant bar, and other specialty steel products. Its business model is vertically integrated, encompassing everything from recycling scrap metal to fabricating steel products that meet specific customer requirements. This integration allows CMC to maintain a level of control over its supply chain, enhancing efficiency and sustainability in its operations. As of the last reporting period, Commercial Metals Company has shown resilience and adaptability in navigating the fluctuations of the steel industry, indicating strong operational execution and strategic growth initiatives. Its stock, traded under the ticker symbol CMC, reflects the company's steady performance and investor confidence in its business model and growth prospects.
| Full Time Employees | 13,022 | Previous Close | 50.25 | Dividend Rate | 0.64 |
| Dividend Yield | 0.0127 | Payout Ratio | 0.0979 | Five Year Avg Dividend Yield | 1.89 |
| Beta | 1.314 | Trailing PE | 7.79052 | Forward PE | 10.886753 |
| Volume | 623,511 | Average Volume | 1,019,050 | Average Volume 10days | 1,202,150 |
| Market Cap | 5,929,968,640 | FiftyTwo Week Low | 39.85 | FiftyTwo Week High | 58.06 |
| Price To Sales Trailing 12Months | 0.6915197 | Enterprise Value | 6,380,067,840 | Profit Margins | 0.09029 |
| Shares Outstanding | 116,388,000 | Book Value | 36.242 | Price To Book | 1.4058275 |
| Earnings Quarterly Growth | -0.327 | Net Income To Common | 774,259,008 | Trailing Eps | 6.54 |
| Forward Eps | 4.68 | Revenue Growth | -0.101 | Return On Assets | 0.10152 |
| Return On Equity | 0.19816999 | Free Cashflow | 399,804,640 | Operating Cashflow | 1,232,792,960 |
| Total Cash | 704,603,008 | Total Debt | 1,154,470,016 | Total Revenue | 8,575,270,912 |
| Statistic Name | Statistic Value | Statistic Name | Statistic Value |
| Sharpe Ratio | -0.2819109846392533 | Sortino Ratio | -4.258978171675102 |
| Treynor Ratio | -0.0646952651441641 | Calmar Ratio | -0.3081712061308823 |
Analyzing the provided data for CMC offers a comprehensive overview of both the company's financial health and its potential future performance in the stock market. This analysis will incorporate a variety of key indicators, including technical analysis, fundamental analysis, balance sheet strength, and various financial ratios that give insight into the company's risk-adjusted returns.
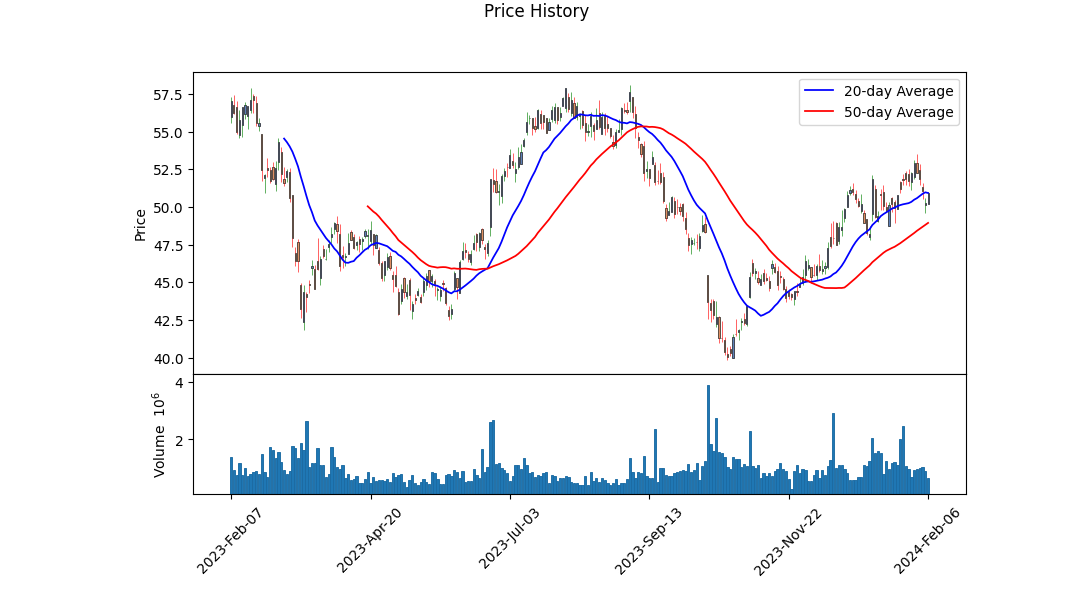
On the technical front, CMC's closing prices have shown both upward momentum and volatility over the period, as seen in the fluctuations in the OBV (On Balance Volume) and the evolving patterns in the MACD (Moving Average Convergence Divergence) histogram. While the OBV initially signals accumulation, the subsequent decline suggests a notable level of selling pressure. The negative MACD values towards the end signify bearish momentum, indicating potential short-term challenges ahead.
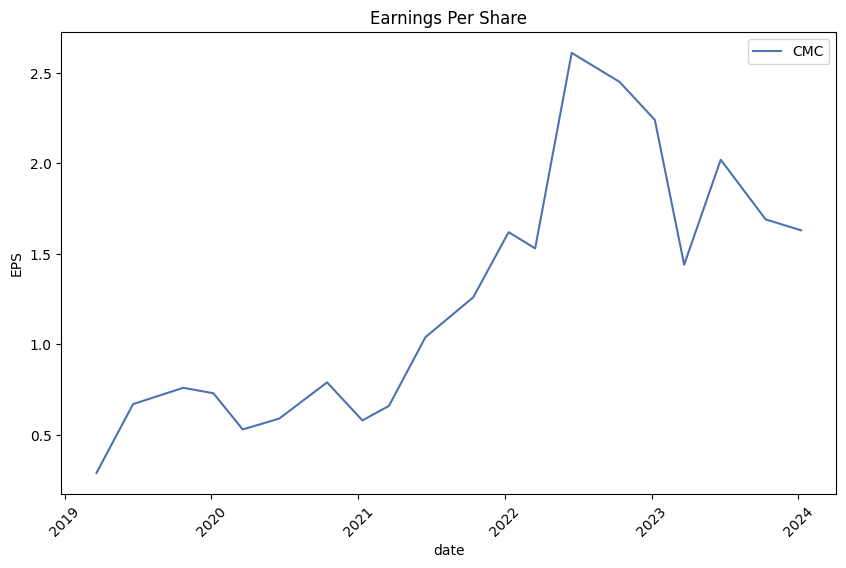
From a fundamentals perspective, CMC exhibits robustness. The earnings reports and revenue projections highlighted suggest growth, albeit with a cautious outlook given the contraction in future earnings and sales growth estimates. The fundamentals such as gross margins, EBITDA margins, and operating margins indicate operational efficiency, but the growth estimates underscore the challenges CMC faces in maintaining its historical growth rates.
The balance sheet and financials underscore a stable yet leveraged financial position, with a significant level of cash and cash equivalents and a consistent ability to generate free cash flow. While debt levels are notable, the strong free cash flow and operating cash flow provide a counterbalance, suggesting that CMC can service its debt obligations. Additionally, the Altman Z-Score and Piotroski Score from the summary of score point towards financial stability and operational efficiency.
Risk-adjusted return metrics, including the Sharpe, Sortino, Treynor, and Calmar Ratios, however, present a varied picture of performance. Negative values across these ratios indicate that CMC's returns have not sufficiently compensated for the risk taken by investors over the analyzed period. This suggests caution, especially for risk-averse investors.
In conclusion, CMC's stock appears to operate within a dichotomy of strong fundamentals and operational efficiencies, contrasted by technical indicators that suggest short-term bearish momentum and risk-adjusted return metrics indicating underperformance in compensating for risks. Investors should weigh these factors accordingly, with a particular focus on developments that might shift these dynamics. Given the diverse array of signals, a mixed outlook is prescribed for the next few months, with fundamental strength potentially offset by technical weaknesses and concerns on risk-adjusted performance. This analysis favors a prudent approach, with a recommendation for investors to stay informed on both macroeconomic factors and company-specific developments that could influence market dynamics moving forward.
In our analysis of Commercial Metals Company (CMC) leveraging methodologies from "The Little Book That Still Beats the Market," we've computed key financial ratios to understand its investment potential more deeply. The Return on Capital (ROC), which is a critical indicator of how efficiently a company converts its capital into profits, stands at an impressive 20.16%. This high ROC suggests that CMC is highly effective at deploying its capital, yielding profitable returns which is a strong signal for potential investors. Furthermore, the Earnings Yield, calculated at 14.41%, is another vital metric indicating the company's profitability relative to its share price. A higher earnings yield is often considered favorable, as it signifies that an investor is likely to receive a greater return on investment. Taken together, these figures suggest that Commercial Metals Company presents a compelling case for investment, combining efficient capital use with attractive earnings relative to its stock price.
| Statistic Name | Statistic Value |
| alpha | 0.059098286909211165 |
| beta | 1.2539595025454986 |
| R-squared | 0.381 |
| Adj. R-squared | 0.381 |
| F-statistic | 772.8 |
| Prob (F-statistic) | 6.59e-133 |
| Log-Likelihood | -2716.6 |
| No. Observations | 1,256 |
| AIC | 5437 |
| BIC | 5448 |
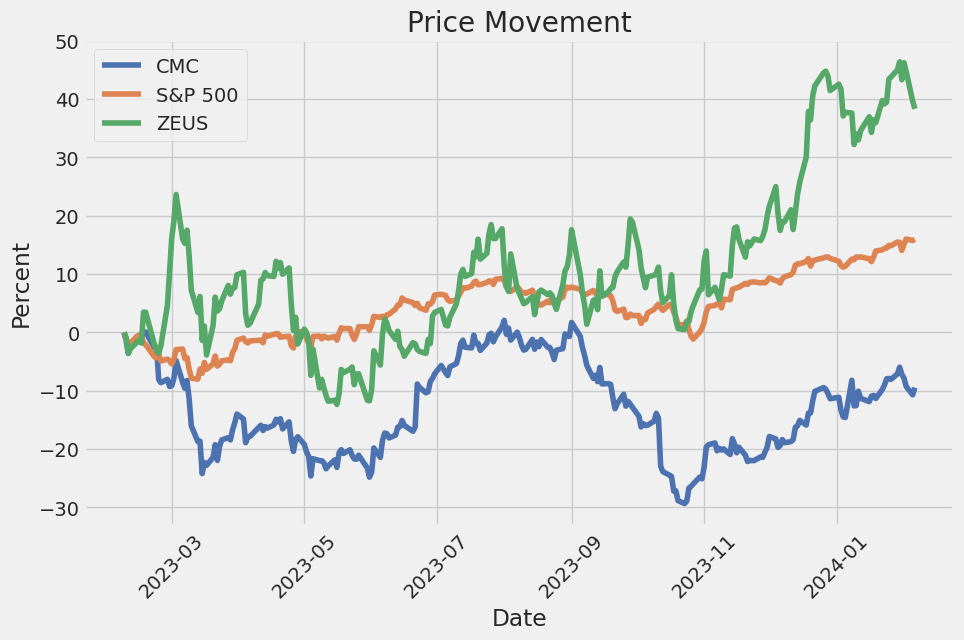
The alpha of the OLS regression model, notable for being a measure of performance on a risk-adjusted basis, showcases a value of approximately 0.059 for the relationship between CMC and SPY. This suggests that, independent of the market's movements, the CMC variable moves, on average, 0.059 units. While this might seem minor, it indicates a positive alpha which in financial terms, could imply that the CMC has a slight ability to generate returns independently of the broad market represented by SPY.
Furthermore, the beta coefficient of the model is about 1.254, indicating that for every 1% change in the SPY, the CMC is expected to change by approximately 1.254%. This ties into the concept of alpha by illustrating the sensitivity of CMC relative to the market movements of SPY. The R-squared value of 0.381 suggests that approximately 38.1% of the variability in CMC can be explained by the changes in SPY, leaving the rest attributable to other factors not included in this model. This model provides a foundational insight into how CMC reacts in relation to market changes, with alpha highlighting the unique performance aspect relative to SPYs movements.
Commercial Metals Company (CMC) conducted its first quarter fiscal 2024 earnings call, heralding another period of strong financial performance despite a downturn from record levels. President and CEO, Peter Matt, and Senior Vice President and CFO, Paul Lawrence, emphasized the remarkable contributions of CMCs 13,000 employees to the companys achievement. They also highlighted CMC's strategic focus towards realigning its reportable segments to better reflect the business' varying characteristics and needs, aiming at enhancing visibility into key value drivers and optimizing capital resource planning. This realignment is designed to drive higher margins through operational and commercial optimization, and foster value accretive growth, strengthening CMCs customer value proposition. Additionally, the North America and Europe Steel Groups performed well, supported by healthy construction activity and near record margins on downstream products, while benefiting from substantial recognition related to energy cost rebate programs.
Peter Matt provided an in-depth discussion on CMCs first quarter performance. The company reported net earnings of $176.3 million, or $1.49 per diluted share, with net sales reaching $2 billion. Core EBITDA for the quarter stood at $325.3 million, yielding a core margin of 16.2%, and an annualized return on invested capital of 14.9%. The results reflected an exceptional safety performance, while CMC continued to pursue its ultimate goal of zero incidents. The realignment of CMCs reportable segments postures the company towards realizing significant value through enhanced management of each business group, optimizing how they bolster CMCs commercial proposition.
Concerning the market environment and CMC's outlook, the construction activity in North America remained robust, providing a favorable demand environment for CMC's reinforcing products. However, the company also noted continued pressure from increased import competition on steel product margins, which has since mitigated, suggesting a potential uplift in steel product margins in the forthcoming months. Key indicators point towards stability in non-residential construction and the anticipation of increased infrastructure activity. Despite the challenges in Europe due to sluggish demand impacting pricing and margins, meaningful green shoots in Poland and substantial energy cost rebates are expected to foster a normalizing market condition, improving operational EBITDA for CMCs Europe Steel Group.
Paul Lawrence detailed the financial nuances of the quarter, stating net earnings at $176.3 million, or $1.49 per diluted share, with adjusted earnings standing at $192.7 million, or $1.63 per diluted share. The adjusted EBITDA margin of 16.2% maintains a historical high, though it signifies a decline from previous levels. The North America Steel Group showcased a robust performance, with a slight moderated EBITDA impacted by operational startups, while the Europe Steel Group, despite facing reduced margins and shipment volumes, recognized significant rebate benefits. The Emerging Business Group saw a slight dip in net sales, attributing to acquisition dynamics, but remained largely stable in its financial standing. The company's strategic endeavors, including their Arizona 2 micro mill and the planned Steel West Virginia site, align with CMC's commitment to driving growth, earnings, and cash flow, fortifying its position in the market amidst powerful structural trends.
Securities and Exchange Commission (SEC) requires public companies to provide qualitative and quantitative disclosures about market risks that may affect their financial condition or results of operations. The information below provides an overview of our exposure to market risks as of November 30, 2023, including interest rate risk, foreign currency risk, commodity price risk, and other relevant market risks, in accordance with SEC requirements.
Interest Rate Risk: As of November 30, 2023, we are subject to interest rate risk primarily related to our variable-rate debt instruments. We manage our interest rate risk by maintaining a mix of fixed and variable-rate debt. Changes in interest rates affect the interest expense related to our variable-rate debt. Considering the current interest rates and the proportion of our debt that is subject to variable rates, a hypothetical 1% increase in interest rates could lead to an increase in our annual interest expense.
Foreign Currency Risk: Our operations are international, and we are exposed to foreign currency risk as we conduct transactions in currencies other than the U.S. dollar, with a significant portion related to the Polish Zloty due to our operations in Poland. We use derivative financial instruments, such as foreign currency forward contracts, to hedge certain foreign currency transaction exposures. The effectiveness of our hedging programs and the impact of currency fluctuations on our operations depend on several factors, including the volatility of currency exchange rates and our ability to manage our currency exposure effectively.
Commodity Price Risk: We are exposed to commodity price risk related to the procurement of raw materials, such as scrap metal, energy, and other commodities used in our manufacturing processes. Commodity prices are subject to significant volatility due to market conditions, geopolitical events, and other factors. To manage commodity price risk, we utilize commodity hedging instruments where appropriate to lock in prices or margins for a portion of our raw material purchases. Changes in commodity prices could affect our cost of goods sold and margins.
Operational Risks: In addition to market risks, we face operational risks related to the commissioning of new projects, the availability and cost of supplies of raw materials and energy, and the impact of environmental regulations. We continually assess these risks and implement strategies to mitigate their potential impact on our operations and financial performance.
Overall, we actively monitor and manage our exposure to market and operational risks through various financial and operational strategies. Our objective is to minimize potential adverse effects on our financial condition and results of operations while capitalizing on opportunities that may arise.
Commercial Metals Company (CMC), a formidable presence in the steel and metal fabrication industry, has been navigating through a period of strategic maneuvers and market shifts, as highlighted by various analytical reports and financial disclosures. At the heart of CMC's corporate activities are its commitment to sustainability, strategic acquisitions resistant to interest rate changes, significant share repurchase programs, and an agile response to global economic conditions, all of which play pivotal roles in shaping its market valuation and investor appeal.
A focal point of CMC's resilience and strategic foresight is encapsulated in its robust earnings report for the first quarter of 2024. The companys ability to surpass earnings expectations, as mirrored in its EPS of $1.63 against the expected $1.45, not only underscores its operational efficiency but also reflects the underlying strength of its business model. This achievement is a testament to the hard work of CMC's workforce and the company's adept navigation through cyclical market dynamics and varying economic conditions across its operational geographies.
Amidst a backdrop of fluctuating market conditions, CMC's leadership has taken proactive steps to bolster investor confidence and solidify its financial foundation. The announcement to augment its common stock repurchase program by $500 million, thereby elevating the total potential investment to $850 million, signals a strong earnings capacity and a substantial free cash flow earmarked for enhancing shareholder value. This strategic move reflects confident stewardship and an assertive approach toward capital allocation, reinforcing CMC's robust financial health.
Moreover, CMC's strategic acquisitions underscore its expansion strategy and knack for identifying assets that fortify its market position against macroeconomic volatilities, including interest rate fluctuations. The companys focus on acquisitions that integrate well with its core operations and strategic direction not only streamlines its portfolio but also enhances its competitive edge, setting a solid groundwork for sustainable growth.
The steel and metal industry, marked by its susceptibility to economic cycles and regulatory changes, poses both challenges and opportunities for CMC. The companys extensive involvement in the construction sector, harnessing sustainable steelmaking processes, and its emphasis on recycling align with broader market trends favoring eco-friendly and efficient manufacturing practices. Such strategic initiatives are crucial in maintaining a favorable profit margin and catering to the evolving demands of a more environmentally conscious consumer base.
CMCs engaging narrative further unfolds in its feature in the docuseries "REPURPOSED," which accentuates the company's innovative approaches to steelmaking and its pivotal role in promoting sustainability within the construction industry. This public portrayal not only amplifies CMC's commitment to eco-friendly practices but also serves to educate and engage a broader audience on the importance of metal recycling and sustainability in industrial manufacturing.
In conclusion, Commercial Metals Company's strategic maneuversincluding robust financial performance, strategic acquisitions, a substantial share repurchase program, and a strong emphasis on sustainabilityhighlight its resilience and forward-thinking approach in the steel and metal sector. These strategic facets, augmented by the companys adaptability to market dynamics and its commitment to environmental stewardship, underscore CMC's potential for sustained growth and profitability in a competitive landscape.
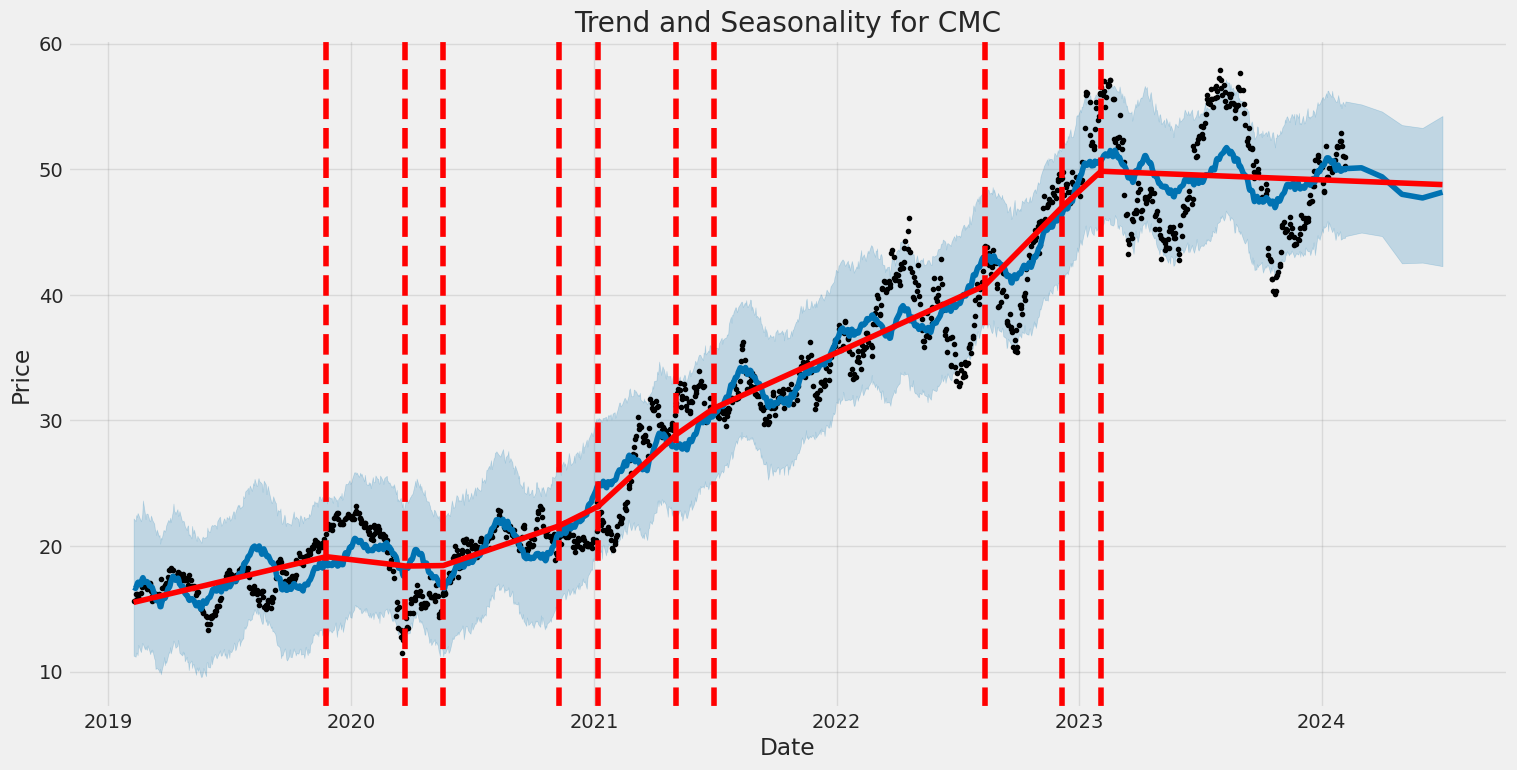
The volatility of Commercial Metals Company (CMC) from February 2019 to February 2024 can be summarized as follows: First, the statistical analysis using the Zero Mean - ARCH Model reveals no predictive power in the model for asset returns, indicating that past price movements do not predict future price movements. Second, the model identifies a significant level of volatility within the asset returns of CMC as captured by the omega and alpha coefficients, indicating that CMC's stock prices have experienced fluctuations during this period. Third, the confidence intervals for these coefficients are fairly tight, suggesting a high degree of certainty regarding the observed volatility levels in CMC's stock prices.
| Statistic Name | Statistic Value |
|---|---|
| Log-Likelihood | -2973.23 |
| AIC | 5950.46 |
| BIC | 5960.73 |
| No. Observations | 1256 |
| omega | 5.4535 |
| alpha[1] | 0.2278 |
Analyzing the financial risk associated with a $10,000 investment in Commercial Metals Company (CMC) over a one-year period requires a sophisticated approach leveraging both volatility modeling and machine learning predictions. These two methodologies, when combined, offer a robust framework for understanding and forecasting the potential risk and return dynamics of an equity investment.
The volatility modeling technique is pivotal in estimating the fluctuations in the stock price of Commercial Metals Company. This model assesses historical price movements to forecast future volatility, thereby enabling investors to gauge the expected variations in the stock price. It systematically captures the persistence of volatility shocks over time, which is crucial for accurately pricing risk and structuring investment decisions. In essence, this model helps in understanding how volatile the stock is, which is a key determinant of the risk associated with the investment.
On the other hand, the machine learning predictions approach, particularly using an algorithm akin to the RandomForestRegressor, plays a vital role in forecasting future stock returns. This model learns from historical data, identifying patterns and relationships between various market factors and the stock's performance. By incorporating numerous decision trees to make predictions and averaging the results, this approach minimizes overfitting and provides a more generalized forecast of stock returns. Consequently, it enhances the accuracy of the investment risk and return predictions, offering a comprehensive insight into the potential future performance of the Commercial Metals Company stock.
Integrating the insights from volatility modeling with those from machine learning predictions allows for a nuanced analysis of the investment in CMC. The forecasted volatility, alongside the predicted stock returns, facilitates the computation of the Value at Risk (VaR), a widely used risk management tool. VaR calculates the maximum potential loss over a certain period, given normal market conditions, at a specified confidence level.
For the $10,000 investment in Commercial Metals Company, the calculated annual VaR at a 95% confidence interval stands at $336.67. This figure indicates that there is a 5% chance that the investment will lose more than $336.67 over the one-year period, under normal market conditions. Such a quantification of risk is invaluable for investors, as it provides a clear monetary figure for the potential downside risk, thereby assisting in making informed investment decisions.
In summary, the combination of volatility modeling and machine learning predictions offers a dynamic and comprehensive approach to understanding and managing the financial risk of equity investments. By accurately estimating stock volatility and forecasting returns, investors can better navigate the complexities of the market, making informed decisions that align with their risk tolerance and investment objectives. This analysis, particularly through the calculated VaR, underscores the potential risks in investing in the Commercial Metals Company stock, highlighting the effectiveness of integrating advanced analytical models in the risk assessment process.
Analyzing the options chain for Commercial Metals Company (CMC) based on the Greeks, several factors including delta, gamma, vega, theta, and rho need consideration to identify the most profitable call options. These options' profitability is also contingent on the target being a 5% increase over the current stock price.
Starting with delta, which represents the rate of change of the option's price with respect to the price of the underlying asset, options with a higher delta are generally more responsive to changes in the stock's price. For instance, the option with a strike price of $25.0 expiring on 2024-03-15 has a very high delta of 0.9823854924. This suggests that it would be more profitable as the price of CMC approaches this strike price due to the high sensitivity to the stock's price movement.
However, gamma, which represents the rate of change in delta as the underlying stock price changes, also plays a crucial role. A higher gamma indicates that the options delta is more sensitive to changes in the underlying stock price. The option with a strike price of $50.0 expiring on 2024-03-15 has a higher gamma of 0.0765040763, suggesting greater potential for profitability as the underlying stocks price approaches this level, due to the acceleration of deltas change.
Vega measures the sensitivity of the option's price to changes in the volatility of the underlying asset. In this context, the call option with a strike price of $45.0 expiring on 2024-06-21 has an exceptionally high vega of 9.6605727847. This indicates that an increase in the stocks volatility could substantially increase this option's profitability, making it an attractive choice for traders expecting volatility.
Theta, the rate at which an options price declines as the expiration date approaches, is also critical. Options with a lower magnitude of theta are generally more desirable as they lose value at a slower rate. The option with a strike price of $25.0 expiring on 2024-06-21 has a theta of -0.0030639035, losing value very slowly over time, which can be advantageous for maintaining profitability.
Lastly, rho, which measures the sensitivity of the options price to changes in the risk-free interest rate, can affect long-dated options more significantly. The call option with a strike price of $45.0 expiring on 2024-09-20, with a rho of 17.0608072423, indicates that a rise in interest rates could enhance its profitability, making it an option worth considering for traders factoring in potential changes in interest rates.
In conclusion, for traders targeting a 5% increase in CMCs stock price, focusing on options with a desirable combination of the Greeks is vital. The call option with a strike price of $50.0 expiring on 2024-03-15 stands out due to its favorable gamma, suggesting amplified profitability as the stock approaches this price. Additionally, the option with a strike price of $45.0 expiring on 2024-06-21, with its high vega, is attractive for those anticipating increased volatility. Lastly, for those considering the impact of interest rate changes, the call option with a strike price of $45.0 expiring on 2024-09-20, with its high rho, could offer greater profitability in a rising rate environment.
Similar Companies in Steel:
Report: Olympic Steel, Inc. (ZEUS), Olympic Steel, Inc. (ZEUS), Report: Steel Dynamics, Inc. (STLD), Steel Dynamics, Inc. (STLD), Report: Nucor Corporation (NUE), Nucor Corporation (NUE), TimkenSteel Corporation (TMST), Universal Stainless & Alloy Products, Inc. (USAP), POSCO Holdings Inc. (PKX), Report: Outokumpu Oyj (OUTKY), Outokumpu Oyj (OUTKY), Report: United States Steel Corporation (X), United States Steel Corporation (X), Report: Reliance Steel & Aluminum Co. (RS), Reliance Steel & Aluminum Co. (RS), Report: ArcelorMittal S.A. (MT), ArcelorMittal S.A. (MT), Companhia Siderurgica Nacional (SID), Ternium S.A. (TX), Schnitzer Steel Industries, Inc. (SCHN)
https://finance.yahoo.com/news/cmc-featured-season-two-national-141500795.html
https://finance.yahoo.com/news/cmc-announces-increase-existing-share-213000188.html
https://finance.yahoo.com/news/commercial-metals-company-nyse-cmc-133047122.html
https://finance.yahoo.com/news/buy-commercial-metals-company-nyse-120350696.html
https://finance.yahoo.com/news/commercial-metals-cmc-suffers-weak-161200448.html
https://finance.yahoo.com/news/commercial-metals-cos-dividend-analysis-160342463.html
https://finance.yahoo.com/news/strong-sell-stocks-january-23rd-101500927.html
https://www.sec.gov/Archives/edgar/data/22444/000002244424000017/cmc-20231130.htm
Copyright © 2024 Tiny Computers (email@tinycomputers.io)
Report ID: 52QxZT
Cost: $0.69967
https://reports.tinycomputers.io/CMC/CMC-2024-02-07.html Home