Devon Energy Corporation (ticker: DVN)
2024-03-01
 Devon Energy Corporation (ticker: DVN) is a prominent player in the energy sector, particularly known for its operations in oil and natural gas exploration and production. Founded in 1971 and headquartered in Oklahoma City, Oklahoma, Devon Energy has transitioned through the energy landscape to focus on efficient hydrocarbon extraction and environmentally responsible operations. With a robust portfolio that spans some of the most prolific oil and natural gas plays in the United States, including the Delaware Basin, Eagle Ford, and Anadarko Basin, Devon Energy has carved out a significant presence in the domestic energy market. The company emphasizes technology and innovation in its operational strategy, aiming to enhance production efficiencies while minimizing environmental impact. This approach, combined with a commitment to sustainability and community engagement, underscores Devon Energy's role as a forward-thinking energy producer. As of the latest analysis, DVN's financial health and strategic investments in resource-rich regions underscore its potential for growth and resilience in the volatile energy sector.
| Address | 333 West Sheridan Avenue | City | Oklahoma City | State | OK |
|---|---|---|---|---|---|
| Zip Code | 73102-5015 | Country | United States | Phone Number | 405 235 3611 |
| Website | https://www.devonenergy.com | Industry | Oil & Gas E&P | Sector | Energy |
| Total Pay CEO | 4,119,850 | Total Pay CFO | 1,845,566 | Total Pay COO | 1,976,317 |
| Market Cap | 28,229,244,928 | Day's Low | 43.84 | Day's High | 44.4399 |
| Dividend Rate | 2.42 | Dividend Yield | 0.055 | Payout Ratio | 0.5877 |
| Five Year Avg Dividend Yield | 4.44 | Volume | 7,465,905 | Average Volume | 8,848,349 |
| Market Cap | 28,229,244,928 | Fifty Two Week Low | 40.47 | Fifty Two Week High | 57.13 |
| Enterprise Value | 33,739,941,888 | Profit Margins | 0.24558 | Shares Outstanding | 640,700,032 |
| Book Value | 18.973 | Price To Book | 2.3222475 | Earnings Quarterly Growth | -0.041 |
| Net Income To Common | 3,747,000,064 | Trailing Eps | 5.84 | Forward Eps | 5.75 |
| Total Cash | 875,000,000 | Total Debt | 6,449,999,872 | Total Revenue | 15,258,000,384 |
| Free Cashflow | 1,405,624,960 | Operating Cashflow | 6,544,000,000 | Revenue Growth | 0.007 |
| Return On Assets | 0.12707 | Return On Equity | 0.32169 | Earnings Growth | -0.054 |
| Sharpe Ratio | -0.5516450458172679 | Sortino Ratio | -8.400257250100116 |
| Treynor Ratio | -0.1661721112712044 | Calmar Ratio | -0.6747931803978975 |
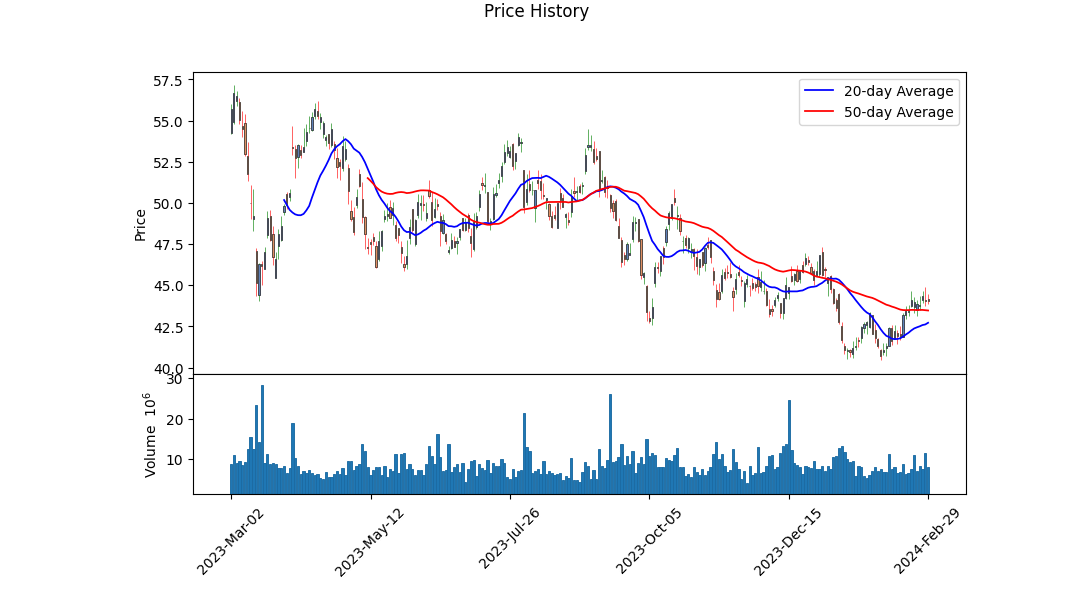
Analyzing the provided data on DVN, a comprehensive review of technical indicators, fundamental analysis, and risk-adjusted performance measures presents a nuanced outlook for the stock's future price movements. The summary of technical indicators reveals a recent downward trend with the OBV (On-Balance Volume) turning negative, indicating selling pressure. The missing MACD (Moving Average Convergence Divergence) histogram values in the earlier period and later showing a positive trend point towards a potential reversal or stabilization in price.
The fundamental analysis, supported by strong gross margins (51.914%) and EBITDA margins (48.86%), suggests operational efficiency and significant profitability. This efficiency, combined with the considerable operating margins (33.96%), underscores a robust business model. Nonetheless, the trailing PEG ratio not being specified underscores the necessity for further investigation to understand future growth expectations fully.
The financial highlights, including an increase in tangible book value, net income, and EBITDA, reflect positive operational success. However, the presence of high net debt raises concerns about the financial leverage of the company but is somewhat mitigated by the significant free cash flow generation. The rising net income and operating cash flow emphasize the company's capability to maintain profitability and operational efficiency.
Risk-adjusted performance measures (Sharpe, Sortino, Treynor, and Calmar Ratios) all reflect negative values, hinting at the stock's underperformance relative to a risk-free rate over the past year. This suggests that investors have been compensated insufficiently for the risks undertaken. Specifically, the high negative Sortino ratio indicates poor downside risk adjustment, which might deter risk-averse investors.
Analyst expectations outline a mixed but overall optimistic view, with earnings estimates showing an uptick for the upcoming year (2025) compared to the current year. Revenue growth is modestly positive, suggesting steady if not spectacular, business growth.
Considering these multifaceted inputs, the projection for DVN over the next few months appears cautiously optimistic. The technical indicators suggest a potential stabilization or mild recovery from recent selling pressures, supported by solid fundamentals showcasing the company's profitability and operational efficiency. However, the adverse risk-adjusted performance measures signal the need for caution, reflecting an environment where DVN's stock has not adequately rewarded risk undertakings in the past year.
Investors should weigh the company's strong operational indicators against the backdrop of its financial leverage and the broader market's risk tolerance. Given the current analysis, DVN may experience moderate price appreciation in the next few months, driven by its underlying business strengths but tempered by its risk profile and market conditions. Continuous monitoring of the mentioned ratios, analyst expectations, and technical indicators will be crucial to refining this outlook as new data becomes available.
In evaluating Devon Energy Corporation (DVN) through the lens of The Little Book That Still Beats the Market, two critical metrics emerge: Return on Capital (ROC) and Earnings Yield. Devon Energy Corporation demonstrates a robust ROC of 21.30%, a figure that substantially underscores the company's efficacy in deploying its capital to generate profits. Such a high ROC indicates that Devon Energy is not only efficiently utilizing its capital but is also adept at turning investments into lucrative returns, a quality that positions it favorably among its peers in the energy sector. Additionally, the Earnings Yield for Devon Energy stands at an impressive 13.30%. This metric, serving as a reverse P/E ratio, suggests that for every dollar invested in the company, investors can expect to earn 13.30 cents in earnings. This high earnings yield is indicative of the stock being potentially undervalued, presenting an attractive opportunity for investors seeking substantial returns on investments in fundamentally strong companies. Together, these figures illuminate the financial strength and appeal of Devon Energy within the market, marking it as a potentially profitable investment in accordance with the principles presented in The Little Book That Still Beats the Market.
Analyzing Devon Energy Corporation (DVN) through the lens of Benjamin Graham's value investing principles provides a comprehensive overview of its investment potential. Here's how DVN's key metrics align with Graham's criteria:
-
Price-to-Earnings (P/E) Ratio: DVN has a P/E ratio of 6.88, which is considered low and potentially attractive by Graham's standards. He preferred stocks with low P/E ratios relative to their industry peers, as it may indicate an undervalued stock. However, the comparison to the industry P/E ratio is crucial, and unfortunately, the industry P/E ratio information is not provided. Generally, a P/E ratio significantly lower than the industry average would be appealing to a Graham-style investor.
-
Price-to-Book (P/B) Ratio: With a P/B ratio of 1.15, DVN is trading just above its book value. Graham often sought out stocks trading below their book value as a signal of undervaluation. However, a P/B ratio slightly above 1, as in the case of DVN, may still be considered reasonably priced, especially in an era where finding stocks below book value is increasingly rare.
-
Debt-to-Equity Ratio: DVN's debt-to-equity ratio stands at 0.53, indicating that the company does not heavily rely on debt to finance its operations. Graham preferred companies with low debt-to-equity ratios to minimize financial risk. DVN's ratio suggests a balance between using debt to leverage growth and maintaining financial stability, which falls within Graham's acceptable range.
-
Current and Quick Ratios: Both the current and quick ratios for DVN are 1.07, reflecting the company's ability to cover its short-term liabilities with its short-term assets. Graham emphasized the importance of financial stability, and these ratios suggest that DVN is in a stable position to meet its short-term obligations. However, Graham typically looked for higher ratios to ensure a greater margin of safety.
-
Earnings Growth: While specific data on earnings growth over the past years is not provided, Graham sought companies with a consistent track record of earnings growth. Investors would need to assess DVN's earnings history to determine its alignment with Graham's criteria in this area.
In summary, Devon Energy Corporation demonstrates characteristics that align with several of Benjamin Graham's principles for value investing, namely in terms of its low P/E ratio and reasonable debt levels. However, its P/B ratio, while not significantly above book value, and its liquidity ratios, though stable, could be scrutinized further in the context of Graham's preference for stocks trading below book value and having higher liquidity ratios. The absence of industry P/E ratio data and specific earnings growth history leaves some gaps in the analysis, which investors would need to address to fully evaluate DVN's suitability as a Graham-style investment. Prospective investors should conduct further research, particularly into the company's earnings growth and industry comparisons, to make a fully informed decision.Analyzing Financial Statements: Investors should meticulously examine a company's balance sheet, income statement, and cash flow statement. Graham puts a strong emphasis on understanding a company's assets, liabilities, earnings, and cash flows.
Devon Energy Corp/DE (Symbol: DVN) has shown substantial financial activities and results through its quarterly reports filed over the specified periods in 2021 and 2023. The following analysis breaks down key aspects of their financial statements:
-
Assets Growth and Composition: Assets have grown from $20.07 billion on June 29, 2021, to $24.24 billion by the end of September 2023, indicating a significant expansion in the company's asset base. A closer inspection reveals the composition of assets includes oil and gas property successful effort method net, property, plant, and equipment net, right-of-use assets non-current, and investments among others. This structure reflects the company's investment in long-term assets essential for its operations in the energy sector.
-
Revenue Streams: Revenue from contracts with customers excluding assessed tax and other incomes, showed variations with a notable increase by the third quarter of 2023 reaching $11.13 billion compared to $3.91 billion in the second quarter of 2021. This indicates a robust growth in the company's revenue-generating capabilities, primarily driven by its core operations.
-
Liabilities Management: Liabilities also saw an increase from approximately $9.56 billion in June 2021 to about $12.56 billion by September 2023. The managed growth of liabilities against the assets shows a balanced approach towards leveraging and financing its operations. The structured increase in long-term debt and other liabilities complements its asset growth, showing a strategic approach to funding expansions and operations.
-
Operating Costs and Profitability: Cost of goods and services sold and depreciation, depletion, and amortization are significant expenses that impact profitability. Despite these costs, Devon Energy has maintained a profitable stance with net income showing positive results across the quarters. This profitability, amidst the operational costs, highlights efficient operational management and financial health.
-
Share-Based Compensation: The financials also reflect considerations for share-based compensation, signifying the company's commitment to aligning employee interests with shareholder value creation. This is indicated by allocated share-based compensation expenses noted across quarters.
-
Financial Strategies: The reports show strategic financial activities, including repayments of long-term debt, restructuring charges, and acquisitions indicating Devon Energy's active management of its financial structure to optimize for growth and efficiency.
-
Cash Flows: Net cash provided by operating activities presents the company's ability to generate cash from its core business operations, which is crucial for sustaining its operations and facilitating growth. The varying levels of cash flow highlight the cyclical nature of cash inflows and the impact of operational decisions.
Through meticulous examination of Devon Energy Corp/DE's financial statements, it is observed that the company has experienced significant growth, managed its liabilities, and maintained profitability through strategic operations and financial management. These elements are critical in evaluating the company's financial health and operational efficiency, aligning with Benjamin Graham's principles of understanding a company's financial fundamentals.Based on the extensive dividend history provided for the symbol 'DVN', it's clear that the company has a strong track record of consistently paying dividends to its shareholders. This history showcases various adjustments to the dividend amounts over time, indicating the company's commitment to returning value to its shareholders through varying economic conditions. Such a record aligns well with Benjamin Graham's principles favoring companies that demonstrate a consistent and reliable dividend payment history, as outlined in "The Intelligent Investor."
The data reveals fluctuations in dividend amounts, with periodic adjustments that could be indicative of the company's financial health and management's responsiveness to changing market conditions. For example, the adjusted dividend reflects changes in the company's allocation of profits back to its shareholders, demonstrating a level of financial discipline and commitment to shareholder value that would likely be viewed favorably from the perspective of Graham's investment philosophy.
Through this lens, an investor adhering to Graham's principles might see 'DVN's consistent payment history despite the adjustments as a positive indicator. It suggests not only the company's ability to generate profits over time but also its prioritization of shareholders through direct financial returns. This could make it an attractive option for those who value dividend yield and stability as part of their investment criteria, aligning with the conservative, long-term investment strategy advocated by Graham.
| Statistic Name | Statistic Value |
| R-squared | 0.261 |
| Adj. R-squared | 0.261 |
| F-statistic | 444.3 |
| Prob (F-statistic) | 1.11e-84 |
| Log-Likelihood | -3255.7 |
| AIC | 6515 |
| BIC | 6526 |
| const | 0.0356 |
| coef | 1.4557 |
| std err | 0.069 |
| t | 21.079 |
| P>|t| | 0.000 |
| [0.025 | 1.320 |
| 0.975] | 1.591 |
| Omnibus | 200.196 |
| Kurtosis | 10.595 |
| Alpha | 0.035574457054666074 |
| Beta | 1.4556563588671052 |
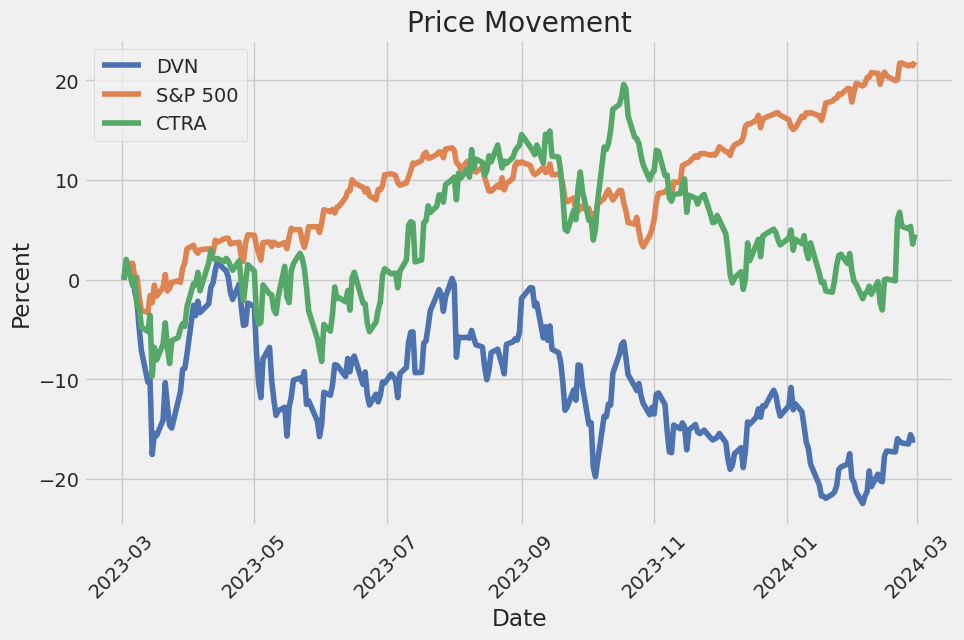
The relationship between DVN (Devon Energy Corporation) and SPY (SPDR S&P 500 ETF Trust) reflects a positive correlation, as indicated by the linear regression model's coefficient (beta) of 1.4557, suggesting that for every one unit change in SPY, DVN is expected to change by approximately 1.46 units in the same direction. The alpha value of 0.035574457054666074 represents the model's intercept, implying that when SPY is zero, DVN is expected to have a value of approximately 0.036. However, it is crucial to consider the relatively low R-squared value of 0.261, which suggests that only about 26.1% of the variability in DVN's returns can be explained by the changes in the SPY's returns.
The statistics extracted from the OLS regression analysis provide a comprehensive breakdown of the relationship between these two securities. Despite the moderate positive beta, indicating a tendency for DVN to move in the same direction as the market (SPY), the modest R-squared value points towards a significant portion of DVN's price movements being influenced by factors other than those directly affecting the broader market. This insight is critical for investors considering DVN in the context of a diversified portfolio, as it highlights the potential for DVN to be affected by both market-wide influences and factors specific to its sector or operational environment.
Devon Energy Corporation (DVN) held its earnings call for the fourth quarter and full-year 2023, presenting a robust outlook for 2024 and highlighting significant achievements from the past year. The discussion underlined Devon's capacity for sustained free cash flow generation and its strategic focus on rewarding shareholders through a mix of dividends and share buybacks, emphasizing the company's performance against the backdrop of broader market conditions.
President and CEO, Rick Muncrief, shared notable accomplishments in 2023, including an 8% production growth rate, leading to record-high oil production. The company's disciplined reinvestment strategy not only yielded the 14th consecutive quarter of free cash flow but also facilitated increasing cash returns to shareholders. This translated to a commendable cash return yield of around 10% through buybacks and dividends. Muncrief also outlined plans for 2024 aiming at improved capital efficiency with a steady capital program for maintaining production volumes around 2023 exit levels while reducing capital expenditure by 10%.
The discussion moved towards operational efficiencies, particularly in the Delaware Basin where Devon plans to concentrate a significant portion of its capital. This focus is expected to enhance well productivity by up to 10% year-over-year. The Delaware Basin remains central to Devons growth strategy, accounting for about 70% of the company's capital allocation in New Mexico. The refinement in capital allocation, coupled with infrastructure improvements, positions Devon to capitalize on its extensive resource in the basin effectively.
On the financial front, CFO Jeff Ritenour recapped the company's financial performance, noting that Devon generated $1.7 billion in operating cash flow in Q4, culminating in $827 million of free cash flow for the quarter and $2.7 billion for the full year. This performance underscores Devon's operational and financial discipline, even amid lower commodity prices. Ritenour also highlighted the company's commitment to returning value to shareholders, with 70% of free cash flow targeted for cash returns, and the remainder aimed at further strengthening the balance sheet through activities such as share repurchases and dividend payments.
In conclusion, Devon's earnings call conveyed a positive outlook for 2024, backed by strategic operational focuses, particularly in the Delaware Basin, and a consistent commitment to capital discipline and shareholder returns. The company's leadership emphasized their confidence in the resource depth and the strategic priorities set to drive long-term value creation, pointing towards a promising year ahead for Devon Energy.
Devon Energy Corporation (DVN), an independent oil and natural gas exploration and production company, focuses on operations that are onshore in the United States. As of September 30, 2023, their operational strategy emphasized on capital and operational efficiencies, maximizing free cash flow, maintaining low leverage, delivering cash returns to shareholders, and achieving excellence in environmental, social, and governance (ESG) aspects.
For the third quarter of 2023, Devon reported several operational highlights, emphasizing their strategic focus areas. Oil production for this period saw a 9% increase year over year, amounting to 321 MBbls/d. The company made significant strides in returning value to shareholders through its authorized share repurchase program, repurchasing approximately 39.6 million of its common shares for about $2.1 billion. Devon also continued to prioritize debt repayment and liquidity management, retiring $242 million of senior notes in the third quarter and maintaining $3.8 billion of liquidity, including $0.8 billion in cash. Additionally, operating cash flow for the third quarter was $1.7 billion, contributing to a trailing twelve-month total of $6.7 billion. Devon also paid significant dividends, including variable dividends, totaling $312 million in the third quarter, with a declared payment of approximately $492 million for the fourth quarter of 2023.
In terms of financial performance, the company posted net earnings attributable to Devon of $910 million, or $1.42 per diluted share, for the third quarter of 2023. The core earnings, a non-GAAP measure, were $1.1 billion, or $1.65 per diluted share. The changes in net earnings from the second quarter to the third quarter of 2023, and a year-to-date comparison from 2022 to 2023, reflect fluctuations in oil production volumes, realized prices, production expenses, and other operational factors such as commodity hedge valuation changes and marketing and midstream operations.
Devon Energys management continued to focus on moderated capital investment and production growth amidst volatile commodity prices and economic uncertainty, aiming to optimize shareholder returns through share repurchases and dividend payments while maintaining a strong liquidity position. These strategic priorities align with Devon's long-term goal to build economic value and sustain operational excellence within a disciplined capital structure.
The summary emphasizes Devon Energy Corporation's operational efficiency, effective capital allocation, shareholder return strategy, and solid financial performance amidst the dynamic challenges of the oil and gas industry. As of the end of the third quarter of 2023, Devon demonstrated its ability to adapt to market conditions while focusing on long-term value creation and sustainability initiatives.
In the ever-evolving landscape of the energy sector, Devon Energy Corporation (DVN) emerges as a compelling entity, presenting a narrative of resilience, strategic acumen, and adaptability. As the world contemplates a future increasingly inclined towards sustainability and the challenges of fluctuating energy markets, Devon Energy's journey, punctuated by strategic mergers, innovative financial policies, and operational efficiencies, offers valuable insights.
The transformative merger with WPX Energy in early 2021 marked a pivotal point for Devon Energy, not just in terms of scaling its operational capabilities but also in solidifying its financial framework. This merger catalyzed the company into becoming a free cash flow powerhouse, laying down a robust platform for enhancing shareholder value through dividends, share repurchases, and strategic acquisitions. The implementation of the industry's first fixed-plus-variable dividend policy post-merger is particularly noteworthy. This innovative policy, predicated on distributing a fixed base dividend alongside up to 50% of surplus free cash flow, underscores Devon's commitment to aligning shareholder returns with its financial performance.
The company's operational strategy in the Permian Basin, where it competes fiercely with peers like Diamondback Energy, showcases its focus on cost-effective exploration and production methods. This approach, coupled with strategic acquisitions aimed at optimizing its asset portfolio, not only cushions Devon against the volatility of oil prices but also emphasizes its resilience in a competitive landscape.
Financial health is a critical pillar of Devon Energy's stature in the energy sector. With a market capitalization hovering around the $28 billion mark as of February 29, 2024, Devon stands out for its robust financial discipline. The company's commitment to maintaining a manageable debt level, paired with a disciplined capital allocation strategy, assures its resilience against market headwinds. This financial prudence is reflected in its operational efficiencies and the strategic management of its dividend policy, which, despite its volatility, highlights the company's adaptability to market conditions.
The potential acquisition of Enerplus further demonstrates Devon's strategic intent to augment its operational footprint and scale. While the move underscores a broader industry trend towards consolidation, it equally highlights Devon's agility in seizing strategic opportunities to bolster its market position and enhance shareholder value.
Amidst market dynamics and industry challenges, Devon Energy's focus on sustainability and environmental stewardship also merits attention. The company's initiatives to reduce its environmental footprint align with a global shift towards more sustainable energy practices, positioning Devon as a forward-looking player in the sector.
In sum, Devon Energy Corporation stands as a testament to strategic foresight, operational resilience, and financial acumen in the complex terrain of the U.S. energy sector. Its journey, characterized by strategic mergers, innovative dividend policies, and a firm commitment to sustainability, not only reflects its adaptability to changing market dynamics but also underscores its potential as a promising investment avenue in the energy landscape. The narrative of Devon Energy, through highs and lows, serves as a microcosm of the broader challenges and opportunities within the energy sector, offering significant lessons in resilience and strategic growth.
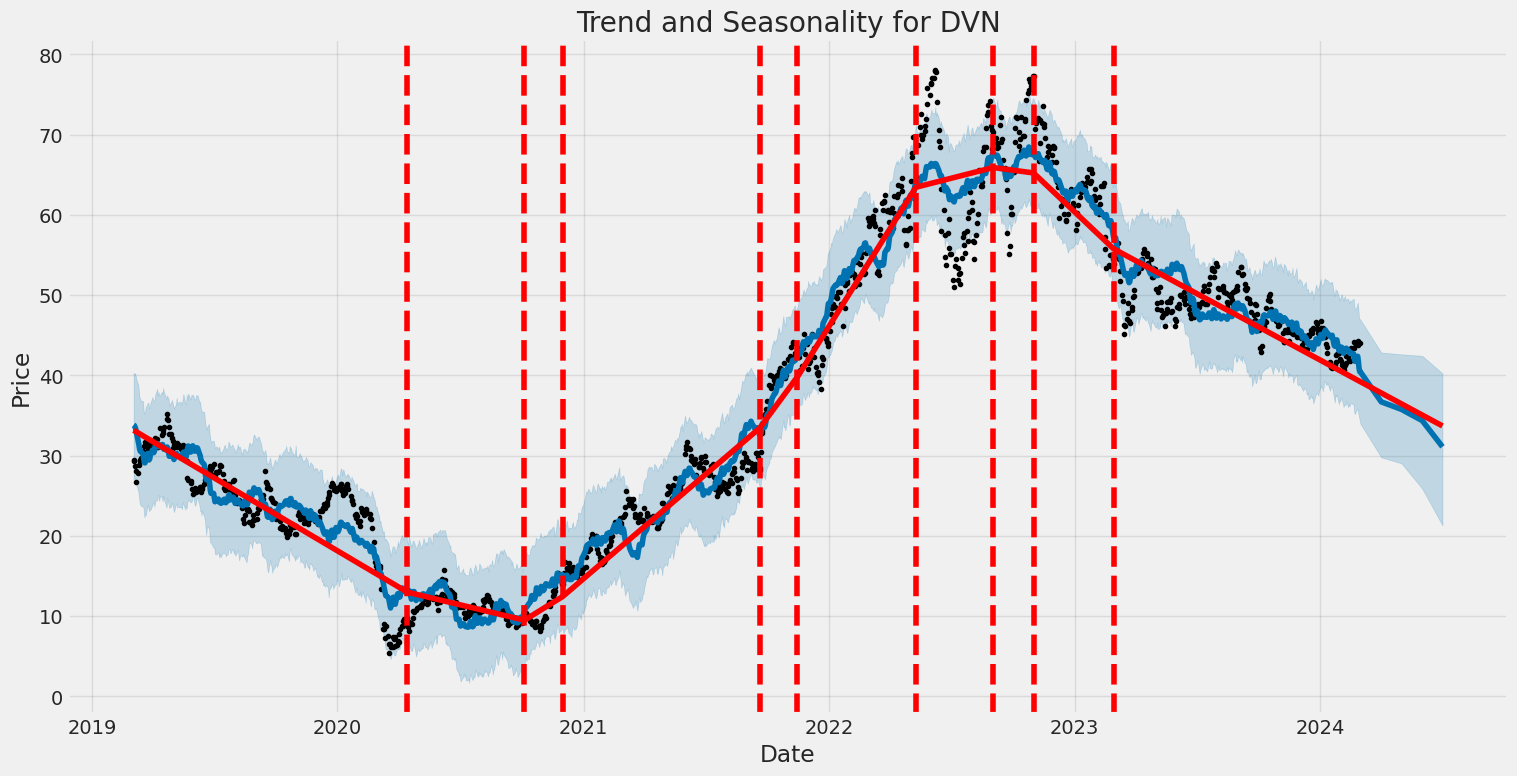
Devon Energy Corporation (DVN) exhibited significant volatility from 2019 to 2024, as indicated by the ARCH model analysis. The model, specifically designed to capture and measure volatility in financial time series data, highlighted the fluctuations in DVN's returns with an omega value of 10.2906, suggesting a considerable level of volatility. Furthermore, the alpha[1] value of 0.2231 in the model points to a persistence in the volatility, indicating that large changes in value could be followed by further large changes.
| Statistic Name | Statistic Value |
|---|---|
| Mean Model | Zero Mean |
| Vol Model | ARCH |
| Log-Likelihood | -3367.09 |
| AIC | 6738.17 |
| BIC | 6748.44 |
| No. Observations | 1257 |
| omega | 10.2906 |
| alpha[1] | 0.2231 |
To assess the financial risk of investing $10,000 in Devon Energy Corporation (DVN) over a year, a blend of volatility modeling and machine learning predictions was employed. This analysis aims to provide an intricate understanding of the stock's behavior by examining its past price fluctuations and employing predictive algorithms to forecast future returns.
Volatility modeling, typically a critical tool in financial analysis for assessing risk in investment portfolios, was used to dig into the inherent volatility of Devon Energy Corporation's stock. By evaluating the stock's historical price data, this method enables the identification of patterns in volatility over time. Such volatility can be indicative of the risk associated with the stock as it measures the degree to which the price varies over a certain period. In the context of this analysis, it was essential for understanding the dynamics of price fluctuations and the underlying risk for investors.
Complementing this, machine learning predictions were implemented through a predictive model designed to forecast the future returns of Devon Energy Corporation's stock. By analyzing historical data, the model aims to identify patterns and correlations that can be projected into the future. This method is particularly useful for investors looking to make informed decisions based on potential future performance, factoring in not just the static historical volatility but also predictive insights into how the stock might move.
The crux of this analysis focused on calculating the Annual Value at Risk (VaR) at a 95% confidence interval, which amounted to $328.39 for a $10,000 investment in Devon Energy Corporation (DVN). Value at Risk is a widely used risk management tool that quantifies the maximum potential loss over a specified timeframe at a given confidence level. In this context, it suggests that there is a 95% probability that the investor will not lose more than $328.39 over the course of one year on a $10,000 investment in DVN under normal market conditions. This figure is instrumental in providing investors with a clear metric of the potential downside risk involved in this investment.
Through the combined application of volatility modeling to analyze past stock behavior and machine learning predictions to project future trends, a nuanced view of the financial risks associated with investing in Devon Energy Corporation is revealed. By understanding both the historical volatility of the stock and having forecasts of potential future returns, investors can make more informed decisions, weighing the anticipated performance against the quantified risk, as represented by the VaR metric. This analytical approach underscores the value of integrating advanced statistical techniques with predictive modeling to manage and understand investment risk in the volatile energy sector.
Analyzing the options data for Devon Energy Corporation (DVN), particularly focusing on call options and based on "the Greeks," we can derive insights on the most profitable options. Our aim is to target a stock price that is 5% over the current price, and thus, options that have a higher sensitivity to the underlying stock price (Delta), lower rate of decay (Theta), and reasonable volatility sensitivity (Vega) could be considered more attractive.
One of the prominent options includes the one with an expiration date of 2025-01-17, having a strike price of 27.5. This particular option strikes a balance between a reasonable Delta value of 0.8350405347, indicating a strong sensitivity to the stock price movement while also maintaining a relatively low negative Theta value of -0.0035578493, suggesting it won't lose much value over time due to time decay. Additionally, its Vega of 8.0393617006 shows a reasonable sensitivity to implied volatility, and with a high ROI of 0.3241354975, it suggests a return potential making it a lucrative option.
Another option that stands out is the one expiring on 2025-03-21 with a strike price of 27.5. The Delta of 0.8488554271 indicates a very strong sensitivity to the stocks price movement, almost nearing 1, which means its likely to move almost dollar for dollar with the stock price a desired trait when expecting a rise in the stock price. The Theta at -0.0009345097 indicates minimal time decay impact over the next few days, and its Vega of 7.5168375708 suggests that the option's price is less susceptible to changes in implied volatility. Considering its ROI of 0.0511484594, despite being lower, the high Delta and lower negative Theta make it a considerable option for profitability if the stocks price moves as expected.
Additionally, an intriguing choice is also the option expiring on 2026-01-16 with a strike price of 25.0. This option presents a Delta of 0.8137954433 showing a high degree of price movement alongside the underlying security, coupled with a Theta of 0.0006722943, indicating very slight time decay, which is beneficial over a longer term. Its Vega of 9.3939873731 suggests moderate sensitivity to volatility changes. Its ROI of 0.1017098446, while not the highest, combined with its other Greeks, presents a balanced risk-reward scenario making it another candidate for investment.
Considering the essentials of options trading, it's noteworthy that while the Greeks provide a valuable framework for assessing the potential profitability of options, market conditions, and the underlying stock's performance can significantly impact outcomes. Investors should also account for the risks and their investment strategy when considering these options. Always perform due diligence and possibly engage in further analysis or consult a professional before making investment decisions.
Similar Companies in Oil & Gas E&P:
Coterra Energy Inc. (CTRA), Report: Diamondback Energy, Inc. (FANG), Diamondback Energy, Inc. (FANG), Report: EOG Resources, Inc. (EOG), EOG Resources, Inc. (EOG), ConocoPhillips (COP), Pioneer Natural Resources Company (PXD), Report: EQT Corporation (EQT), EQT Corporation (EQT), Report: Marathon Oil Corporation (MRO), Marathon Oil Corporation (MRO), Permian Resources Corporation (PR), Report: Occidental Petroleum Corporation (OXY), Occidental Petroleum Corporation (OXY), Hess Corporation (HES), Report: Apache Corporation (APA), Apache Corporation (APA), Murphy Oil Corporation (MUR), Report: Chevron Corporation (CVX), Chevron Corporation (CVX), Exxon Mobil Corporation (XOM)
https://www.fool.com/investing/2024/01/20/2-ultra-high-yield-energy-stocks-to-buy-hand-over/
https://www.fool.com/investing/2024/01/21/bull-market-buys-3-dividend-stocks-to-own-for-the/
https://www.fool.com/investing/2024/01/21/these-3-great-value-stocks-are-set-to-soar-in-2024/
https://seekingalpha.com/article/4664243-devon-energy-vs-diamondback-energy-a-battle-of-the-permian
https://www.fool.com/investing/2024/01/28/should-you-buy-the-3-highest-paying-dividend-stock/
https://seekingalpha.com/article/4667321-devon-energy-accumulating-the-dip
https://www.fool.com/investing/2024/02/09/devon-energy-could-soon-join-the-oil-patch-acquisi/
https://www.fool.com/investing/2024/02/14/like-devon-energy-love-high-yield-dividend-stocks/
https://www.youtube.com/watch?v=y5iVRkVK7EQ
https://www.fool.com/investing/2024/02/22/1-stock-i-wouldnt-touch-with-a-10-foot-pole/
https://www.fool.com/investing/2024/02/24/this-ultra-high-yield-dividend-stock-takes-another/
https://www.fool.com/investing/2024/02/25/beat-the-sp-500-with-this-cash-gushing-dividend-st/
https://finance.yahoo.com/news/devon-energy-dvn-beats-q4-223510641.html
https://finance.yahoo.com/news/devon-energy-dvn-q4-earnings-230010703.html
https://www.sec.gov/Archives/edgar/data/1090012/000095017023060838/dvn-20230930.htm
Copyright © 2024 Tiny Computers (email@tinycomputers.io)
Report ID: LcpDHO
Cost: $1.26367
https://reports.tinycomputers.io/DVN/DVN-2024-03-01.html Home