Equinix, Inc. (ticker: EQIX)
2024-01-21
 Equinix, Inc. (ticker: EQIX) is a global company that specializes in enabling interconnection and colocation data center services. Founded in 1998 and headquartered in Redwood City, California, Equinix operates over 200 International Business Exchange (IBX) data centers across 52 markets in 24 countries, providing a platform where enterprises, cloud and IT services, content providers, and network operators can interconnect with each other in close proximity. This interconnectivity is essential for the efficient exchange of data and is fundamental to the performance of digital economies. Equinix's innovative and scalable data centers are designed to offer secure and reliable infrastructure, helping clients to protect, connect, and power their digital transformation initiatives. The company's business model focuses on offering recurring revenue streams, with a diverse customer base comprising more than 9,500 businesses, including a wide range of industries. As a real estate investment trust (REIT), Equinix is required to distribute at least 90% of its taxable income to shareholders, which may also make it an attractive option for income-focused investors. Its strategic acquisitions and expansions highlight its commitment to maintaining a strong presence in the rapidly growing market for data center services worldwide.
| Full Time Employees | 13,046 | Previous Close | 793.74 | Open | 794.25 |
| Day Low | 790.00 | Day High | 806.13 | Dividend Rate | 17.04 |
| Dividend Yield | 0.0212 | Payout Ratio | 143.49% | 5 Year Avg Dividend Yield | 1.68 |
| Beta | 0.612 | Trailing PE | 86.22 | Forward PE | 73.71 |
| Volume | 516,151 | Average Volume | 394,359 | Average Volume 10 Days | 356,100 |
| Market Cap | 75,359,264,768 | 52 Week Low | 661.66 | 52 Week High | 826.00 |
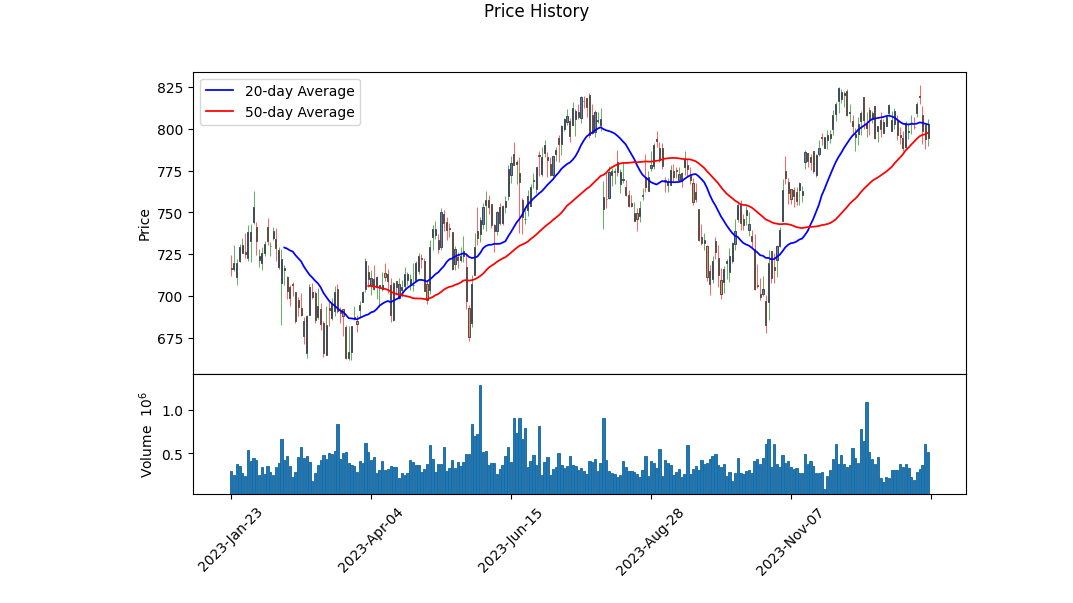
| Price to Sales (TTM) | 10.06 | 50 Day Average | 797.62 | 200 Day Average | 761.33 |
| Trailing Annual Dividend Rate | 13.33 | Trailing Annual Dividend Yield | 1.68% | Enterprise Value | 90,407,747,584 |
| Profit Margins | 11.62% | Float Shares | 93,564,220 | Shares Outstanding | 93,883,400 |
| Shares Short | 1,451,638 | Held Percent Insiders | 0.332% | Held Percent Institutions | 97.376% |
| Short Ratio | 3.25 | Short Percent of Float | 2.02% | Book Value | 126.613 |
| Price to Book | 6.34 | Earnings Quarterly Growth | 30.2% | Net Income to Common | 870,372,992 |
| Trailing EPS | 9.31 | Forward EPS | 10.89 | PEG Ratio | 3.27 |
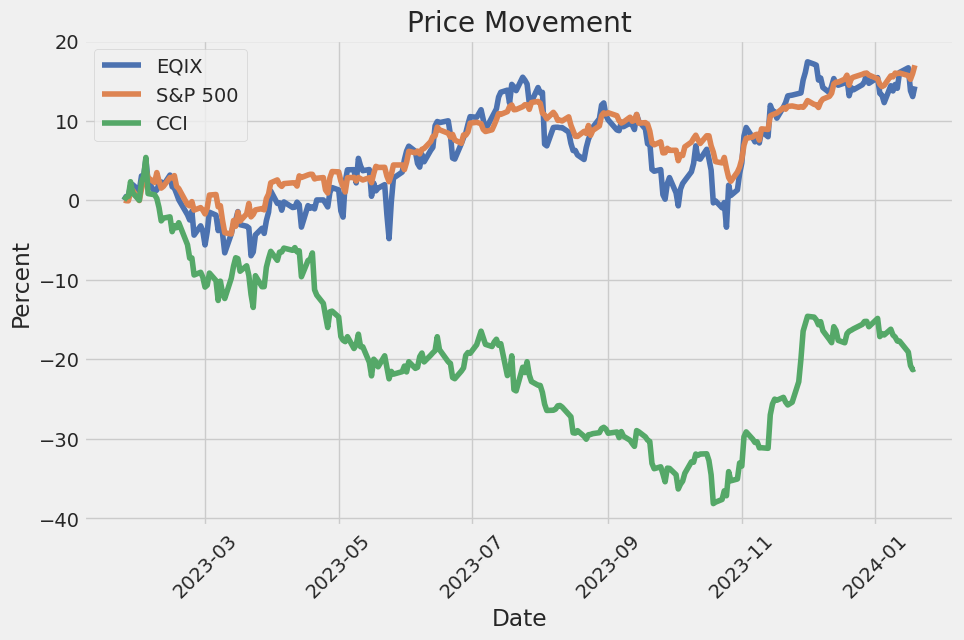
| Enterprise to Revenue | 12.07 | Enterprise to EBITDA | 32.644 | 52 Week Change | 12.06% |
| S&P 52 Week Change | 20.39% | Total Cash | 2,357,497,088 | Total Cash Per Share | 25.111 |
| EBITDA | 2,769,467,904 | Total Debt | 17,381,287,936 | Quick Ratio | 1.789 |
| Current Ratio | 2.052 | Total Revenue | 7,489,844,224 | Debt to Equity | 145.92 |
| Revenue Per Share | 80.371 | Return on Assets | 1.93% | Return on Equity | 7.55% |
| Free Cash Flow | 2,781,564,160 | Operating Cash Flow | 2,978,070,016 | Earnings Growth | 27.4% |
| Revenue Growth | 16.5% | Gross Margins | 45.17% | EBITDA Margins | 36.976% |
| Operating Margins | 14.588% | Current Price | 802.69 | Target High Price | 960.00 |
| Target Low Price | 720.00 | Target Mean Price | 868.62 | Target Median Price | 875.00 |
| Recommendation Mean | 2.0 | ||||
| Sharpe Ratio | -16.81383 | Sortino Ratio | -261.52498 |
| Treynor Ratio | 0.14780 | Calmar Ratio | 0.88636 |
Equinix, Inc. (EQIX) shows a mixed landscape through a deep dive into the technical analysis, fundamental data, and risk-adjusted performance metrics. The company's financials indicate solid revenue growth over the past years, with increased operating income, although the free cash flow saw a significant drop last year but has since recovered. The balance sheet signifies a strong foundation with substantial assets compared to liabilities.
However, the company's risk-adjusted performance over the past year is questionable, with deeply negative Sharpe and Sortino ratios, albeit partly salvaged by a moderate Treynor ratio and a respectable Calmar ratio. This juxtaposition suggests that while the company endures less systemic risk compared to the market beta, individual stock volatility is far from compelling for risk-averse investors.
The stock witnessed a significant increase in moving from around $730 to above $800 towards the end of the displayed data set. This price movement corresponds with the observed On Balance Volume (OBV), which suggests that buying pressure is outweighing selling pressure. However, a flip to a positive Parabolic SAR (stop and reverse) indicates a bullish trend, which subsequently confirms the positive movement in price. Meanwhile, the MACD histogram, though historically volatile, suggests potential short-term reversals with the appearance of negative values even as the price increased. This could indicate a divergence warranting cautious optimism.
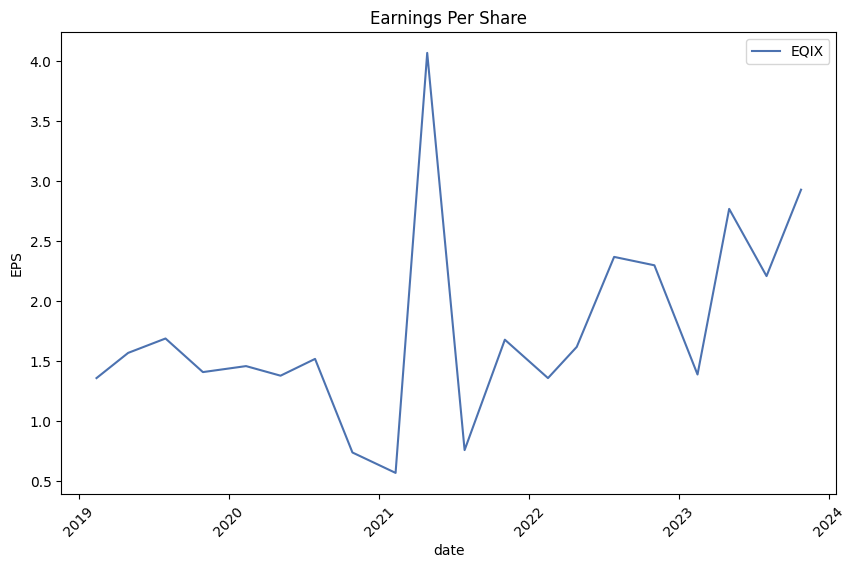
Analyzing the analyst expectations, EQIX shows a promising outlook with earnings estimates projecting an upward trajectory for the next quarter and years. This positive sentiment is echoed in the EPS trend and revisions, where adjustments have remained stable or improved, signaling confident consensus among analysts and potential for growth.
Given the fiscal data coupled with optimistic analyst expectations, one could consider a bullish sentiment for EQIX over the next few months. However, investors must carefully evaluate the volatile technical indicators and be poised to react to potential divergence or trend reversals signaled by indicators such as the MACD histogram.
Market sentiment and liquidity, as measured by the OBV, alongside positive earnings revisions, may catalyze further price appreciation. Yet, the stock's technical configuration requires monitoring, especially considering the risk-adjusted performance ratios that suggest a need for prudent risk management strategies due to the stock's amplified volatility witnessed in the negative Sharpe and Sortino ratios.
The next few months for EQIX will likely be marked by continued monitoring of technical indicators alongside fundamental performance. Any shift in analyst sentiment, fundamental financial shifts, or macroeconomic changes should be taken into account to adjust predictions accordingly. As always, while the technical and fundamental analysis can provide insights, the actual stock price movement may be influenced by a multitude of unforeseen factors in the dynamic market landscape.
| R-squared | 0.370 |
| Adj. R-squared | 0.370 |
| F-statistic | 737.4 |
| Prob (F-statistic) | 4.04e-128 |
| No. Observations | 1,257 |
| DF Residuals | 1,255 |
| Coef (const) | 0.0303 |
| Coef (0) | 0.8801 |
| Alpha | 0.0303 |
| Beta | 0.8801 |
| Cond. No. | 1.32 |
The linear regression analysis between EQIX and SPY reveals a number of statistics about their relationship. The alpha value in the regression is a measure of how much return can be expected from EQIX independently of the markets performance, which SPY represents. A positive alpha of 0.0303 indicates that EQIX has a slight return over the market average that cannot be attributed to the markets movements alone. However, since the standard error of the constant is 0.043 and the confidence interval includes zero (from -0.054 to 0.114), the alpha is not statistically significant, implying that EQIX's performance is not robustly different from the market after accounting for general market movements.
The beta of 0.8801 reflects the tendency of EQIX to move with the market; if SPY moves by 1%, EQIX is expected to move by 0.8801% in the same direction. This indicates that EQIX's price changes have a strong correlation to market changes but are slightly less volatile than the overall market. The R-squared value of 0.370 suggests that approximately 37% of the variation in EQIX can be attributed to SPY, leaving the remaining variance due to other factors or idiosyncratic risk. Considering the probable F-statistic and the low P-value, the relationship between the two entities is considered statistically significant, justifying the predictive power of the model.
Summary of Equinix, Inc. (EQIX) Earnings Call:
Introduction: Equinix hosted its third quarter earnings conference call, emphasizing caution in light of a complex macro environment while also noting strong performance and value creation. Chip Newcom, Senior Director of Investor Relations, started the call with the usual caveats about forward-looking statements and non-GAAP measures, and mentioned the availability of supplemental materials on the Equinix Investor Relations website. Charles Meyers, CEO and President, and Keith Taylor, Chief Financial Officer, then provided their remarks before proceeding to a question-and-answer session with sell-side analysts.
CEO Commentary: Despite macroeconomic headwinds, Equinix reported robust results, with an increase in both dividend and Adjusted Funds From Operations (AFFO) per share forecasts for the year. Customer caution was balanced against continued commitment to digital transformation, driving demand for Equinix's services. The company saw accelerated new logo growth and a favorable pricing environment, leading to higher Monthly Recurring Revenue (MRR) per cabinet yields. Record new customer wins spanned across various segments, underscoring the strength of Equinix's go-to-market strategy, data center services, digital services, and xScale initiatives. AI opportunities were a focus, with Equinix seeing similar patterns in AI demand to the earlier cloud build-out and targeting AI service provider deployments, xScale portfolio expansion, and aiming to position itself for high-value opportunities across the AI value chain.
Financial Performance: The Q3 revenues reached $2.06 billion, with adjusted EBITDA up 9% and AFFO per share exceeding expectations. Strong interconnection growth continued, with significant momentum in the Equinix Fabric product. Investment is ongoing across the global footprint, with 56 major projects underway to meet strong demand for digital infrastructure. Interconnection revenue growth and ecosystem developments were highlighted, including key partnerships and customer engagements.
CFO Commentary: Keith Taylor elaborated on the company's bullish stance on the business and opportunities ahead, citing a strategy aimed at long-term shareholder value creation. Equinix's capital structure and balance sheet offered flexibility, allowing the company to access capital markets favorably. The company also remained focused on operational goals surrounding supply chain management and sustainability initiatives. The third quarter showed solid bookings and positive pricing dynamics, reflected in MRR per cabinet increase and stable net cabinet billing. Revenue and adjusted EBITDA growth figures were presented, with strategic emphasis on market positioning and continued investment in capacity expansion.
Discussion and Q&A Highlights:
The call moved to questions covering topics such as cabinet growth, AI strategies, customer interactions, and vertical market performance. Equinix addressed concerns about the flat cabinet growth metric, attributing it to higher power density in newly acquired cabinets compared to churned ones, and not a lack of demand. The CEO explained the increase in power density and its implications for business dynamics, while also detailing engagement with enterprise customers, who exhibit a cautious but digital-focused approach to IT spending. Analysts also inquired about Equinix's xScale strategy in the U.S., where development opportunities are being sought, potentially supplemented by M&A activities if favorable terms can be found. The call ended with confirmation of continued strong demand and an enthusiastic roadmap for the future.
Equinix, Inc.'s (EQIX) SEC 10-Q filing for the period ended September 30, 2023, covers its financial and operational data reflecting the company's performance, assets, liabilities, equity, capital expenditure, and various commitments. The document signifies EQIX's consistent approach towards expanding its IBX data centers amid a complex macroeconomic environment. Despite facing global economic challenges such as inflation, interest rate hikes, political unrest, and particularly the military conflict between Russia and Ukraine affecting the global market, EQIX managed to execute its strategic expansions and operational commitments successfully.
From a financial standpoint, EQIX reports a net income attributable to its stockholders of approximately $275.8 million for the quarter ended September 30, 2023, an increase from the net income of $211.8 million in the same period of 2022. The company's revenue also saw an uptick from approximately $1.84 billion to $2.06 billion year-over-year for the same quarters. The effective tax rates also witnessed a moderate increase, primarily attributed to the reversal of certain uncertain tax positions.
The report further outlines Equinix's various acquisitions, including the completion of acquiring four data centers and additional assets in West Africa from MainOne and completing the acquisition of data centers in Chile and Peru from Empresa Nacional De Telecomunicaciones S.A. (Entel). The acquisition from Entel is a strategic move that enhances EQIXs presence and customer demand in the Latin American market. The allocations for goodwill and intangible assets from these acquisitions have been adjusted, contributing to a wider operational footprint and reflecting expectations for revenue growth.
EQIX also continues its development of xScale data centers through various joint ventures, including with GIC and PGIM Real Estate. These investments are made to meet the requirements of hyperscale operators, facilitating future growth in the European and Asia-Pacific markets featured within the report.
From a fiscal perspective, Equinix has significant lease obligations, having incurred considerable expenses related to finance and operating lease costs totaling approximately $149.9 million for the quarter. These leases pertain to the companys data center spaces and ground leases with varying terms and commitments. Such financial obligations indicate EQIX's approach towards long-term investments in physical infrastructure critical for its operations.
On the debt front, EQIX's 10-Q filing shows a complex structure of mortgage and loan liabilities, alongside a series of senior notes with varying interest rates and maturities spread across different years, ranging from 2023 to 2052. The filing specifically reports on significant transactions, including a new senior unsecured credit facility and the issuance of senior notes in various currencies. These debt instruments demonstrate Equinix's active capital management and its intent to align its capital structure strategically with its growth orientation.
Lastly, in terms of commitments, EQIX reported capex commitments of approximately $2.1 billion related to the expansion of IBX data centers and additional commitments of $1.8 billion for the procurement of various goods and services. These commitments detail Equinix's proactive capital deployment to ensure the availability of state-of-the-art facilities for its customers globally.
Overall, Equinix's SEC 10-Q filing sheds light on the company's sustained growth trajectory, its financial stability, and continued investment in infrastructure despite the headwinds faced by the global economy. The filing also commits to transparency and regulatory adherence by providing detailed financial disclosures and insights into Equinix's strategic initiatives and future direction.
Equinix, Inc. (NASDAQ:EQIX) continues to establish itself as an integral component of the global digital landscape. Renowned for its expansive network of data centers and its forward-thinking approach to the digital economy, Equinix's ability to enable rapid interconnection stands out in a world increasingly driven by cloud computing, big data, and AI technologies. Management's strategic decisions have maximized the company's geographical reach and the flexibility of its multicloud networking portfolio, distinguishing Equinix in the data center arena.
The company operates over 250 data centers in more than 32 countries, each designed to support burgeoning digital transformations across diverse industries. Equinix has earned a reputation for stability and reliability through its deployment of operational funds (FFO) and robust year-on-year revenue increases, frequently exceeding market expectations. In Q3 2023, Equinix exceeded estimates with an FFO of $5.97, inspiring confidence among investors.
Contributing to its financial resiliency is its high recurrence revenue model, with recurring revenues occupying approximately 90% of the total. Notably, the top ten customers account for just 18% of revenue, reflecting the breadth of Equinix's customer base. Furthermore, recent partnerships, such as those with Harrison.ai and Lambda, are poised to solidify Equinixs standing in technology and AI, which is critical as enterprises increasingly deploy AI in their operations.
Equinix's global footprint facilitates cross-continent infrastructure deployment for 77% of its clients, supporting the prevalent enterprise migration to multiple public clouds. This broadened presence has implications for revenue distribution, with 44% of revenues stemming from the Americas, holding a key position in Equinix's financial structure. In terms of growth, Equinix acknowledges that the United States, representing 40% of their business, is set to see the most substantial growth in data center demand, mirroring trends of rapid technology adoption.
Initiatives like the launch of the Equinix Fabric Cloud Router demonstrate the company's commitment to innovation; this new service simplifies multicloud networking and scales performance across public clouds and on-premises environments. With availability in 58 markets globally and the potential for up to 75% cost reductions on cloud egress, Equinix strategically positions itself as a leading enabler of multicloud strategies.
Equinix's strategic financial health is further reinforced by its balance sheet, showcasing liquidity excess of $6.7 billion. This strong fiscal positioning is complemented by a consistent track record of dividend payouts, which have been a notable aspect of the company's strategy to enhance shareholder value. Dividends have seen a compound annual growth rate of over 12% since Equinix transitioned into a REIT, with two dividend increments in 2023 alone.
Even amid challenging economic cycles, Equinix has persevered in its growth. The firm is projected to continue this trajectory, targeting an 8-12% annual revenue increase through 2027, along with a 7-10% increase in adjusted FFO per share.
Despite its premium valuation, trading at 25 times the FFO, and a yield at purchase of roughly 2.09%, Equinix is highlighted among the top 10 dividend-growth REITs due to its potential for significant capital appreciation and reliable long-term returns. The company proudly stands as part of select REITs expected to deliver superior share price performance alongside steady dividend growth.
As Equinix gears up for its upcoming investor conference call on February 14, 2024, participants await an update on the company's fiscal standing and vision moving forward. Equinix's capability to empower its clientele to scale with agility, streamline digital service launches, and reinforce value through strategic interconnections is a testament to its irrefutable role in the digital economy.
In sum, Equinix presents a growth narrative that hinges on its global presence, financial resilience, and innovative advances in the burgeoning digital sector. The company's extensive reach, robust multicloud networking services, AI partnerships, and commitment to shareholder returns combine to render Equinix a compelling entity within the REIT space. As such, Equinix occupies an enviable position as it enters 2024, ready to capitalize on the dynamic and increasing demands of an interconnected digital ecosystem.
Over a five-year period from January 22, 2019, to January 19, 2024, the volatility analysis of Equinix, Inc. (EQIX) stock returns, using the ARCH model, indicates no consistent pattern or trend that could explain the price movements (evidenced by an R-squared value of 0.000). The model suggests that the volatility of EQIX stock is persistent, with a relatively high impact from recent volatility shocks (indicated by an alpha[1] value of 0.2654). Furthermore, the base level of volatility, not caused by past shocks, is somewhat significant (with an omega value of 2.6284), indicating that Equinix, Inc. has an inherent degree of unpredictability in its stock price movements.
Here's the HTML table presenting the summarized statistics of the ARCH model:
| Statistic Name | Statistic Value |
|---|---|
| Mean Model | Zero Mean |
| R-squared | 0.000 |
| Log-Likelihood | -2534.08 |
| AIC | 5072.15 |
| BIC | 5082.43 |
| No. Observations | 1,257 |
| omega | 2.6284 |
| alpha[1] | 0.2654 |
The financial risk of investing $10,000 in Equinix, Inc. (EQIX) can be scrutinized through a blend of volatility modeling and machine learning predictions. This dual approach enables a multifaceted understanding of potential risks, delving deeper than traditional single-method analyses.
Volatility modeling is applied to EQIXs historical stock prices to gauge the fluctuations in stock returns over time. By fitting the past price data into this statistical model, we can extrapolate the level of variability in the stock's returns, encapsulating the frequency and magnitude of price movements. This model, particularly adept at capturing the clustering effectlarge changes tend to be followed by large changes (of either sign), while small changes tend to be followed by small changesprovides a foundation for estimating future risk levels.
The secondary method employed is a machine learning predictions algorithm, which learns from the intricacies within the historical data to make informed predictions about future returns. By examining numerous variables that influence stock prices and establishing complex relationships within the data, this prediction model generates return forecasts based on learned patterns.
Combining volatility modeling with predictive analytics from machine learning, we can derive a more nuanced risk assessment. The utilization of machine learning predictions aids in refining the projections for future returns made by the volatility model, allowing for a better informed risk measure.
The risk of the EQIX investment is quantified through the Value at Risk metric. The calculated annual VaR at a 95% confidence interval for a $10,000 investment stands at $241.65. This suggests that the investor can be 95% confident that they will not lose more than $241.65 on their investment over the one-year period, under normal market conditions.
This figure reflects the potential investment risk, leveraging the strengths of both volatility modeling and machine learning predictions. The volatility model, by capturing the stock's inherent volatility, alongside the predictive model's return forecasts, facilitates a robust gauge of the potential downside, bolstering risk management capabilities for investors in EQIX.
Similar Companies in REITSpecialty:
Report: Crown Castle Inc. (CCI), Crown Castle Inc. (CCI), Report: American Tower Corporation (AMT), American Tower Corporation (AMT), Report: Iron Mountain Incorporated (IRM), Iron Mountain Incorporated (IRM), Report: Hannon Armstrong Sustainable Infrastructure Capital, Inc. (HASI), Hannon Armstrong Sustainable Infrastructure Capital, Inc. (HASI), Report: Digital Realty Trust, Inc. (DLR), Digital Realty Trust, Inc. (DLR), Report: SBA Communications Corporation (SBAC), SBA Communications Corporation (SBAC), Report: EPR Properties (EPR), EPR Properties (EPR), Gaming and Leisure Properties, Inc. (GLPI), CyrusOne Inc. (CONE), CoreSite Realty Corporation (COR), QTS Realty Trust, Inc. (QTS)
https://www.youtube.com/watch?v=JXZU8dtcgxQ
https://seekingalpha.com/article/4659259-equinix-building-the-future-one-data-center-at-a-time
https://seekingalpha.com/article/4659579-world-beaters-10-double-digit-dividend-growth-reits
https://www.zacks.com/stock/news/2203548/4-reit-stocks-set-to-continue-their-winning-streaks-in-2024
https://seekingalpha.com/article/4660450-top-12-reits-for-next-12-months
https://www.fool.com/investing/2024/01/06/2-hot-stocks-to-buy-and-hold-until-you-retire/
https://www.fool.com/investing/2024/01/09/these-dividend-growth-juggernauts-gave-their-inves/
https://seekingalpha.com/article/4662031-equinix-is-expensive-but-worth-it
https://finance.yahoo.com/m/f2e2bef5-8e13-317f-92e2-7d9d322269a4/equinix-raises-debt-abroad-to.html
https://finance.yahoo.com/news/equinix-announces-tax-treatment-2023-125000587.html
https://finance.yahoo.com/news/media-alert-equinix-sets-conference-130100077.html
https://finance.yahoo.com/news/equinix-enhances-multicloud-networking-portfolio-130000960.html
https://www.sec.gov/Archives/edgar/data/1101239/000162828023035406/eqix-20230930.htm
Copyright © 2024 Tiny Computers (email@tinycomputers.io)
Report ID: R9evNN
Cost: $1.06515
https://reports.tinycomputers.io/EQIX/EQIX-2024-01-21.html Home