Hawaiian Electric Industries, Inc. (ticker: HE)
2024-01-13
 Hawaiian Electric Industries, Inc. (ticker: HE) is a holding company with a diverse portfolio of businesses primarily focused on electric utilities and banking. Based in Honolulu, Hawaii, it operates through its subsidiaries, Hawaiian Electric Company, Inc., and its regional subsidiaries, which provide electric service to approximately 95% of Hawaii's population. These subsidiaries include Hawaii Electric Light Company, Inc., Maui Electric Company, Limited, and Hawaii Electric Company, among others. The company's utilities segment is dedicated to generating, purchasing, transmitting, distributing, and selling electric energy. In addition to its utilities pursuits, Hawaiian Electric Industries owns American Savings Bank, one of the largest financial institutions in Hawaii, which offers a broad spectrum of banking services to individual and business customers. Traditionally, the company's performance reflects the unique economic and environmental landscape of Hawaii, including heavy reliance on imported oil for energy generation and a significant investment in transitioning to renewable energy sources. As of the knowledge cutoff in early 2023, Hawaiian Electric Industries continues to navigate the challenges and opportunities of Hawaii's evolving energy and financial sectors, championing sustainability initiatives and adapting to changing market conditions.
| Address | 1001 Bishop Street Suite 2900 | City | Honolulu | State | HI |
| Zip Code | 96813 | Country | United States | Phone | 808 543 5662 |
| Website | https://www.hei.com | Industry | Utilities - Regulated Electric | Sector | Utilities |
| Full Time Employees | 3,640 | Previous Close | 13.81 | Open | 14.06 |
| Day Low | 13.21 | Day High | 14.11 | Dividend Rate | 1.44 |
| Dividend Yield | 0.1491 | Payout Ratio | 75.66% | 5 Year Avg Dividend Yield | 3.97 |
| Beta | 0.565 | Trailing PE | 7.13 | Forward PE | 6.41 |
| Volume | 2,793,441 | Average Volume 10 Days | 2,698,000 | Market Cap | 1,520,816,896 |
| 52 Week Low | 9.06 | 52 Week High | 43.71 | Price to Sales Trailing 12 Months | 0.4061 |
| Enterprise Value | 4,776,071,680 | Profit Margins | 5.549% | Shares Outstanding | 110,124,000 |
| Shares Short | 14,575,893 | Short Ratio | 5.51 | Book Value | 20.206 |
| Price to Book | 0.6666 | Net Income to Common | 207,796,992 | Trailing EPS | 1.89 |
| Forward EPS | 2.10 | Total Cash | 667,182,976 | Total Debt | 3,925,590,016 |
| Quick Ratio | 6.88 | Current Ratio | 6.951 | Total Revenue | 3,744,908,032 |
| Debt to Equity | 173.803 | Revenue per Share | 34.177 | Return on Assets | 1.35% |
| Return on Equity | 9.327% | Gross Profits | 754,238,000 | Free Cash Flow | -446,141,632 |
| Operating Cash Flow | 716,627,008 | Earnings Growth | -34.8% | Revenue Growth | -13.5% |
| Gross Margins | 19.663% | EBITDA Margins | 17.848% | Operating Margins | 8.468% |
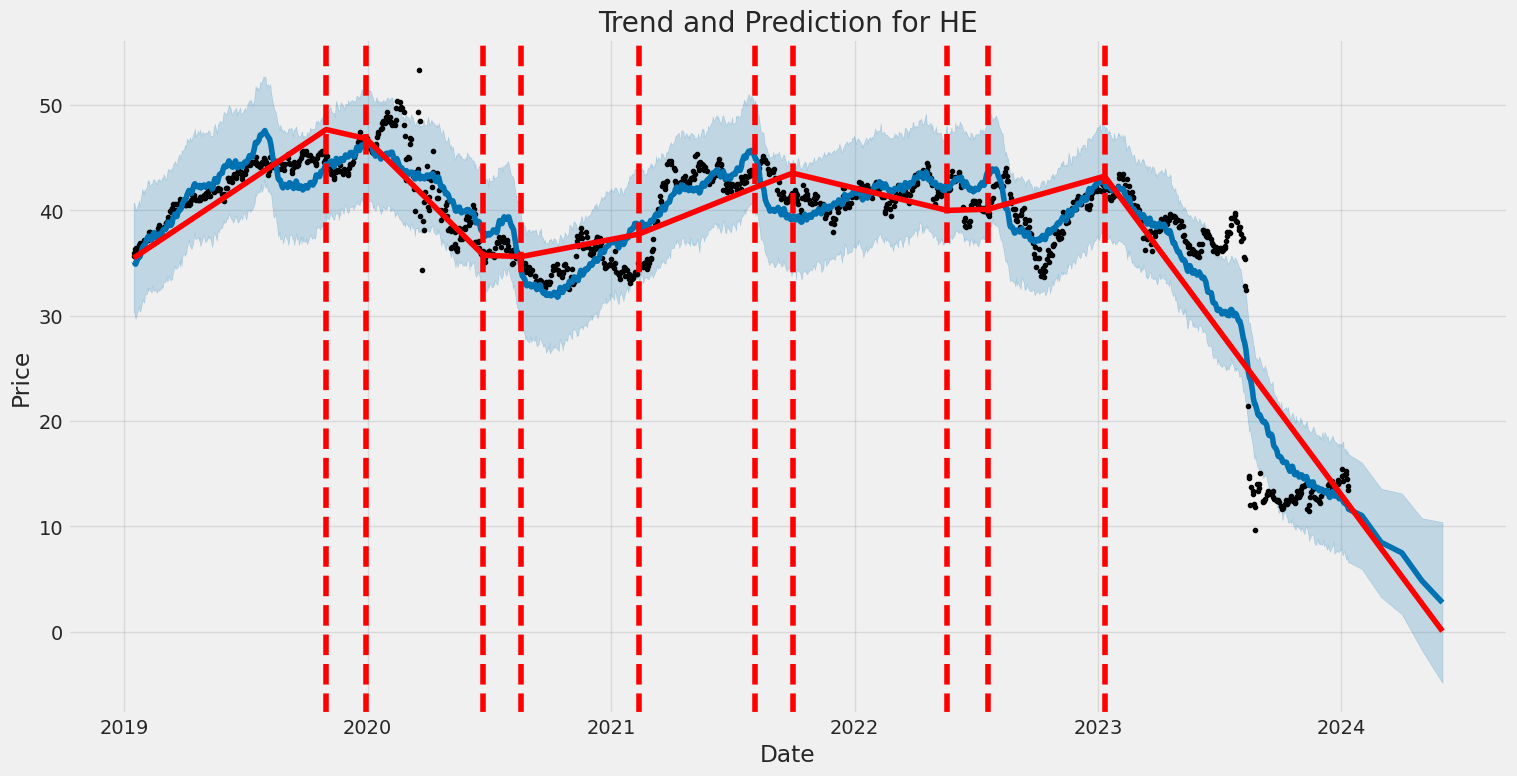 Upon scrutiny of the provided technical indicators, fundamentals, balance sheets, cash flows, and analyst expectations, a holistic view of the stock price movement for HE over the upcoming months can be formulated.
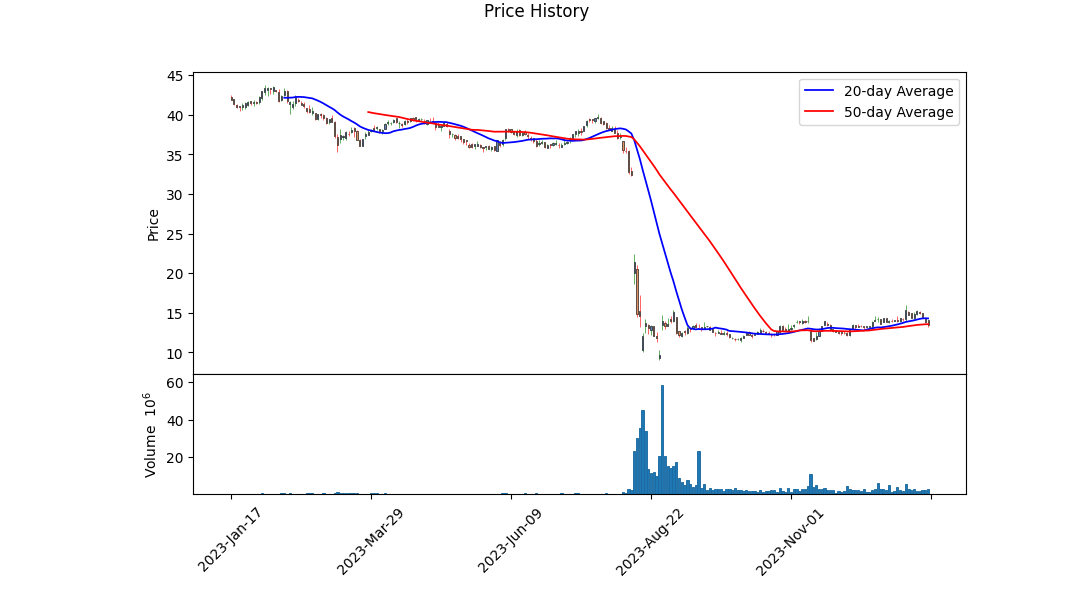
Technical Analysis: - The Parabolic SAR (PSAR) initially indicated a bullish trend with the dots below the price but then switched to bearish with the dots flipping to above the price as of the latest date. This may suggest a potential trend reversal. - The On-Balance Volume (OBV) has shown some decrease on the last day, indicative of potential selling pressure. - The Moving Average Convergence Divergence (MACD) histogram values have turned negative recently, suggesting that the momentum could be shifting towards the downside.
Fundamental Analysis: - HE showcases a moderate gross margin and EBITDA margin, implying stable operational efficiency. - The increase in Net Debt over the last three years may be a point of concern, indicating that the company is becoming more leveraged. - The consistent net income over the past three-year timeline and the fairly stable operating income suggest a solid track record of profitability.
Balance Sheet: - The company's tangible book value has slightly decreased from 2021 to 2022, which could reflect asset depreciation or capital outflows. - Cash and short-term investments demonstrate a reduced liquidity position from 2020 to 2022. - Net debt increase is substantial, which could be a sign of aggressive financing to fuel growth or cover operational costs.
Cash Flows: - Free cash flow has increased over the years, signaling the company's ability to generate cash after accounting for capital expenditures. - Repayment of debt has been active, illustrating an attempt to manage liabilities.
Analyst Expectations: - Estimates for the current and next quarter's earnings suggest a decrease compared to the previous year's EPS, indicating expectations of lower profitability in the short term. - Revenue estimates for the next year show minimal growth, which, while positive, do not suggest any significant expansion in the business's top line. - Growth estimates for the next year and the next five years are modest, hinting at steady but slow growth prospects.
Considering the technical indicators alongside the fundamental analysis, it's probable that the stock price could face some short-term headwinds. The bearish flip in the PSAR recently combined with the negative MACD histogram and a downturn in the OBV could lead to a dip in the stock price or a period of consolidation.
On the foundation of solid margins and profitability, even in the face of increased leverage and interest expenses, there is an anchor in the company's fundamentals that may support the stock's value over the longer term.
However, the near-term outlook presents challenges that could pressure the stock. The decrease in tangible book value, the buildup of net debt, and the anticipated earnings decrease for the current and next quarters as noted by analysts could weigh on investor sentiment.
In conclusion, the immediate trajectory for HE's stock price appears to have a bearish tilt given the moving technical indicators and analyst expectations. It would be prudent for investors to brace for potential volatility or softness in the share price in the near term. Yet, the underlying stability in the company's fundamentals provides a counterbalance and may offer support, setting the stage for a more favorable outlook in the medium to long term. Investors should keep a close watch on both technical signals and fundamental shifts that might indicate a change in this outlook.
| Statistic Name | Statistic Value |
| Alpha (const) | -0.0657 |
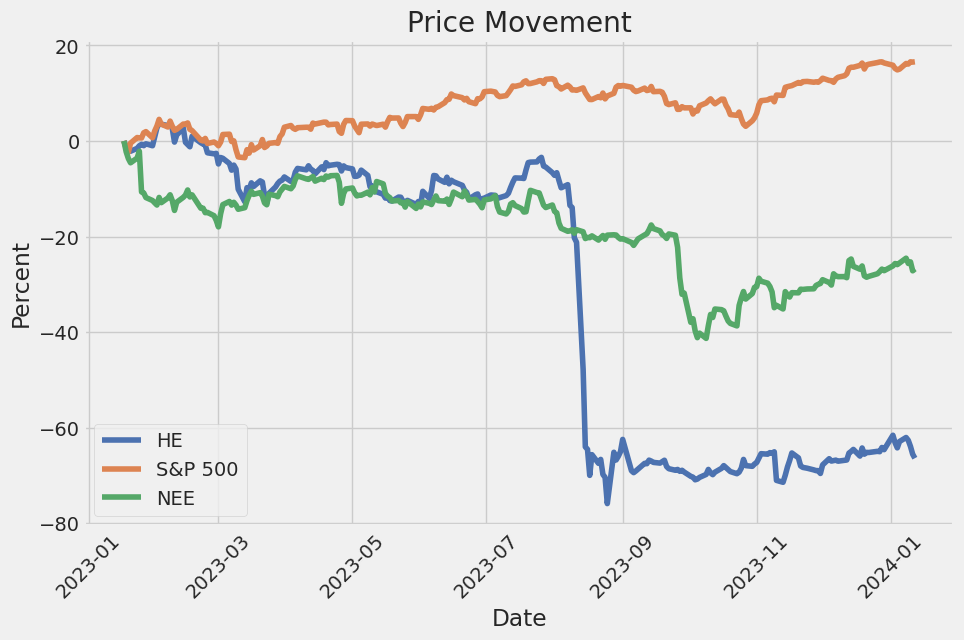
| Beta (coef of SPY) | 0.6662 |
| R-squared | 0.097 |
| Adjusted R-squared | 0.096 |
| F-statistic | 134.4 |
| Prob (F-statistic) | 1.38e-29 |
| No. Observations | 1,257 |
| AIC | 6,051 |
| BIC | 6,062 |
For the time period ending today, the linear regression model analyzing the relationship between HE (unknown variable) and SPY (a proxy for the market index S&P 500) shows that HE has a small negative alpha of approximately -0.0657. Alpha represents the intercept of the regression line and in the context of this model, indicates that HE underperforms the benchmark SPY marginally when the market return is zero. The negative alpha suggests that HE's average return is slightly less than what could be expected based on the market's performance alone. However, given the alpha's P-value is 0.386, which is much higher than the conventional significance level of 0.05, the alpha is not statistically significant implying that the intercept could be due to random chance.
The beta coefficient of HE relative to SPY is approximated at 0.6662, indicating that for every 1% change in SPY, HE is expected to move by approximately 0.6662% in the same direction. The R-squared value for the model is 0.097, which implies that only about 9.7% of HE's variability is explained by the movements in SPY, pointing toward a relatively weak linear relationship between HE and the market. Such a low R-squared suggests that other factors outside of the market performance may play a significant role in determining the movements in HE's value. Additionally, the model's F-statistic indicates that the overall model is statistically significant.
Summary of Hawaiian Electric Industries Third Quarter 2023 Earnings Call
Introduction
Hawaiian Electric Industries (HEI) conducted their third-quarter 2023 earnings call, led by Scott Seu (President and CEO), Scott Deghetto (Executive Vice President, CFO, and Treasurer), Shelee Kimura (Hawaiian Electric President and CEO), and Ann Teranishi (American Savings Bank President and CEO). Mateo Garcia, Director of Investor Relations, highlighted the availability of the earnings release and presentation on the website, noting that forward-looking statements discussed are subject to factors that could cause results to differ materially from expectations, and referenced the use of non-GAAP financial measures.
Corporate Response to Maui Wildfires
The call began with a diversion from typical earnings discussions, focusing on the August wildfires' impact on Maui and Hawaii. Scott Seu explained the significance of the tragedy, mentioning ongoing recovery and rebuilding efforts, and the new multi-phase initiative led by Governor Josh Green. The initiative includes financial support for victims, future extreme weather protection, and regulatory changes to protect from climate risks. Hawaiian Electric's contribution to wildfire recovery, not funded by customers but insurance, was a key point, emphasizing the company's commitment to community and financial prudence, including suspending the quarterly cash dividend to sustain their operations and support.
Financial Highlights
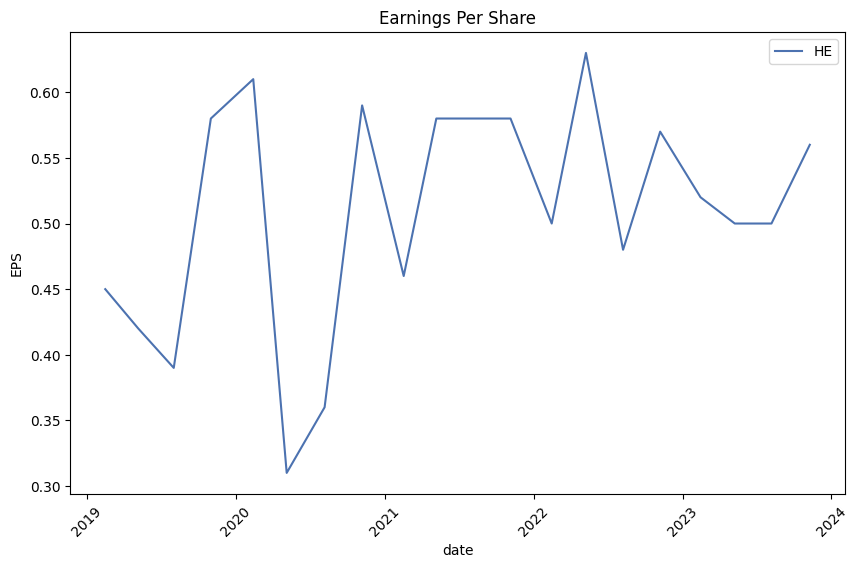
Scott Deghetto reviewed the quarter financials, with EPS at $0.37 net of wildfire-related costs, and a core EPS of $0.56 excluding these costs. Despite equipment damage and loss of an ASB branch, business fundamentals remained solid. The utility's recovery required deferral treatment of windstorm and wildfire expenses, for which a stipulated settlement was requested. Plans for updating capital expenditures focusing on extreme weather risks were in progress. Pending litigation concerning the fires was addressed, with Hawaiian Electric named in 64 lawsuits and HEI in 65, and the first trial scheduled for October 2024.
Detail on Utilities Recovery and Response Efforts
Shelee Kimura provided detailed information on the recovery and response efforts of Hawaiian Electric. She highlighted their unwavering dedication post-wildfire, with over 400 employees working on the ground. Restoration of power to customers is nearly complete, and discussions with authorities about Lahaina and broader Maui's energy needs are ongoing. She emphasized increasing the utility's grid resilience and adapting their wildfire safety strategy in alignment with Department of Energy funding and PUC approval.
Q&A Highlights
In the Q&A session, there were queries on the company's approach to capital spending and maintenance levels, given the circumstances. Executive responses clarified that annual maintenance spend typically centers around $300 million, and future wildfire-related investments would pivot to emphasize prioritization and acceleration without disclosing specific figures. Questions on potential asset sales were dismissed as speculative, and inquiries about liquidity and state support received information on existing cash runway and continued discussions with the state. Questions concerning specifics of lawsuits did not yield financial details, and further information was deferred regarding insurance coverage post-settlement contributions and wildfire report timelines.
Closing Remarks
In conclusion, Seu reiterated HEI's focus on financial health and service continuity amidst challenges faced by the community. The utility remains committed to improving collective strength and resilience while the bank provides stable and secure services. The organization appreciates the communitys trust and patience and emphasizes ongoing efforts to serve Hawaii effectively.
The financial performance of companies like Hawaiian Electric Industries, Inc. (HEI) plays a crucial role in shaping investor portfolios, especially during earnings season. As companies release their earnings reports, investors closely monitor not just revenues and profits, but also any signs of potential earnings surprises which could influence stock prices.
A useful tool for investors seeking to anticipate such surprises is the Zacks Earnings ESP (Expected Surprise Prediction) model. This tool compares the Most Accurate Estimate, which reflects recent analyst revisions, against the Zacks Consensus Estimate to calculate an Expected Surprise Prediction. This comparison can give an indication of how the forthcoming earnings report might deviate from market expectations.
Illustrating this concept is CVS Health (CVS) with an Earnings ESP figure of 1.4% indicating a possible earnings beat, and Stitch Fix (SFIX) which displayed a positive Earnings ESP of 5.76%, hinting at similar prospects. A positive Earnings ESP often suggests a stock is set to surpass market expectations, potentially leading to a rise in its value - beneficial to investors.
These analytical tools exemplify how informed decision-making can be bolstered by a proactive awareness of earnings reports. However, such metrics should be analyzed with an understanding of sector-specific factors. For instance, Hawaiian Electric Industries may face different challenges being a part of the energy sector, including unique demand dynamics, regulatory considerations, and significant capital expenditures - factors that don't typically apply to the retail-wholesale sector.
Despite a stable presence in Hawaii, HEI faced a demanding situation in earlier 2023 due to potential liabilities from a major fire. This event not only brought intense scrutiny but also shook the company's financial policies, specifically impacting its dividend payments. While some financial quote services tantalizingly presented a 14% dividend yield, the reality changed drastically when HEI filed with the SEC indicating the suspension of its dividends as of around August 21, to preserve cash amidst anticipated financial obligations resulting from the fire's aftermath.
This divergence in published yield data serves as a compelling reminder for investors to stay current with official company filings for the most accurate information. Interestingly enough, HEI did not accompany the SEC filing with a press release, which might have contributed to a knowledge gap among shareholders relying on less formal data sources. The immediate market reaction typically includes a drop in share price as the anticipated future income stream gets reconsidered and the stock gets repriced accordingly.
For HEI, the forecasted yield turned essentially to zero, casting a spotlight on the paramountcy of investor due diligence. Before regaining status as a reliable income stock, the company would need to navigate a series of challenges, including legal proceedings and strategic financial restructuring.
The company's financial report for the third quarter 2023 paints a picture of a company grappling with both stability and change. HEI's EPS matched the Zacks Consensus Estimate but indicated a marginal year-over-year decrease, underscoring a slight erosion in profitability. The quarter's sharp revenue decline further illustrates the fiscal hurdle the company faces.
Meanwhile, the utility sector itself saw mixed performances, with NextEra Energy exceeding expectations and others like DTE Energy and PG&E Corporation reporting lower than anticipated earnings. These comparisons provide investors with a broader view of the sector's health and HEI's standing within it.
HEI experienced a dramatic week in August 2023, with its stock price spiking 44% following clarification provided by the company in response to lawsuits concerning the Maui wildfires. While initial share prices tumbled, Hawaiian Electric Industries' subsequent defensive remarks painted a different narrative that countered prior allegations, leading to recovering investor confidence.
Elsewhere in the energy sector, positive economic reports around inflation encouraged a rally for companies such as Hawaii Electric, indicating that utilities, especially those in the renewable energy market, might benefit from a more favorable financing environment should interest rates stabilize or decline. Such prospects are particularly significant for HEI as it contends with financial constraints stemming from legal conflicts and disaster-related liabilities.
From a value investment perspective, Hawaiian Electric Industries outshines Exelon Corporation when compared on several financial metrics. With a lower P/E ratio, a more favorable PEG ratio, and a P/B ratio that implies potential undervaluation, HEI emerges as an attractive option for value investors, emphasized by its favorable Zacks Rank and Value grade.
While some companies like Infosys and eBay made corporate decisions that improved their market perception, HEI's failure to file its quarterly report on time due to an unforeseen payment contributed to a decline in stock value. The company's 13.5% decrease in revenue and issues surrounding the Maui wildfires magnified investor concerns, despite beating EPS estimates.
In the broader spectrum of corporate developments, CVS Health's approach to discussing financial results could provide insights that might be transferable across industries, including HEI's utility service sector. Though operating within different markets, the strategic communications adopted by companies like CVS Health represent a universal need for transparency and proactive engagement with stakeholders.
Finally, the press digest highlighting a myriad of sector developments from defense to environmental policy serves as a reminder of the complex tapestry of factors that can influence corporate strategy and market movements. Such events, along with Hawaiian Electric Industries' own narrative, underscore the vast interconnectivity of corporate America and the nuanced implications of economic, legal, and environmental factors playing out concurrently on the financial landscape.
Hawaiian Electric Industries, Inc. (HE) experienced a level of volatility in its asset returns from January 15, 2019, to January 12, 2024, as indicated by the ARCH model. The volatility coefficient (omega) is significant, suggesting that past variance influences future volatility, while the alpha coefficient indicates the effect of past shocks on future volatility is at the boundary of being statistically significant. These results imply that while changes in the asset returns are influenced by previous fluctuations, the exact impact of past unpredictability on future volatility remains uncertain.
| Statistic Name | Statistic Value |
|---|---|
| Mean Model | Zero Mean |
| Log-Likelihood | -2739.50 |
| AIC | 5482.99 |
| BIC | 5493.26 |
| Number of Observations | 1,257 |
| omega | 2.7990 |
| alpha[1] | 1.0000 |
To evaluate the financial risk associated with a $10,000 investment in Hawaiian Electric Industries, Inc. (HE) over a 30-day period, a combination of volatility modeling and machine learning predictions is employed. The process starts with understanding the stock's historical price fluctuations to anticipate future volatility.
Volatility modeling is an essential statistical tool in the risk management and financial analysis framework. It is used to quantify the degree of variation in a stock's trading price over time, measured by the standard deviation of returns. These models decompose the volatility into predictable components and random error terms, helping investors gain insights into the level of risk associated with the stock. For Hawaiian Electric Industries, the volatility model would analyze the time series of past daily returns to forecast potential future swings in the stock price.
More specifically, volatility modeling captures the 'clustering' effect often observed in financial time series, where high-volatility events tend to follow high-volatility events, and low-volatility events tend to follow low-volatility. Leveraging this type of modelling facilitates an informed prediction of the scale of price movements, enabling a dynamic approach to forecasting risk that is sensitive to market conditions.
On the other hand, machine learning predictions involve the use of algorithms to analyze data and make predictions about future returns. In this case, a machine learning model such as a decision tree-based regression algorithm is trained on historical stock market data. By gleaning patterns from the data, the algorithm can forecast future stock returns. It considers a multitude of variables, possibly including past prices, volume, company fundamentals, and macroeconomic indicators, to output a predictive series of stock returns.
Combining both approaches deepens the understanding of the stock's risk profile. Where volatility modeling takes into account the inherent randomness and volatility clustering in the stock price time series, machine learning predictions can add layers by incorporating a broader array of factors that could influence the stock's future performance.
Now, turning to the measure of Value at Risk (VaR), which provides a quantitative way to assess the level of financial risk over a specific time period. VaR is a statistical technique used to measure and quantify the level of financial risk within a firm, portfolio, or position over a specific time frame. This risk measure tells us that, given normal market conditions, there is a 95% confidence that Hawaiian Electric Industries, Inc. will not lose more than $122.80 on any given day.
Importantly, this measure of risk is not without its limitations it assumes normal market conditions and ignores the possibility of extreme events. Despite such limitations, the calculated VaR offers a clear and concise expression of the investment's day-to-day risk.
Ultimately, when assessing the level of risk for a short-term investment in Hawaiian Electric Industries, Inc., the investor benefits from a robust analytical approach that combines volatility modeling's capacity to account for market uncertainties with machine learning predictions' ability to utilize historical data for future returns forecasting. This multi-faceted analysis, encapsulated in the calculated VaR measure, provides a thorough view of the possible risks when committing $10,000 to this equity investment over the specified period.
Similar Companies in Electric Utilities:
Report: NextEra Energy, Inc. (NEE), NextEra Energy, Inc. (NEE), Report: Duke Energy Corporation (DUK), Duke Energy Corporation (DUK), Report: Southern Company (SO), Southern Company (SO), Report: Dominion Energy, Inc. (D), Dominion Energy, Inc. (D), Exelon Corporation (EXC), Report: American Electric Power Company, Inc. (AEP), American Electric Power Company, Inc. (AEP), PG&E Corporation (PCG), Consolidated Edison, Inc. (ED), Public Service Enterprise Group Incorporated (PEG), Report: Edison International (EIX), Edison International (EIX), FirstEnergy Corp. (FE), Report: Xcel Energy Inc. (XEL), Xcel Energy Inc. (XEL)
https://www.fool.com/investing/2023/08/31/why-hawaiian-electric-stock-surged-this-week/
https://finance.yahoo.com/news/boost-portfolio-top-retail-wholesale-140006312.html
https://www.fool.com/investing/2023/11/14/why-nextera-energy-nextera-partners-hawaii-electri/
https://www.fool.com/investing/2023/11/03/dont-believe-ultra-high-dividend-yield-its-gone/
https://www.zacks.com/stock/news/2167369/he-vs-exc-which-stock-is-the-better-value-option
https://finance.yahoo.com/news/cvs-health-hold-fourth-quarter-140000469.html
https://www.fool.com/investing/2023/11/10/why-hawaiian-electric-industries-plunged-today/
https://finance.yahoo.com/news/company-news-jan-12-2024-115800162.html
https://finance.yahoo.com/news/press-digest-wall-street-journal-045114352.html
Copyright © 2024 Tiny Computers (email@tinycomputers.io)
Report ID: NazqXy