SPDR S&P Bank ETF (ticker: KBE)
2024-02-12
 The SPDR S&P Bank ETF (ticker: KBE) is an exchange-traded fund that seeks to provide investment results that, before fees and expenses, correspond generally to the total return performance of the S&P Banks Select Industry Index. This ETF offers investors exposure to the banking sector of the U.S. equity market, encompassing a diverse range of small, mid, and large-cap banking stocks. By investing in KBE, individuals can gain broad-based exposure to a critical segment of the financial industry, which can include regional banks, diversified banks, and thrifts. The ETF's holdings are designed to mirror the composition of the benchmark index, thus providing a representative snapshot of the U.S. banking sector's performance. Due to its focus on banks, the fund's performance is closely tied to interest rate changes, regulatory policies, and economic conditions that specifically impact the banking industry. For investors looking to diversify their portfolios with financial services exposure or to speculate on the banking sector's performance without investing in individual bank stocks, KBE offers a convenient and efficient solution.
| Previous Close | 43.15 | Open | 43.19 | Day Low | 42.76 |
| Day High | 43.77 | Trailing PE | 7.75 | Volume | 1,634,490 |
| Average Volume | 2,653,455 | Average Volume 10 Days | 2,687,180 | Bid | 43.51 |
| Ask | 44.00 | Bid Size | 1,000 | Ask Size | 1,000 |
| Yield | 2.85% | Total Assets | $2,002,412,160 | 52 Week Low | 30.85 |
| 52 Week High | 50.03 | Fifty Day Average | 44.67 | 200 Day Average | 39.14 |
| NAV Price | 43.69 | YTD Return | -5.02% | Beta 3 Year | 1.05 |
| Three Year Average Return | 0.13% | Five Year Average Return | 2.998% | Currency | USD |
| Sharpe Ratio | -0.2652952423946566 | Sortino Ratio | -4.211281164093696 |
| Treynor Ratio | -0.05315490086571175 | Calmar Ratio | -0.26295377497898587 |
Based on the provided technical analysis, fundamental analysis, and key financial ratios, a comprehensive examination of KBE's potential future stock price movements indicates both opportunities and concerns. Evaluating KBE within the broader market context and factoring in its performance metrics, fundamental strengths, and technical position offers a predictive view for the coming months.
Technical indicators suggest a nuanced narrative:
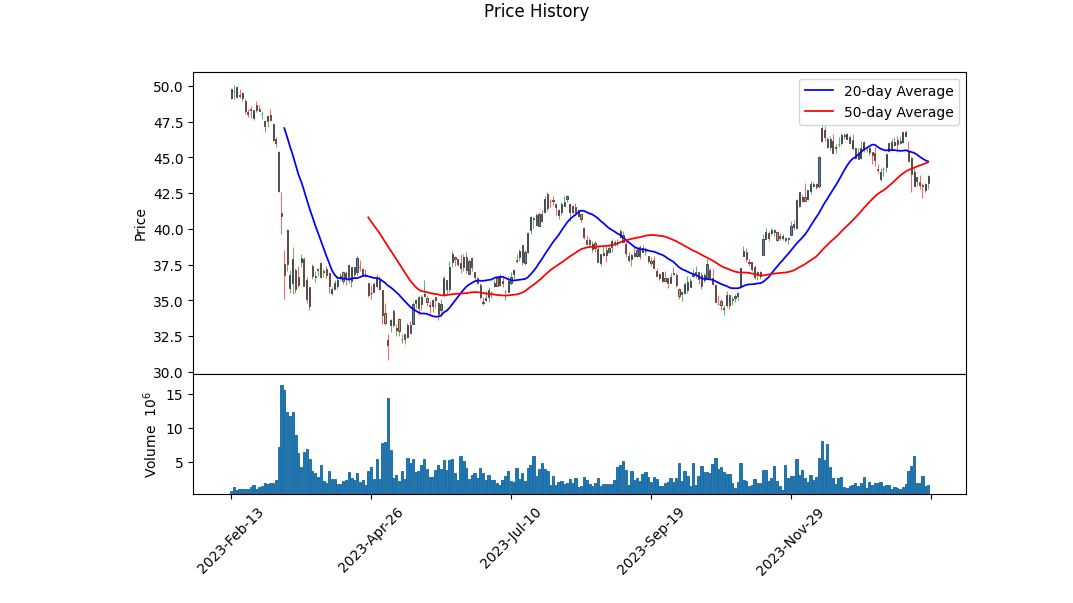
- The progression in the OBV line showcases a period of accumulation followed by a decline, pointing to varied investment flow. Initially, a positive momentum indicates growing investor confidence, which appears to dampen towards the more recent trading sessions.
- A decline in the MACD histogram values towards the end signals a slowing in bullish momentum, although the precise values leading up to the reports' timeframe show a consistent fluctuation, reinforcing the necessity for cautious optimism.
In analyzing market fundamentals and the ETF's specific characteristics, several key elements emerge:
- The trailing PE ratio is considerably low, signifying that KBE might be undervalued compared to its earnings generation capability. This, paired with its yield, offers an attractive proposition for value investors.
- The negative Sharpe, Sortino, Treynor, and Calmar ratios indicate that KBE's past year's performance, relative to risk, has been disappointing. These ratios highlight significant risk-adjusted returns, which could raise concerns for risk-averse investors.
- Daily total return and expense ratios detail efficiency and return metrics that help position KBE in a competitive landscape within the financial ETF sector. The year-to-date negative return, however, necessitates a prudent approach, keeping in view broader market uncertainties.
The technical and fundamental data converge on a prognosis that suggests potential volatility and cautious growth opportunities for KBE in the forthcoming months. Despite technical markers hinting at a deceleration in bullish sentiment, KBE's fundamental valuation metrics provide a basis for potential upside, particularly for investors keyed into long-term value. A discerning investor should heed the risk-adjusted performance metrics, acknowledging that while KBE exhibits certain strengths, its recent performance history carries implicit caution. Investment decisions, as suggested by the data, would benefit from a balanced consideration of growth potential against inherent market and ETF-specific risks.
Given the combination of technical pullbacks and fundamental strengths, a reasonable expectation would entail a period of consolidation followed by cautious upside movement, contingent upon broader market trends and sector-specific developments. Investors are advised to monitor subsequent technical indicators and fundamental updates closely, aligning investment strategies with risk tolerance and return expectations.
In our analysis of the SPDR S&P Bank ETF (KBE), it is important to note that we were unable to directly calculate the Return on Capital (ROC) and the Earnings Yield due to the nature of this financial instrument. As an ETF, KBE holds a diversified portfolio of bank stocks, making direct calculations of ROC and Earnings Yield for the ETF as a whole not applicable in the same way they are for individual companies. These metrics are typically calculated based on individual company financials - for ROC, reflecting the company's efficiency in generating profits from its capital, and for Earnings Yield, representing the profit earned per dollar invested. For KBE, assessments of its value and performance should instead consider aggregate metrics and analyses of its underlying holdings, such as the combined earnings yields of its constituent stocks and their overall market performance. This approach gives a more comprehensive view of the ETF's investment qualities compared to traditional single-company financial ratios.
| Statistic Name | Statistic Value |
| R-squared | 0.526 |
| Adj. R-squared | 0.526 |
| F-statistic | 1393 |
| Prob (F-statistic) | 1.14e-205 |
| Log-Likelihood | -2326.4 |
| AIC | 4657 |
| BIC | 4667 |
| Const | -0.0419 |
| Coef | 1.2341 |
| P>|t| | 0.000 |
| [0.025 | 1.169 |
| 0.975] | 1.299 |
| Omnibus | 178.241 |
| Prob(Omnibus) | 0.0 |
| Jarque-Bera (JB) | 1815.015 |
| Skew | 0.265 |
| Prob(JB) | 0.00 |
| Kurtosis | 8.865 |
| Cond. No. | 1.32 |
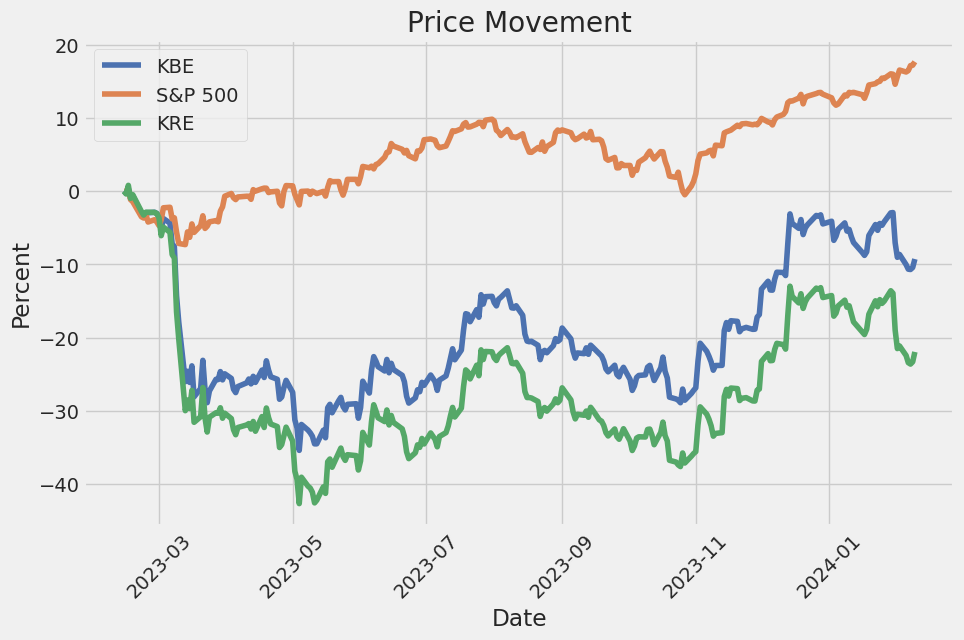
The linear regression model analyzing the relationship between KBE (a banking ETF) and SPY (a broader market ETF representing the S&P 500) reveals a significant correlation with an R-squared value of 0.526. This statistic indicates that approximately 52.6% of the variability in KBE's returns can be explained by movements in the SPY ETF. With a beta coefficient of 1.2341, this implies that KBE tends to move, on average, 1.234 times the movement in SPY - indicating a high degree of sensitivity to market movements. The alpha value of the model, at -0.0419, signifies that after accounting for market movements, KBE's performance is slightly below the expected return based on its beta risk. However, the statistical significance of alpha suggests that it might not provide a potent explanation of KBE's performance outside of the market's influence.
This regression analysis is further backed by key statistics like the F-statistic of 1393 with a near-zero probability, strongly rejecting the null hypothesis that there is no linear relationship between KBE and SPY. Moreover, the model's coefficients are statistically significant as evident from their p-values, reinforcing the robustness of the relationship between KBE's returns and market movements. Despite the slightly negative alpha, the positive and substantial beta suggests that KBE is significantly influenced by the broader market's performance. The model also highlights certain distributional characteristics in the residuals, such as skewness and kurtosis, which suggest deviations from normality but do not invalidate the general findings of market sensitivity as depicted by the high beta value.
The Financial sector's performance, particularly within the banking industry, has manifested varying degrees of performance across its leading entities. The standout, JPMorgan Chase & Co, has significantly marked its presence with record full-year earnings and an upward trajectory in its investment banking revenue. Such achievements set a stark contrast against other major banks like Wells Fargo, which anticipates a potential 9% decrease in net interest income in the coming year. Citigroup Inc and Bank of America Corp are contending with their unique challenges, particularly in the realm of trading revenue declines and operational restructuring efforts. These efforts are pivotal amidst the broader sectoral and economic uncertainties currently at play.
At the crux of Citigroup Inc's strategy lies a comprehensive restructuring and cost management pursuit spearheaded by CEO Jane Fraser. This denotes an ambition towards a sustainable turnaround following years of organizational inertia. The bank's strategic overhaul signifies a crucial pivot as it endeavors to refocus on core businesses while exiting non-strategic markets such as Russia. This maneuver places Citigroup on a path that somewhat diverges from JPMorgans, especially considering the latter's expansion in areas that Citigroup has decided to abandon.
JPMorgan CEO Jamie Dimon's commentary around consumer markets reflects an expectation of normalization, despite dwindling excess savings. The resilience of the consumer base remains a pivotal factor with implications on overall consumer spending and potential dampening effects against broader economic challenges.
| company | symbol | percent |
|---|---|---|
| Corebridge Financial Inc | CRBG | 1.96 |
| Citigroup Inc | C | 1.89 |
| Bank of New York Mellon Corp | BK | 1.86 |
| Western Alliance Bancorp | WAL | 1.86 |
| Citizens Financial Group Inc | CFG | 1.82 |
| JPMorgan Chase & Co | JPM | 1.81 |
| Bank of America Corp | BAC | 1.81 |
| KeyCorp | KEY | 1.81 |
| Fifth Third Bancorp | FITB | 1.81 |
| Apollo Global Management Inc Class A | APO | 1.80 |
The SPDR S&P Bank ETF, through its recent earnings reports and market trends as discussed, navigates a terrain fraught with both prospects and hurdles. A recent discourse, particularly around the "noisy quarter" faced by banks due to special assessments levied to cover insurance fund shortfalls, entails a mixed outlook on net interest income which is crucial for profitability. High interest rates and market stability generally bode well for banks; however, regional banks face vulnerability due to a lower interest rate environment.
Amid these conditions, the SPDR S&P Bank ETF has demonstrated stability, managing to trade above $50, showcasing a semblance of steadiness within the sector. Nevertheless, sustainability through the earnings season remains speculative, given the unique risks smaller banks confront. The sector's resilience, while managing significant risks akin to those associated with commercial real estate, denotes a cautiously optimistic stance heading into successive earnings seasons.
The Federal Reserve's potential regulatory changes, prompted by the collapse of Silicon Valley Bank, underline a proposed increase in capital requirements for banks with at least $100 billion in assets. This regulatory tilt could complicate operational environments for smaller banks, pushing them towards mergers or heightened compliance costs. This shift, coupled with the precarious state of small businesses reliant on these banks for loans, emphasizes the interconnected challenges facing the sector.
The discussion on the resilience of traditional banking in the face of economic cycles and regulatory shifts, contrasted with the varying fortunes of investment-grade bonds amidst fluctuating interest rates, underscores a shifting balance. The SPDR S&P Bank ETF's performance, encapsulated within this dynamic financial landscape, mirrors the broader economic indicators, regulatory environments, and the pivotal role of smaller banking institutions.
Morgan Stanley's optimistic positioning of major banks such as Goldman Sachs, Bank of America, and Citigroup as "significantly undervalued," coupled with panel discussions on CNBC, reflect a sentiment of undervalued potential within the banking sector. This outlook is juxtaposed against the cautionary perspectives from Seeking Alpha, highlighting persistent challenges notwithstanding the recent bounce observed in the KBE ETF.
Concerns around commercial real estate and its implications on the banking industry, as highlighted in the Seeking Alpha article titled "KBE: CRE Worries Coming Home To Roost", point towards significant vulnerabilities. The banking sector's exposure to CRE loans, amid depreciating property values and rising loan-to-value ratios, poses notable risks that bear monitoring, indicative of the intricate interplay between market dynamics and the SPDR S&P Bank ETF's performance.
The volatility of SPDR S&P Bank ETF (KBE) from February 13, 2019, to February 9, 2024, can be summarized through a financial model called the Zero Mean - ARCH Model. This model shows that the ETF's returns do not follow a predictable pattern, meaning its price fluctuations are random over time. According to the model, the 'omega' value indicates that there is a base level of volatility present, while the 'alpha' value suggests that past volatility significantly influences future volatility. These statistics highlight the unpredictable nature of KBE's performance, with sharp price movements being a common feature over the observed period.
| Statistic Name | Statistic Value |
|---|---|
| Log-Likelihood | -2665.84 |
| AIC | 5335.68 |
| BIC | 5345.95 |
| No. Observations | 1256 |
| Omega | 2.7571 |
| Alpha[1] | 0.4683 |
Analyzing the financial risk associated with a $10,000 investment in SPDR S&P Bank ETF (KBE) over a one-year period demands a sophisticated approach integrating volatility modeling and machine learning predictions. This comprehensive analysis involves understanding the dynamics of stock market movements and the specific risks tied to the banking sector, which is represented by KBE.
Volatility modeling, a critical part of this analysis, serves to quantify the variability or uncertainty in returns for KBE. This model helps in capturing the persistence of volatility shocks over time, a crucial aspect when assessing the risk of investments in highly fluctuating market segments like banking. Through this modeling, the underlying volatilities that are not directly observable from historical price data are inferred, providing insights into the expected variations in returns. This methodology is essential in capturing the complex dynamics of stock price movements, especially in a sector that can be heavily impacted by regulatory changes, economic shifts, and interest rate adjustments.
On the other hand, machine learning predictions, specifically utilizing a model akin to the RandomForestRegressor in nature, play a pivotal role in forecasting future returns based on a multitude of factors, including historical price data and volatility estimates. This model is adept at handling non-linear relationships and interactions between various predictors, which are typical in financial markets. The ensemble approach, aggregating multiple decision trees to make a single prediction, enhances the prediction accuracy and helps in identifying the determinants of stock returns with a higher degree of reliability.
When integrating the insights from volatility modeling with those from machine learning predictions, a comprehensive picture of the expected financial risk emerges. The analysis focuses on calculating the Value at Risk (VaR), a widely recognized measure of market risk, at a 95% confidence level. For the $10,000 investment in KBE, the annual VaR is determined to be $343.66. This figure represents the potential loss in value of the investment over a one-year period, under normal market conditions, with a 95% confidence level.
This articulated risk level underscores the importance of such advanced analytical approaches in understanding and mitigating investment risks. The integration of detailed volatility assessments with predictive analytics can offer investors a clearer view of the potential financial exposure when engaging in equity investments, specifically within the volatile banking sector. This analysis, through its calculated VaR, highlights the potential financial risks involved, thus informing investment strategy and risk management decisions in a sophisticated and nuanced manner.
Analyzing the options for SPDR S&P Bank ETF (KBE) focusing on call options and leveraging The Greeks to identify the most profitable opportunities, we notice significant variations in the profitability potential across the options spectrum due to differences in Delta, Gamma, Vega, Theta, Rho, and other metrics such as days to expiration, premiums, return on investment (ROI), and projected profit. Given the target being a 5% increase in the current stock price, options that are closer to being "in-the-money" or slightly "out-of-the-money" strike a balance between risk and reward, assuming higher Delta values and favorable Theta decay rates, which help in identifying the most opportune trades.
Short-term Expiration Analysis
- For options expiring in the near term (within 3 days), those with strike prices around 42.0 and 45.0 stand out. The option with a strike price at 42.0 shows a remarkable ROI of 2.1164, with a Delta of 0.7115, and a relatively high Gamma of 0.1007, suggesting a high sensitivity to the stock price movement favorable to our bullish assumption. Despite its higher premium, the combination of these Greeks and its ROI makes it appealing.
- Meanwhile, the option with a strike of 45.0, expiring in the same timeframe, presents the highest ROI of 3.4775, despite its lower Delta of 0.2666. Its significant Gamma of 0.1688 denotes potential responsiveness to the stock's price movements, making it an aggressive but potentially very profitable choice if the stock performs as expected.
Medium-term Expiration Analysis
- In the realm of options expiring in about a month (31 days), the call option with a strike at 42.0 and 43.0 offer intriguing prospects. Both present high Vega values, rightfully indicating substantial price sensitivity to implied volatility changes - beneficial in volatile markets. Especially, the option at a 43.0 strike with an ROI of 0.8097 and a compelling Vega of 4.9744 shows promise for substantial profitability with market movements aligning with our bullish outlook.
Long-term Perspective
- Looking far ahead, options expiring in roughly a year (339 days) present a different profitability landscape. The option with a strike price at 36.0, showcasing an ROI of 0.9441 and a Delta of 0.7549, combined with a high Vega of 13.2447, indicates resilience and profitability potential over a more extended period, assuming a favorable rise in volatility and stock price.
- Another long-term call with the strike price at 39.0, expiring in 339 days, albeit with a modest immediate ROI, its substantial Gamma and Vega suggest that any favorable movement in stock price and volatility could significantly enhance its profitability, a testament to the potential benefits of strategizing with a longer-term perspective.
Conclusion
Considering the array of choices and their associated Greeks, the most profitable options are those which balance a high Delta for immediate price movement sensitivity, a reasonable Theta to minimize time decay, especially for short term, and a high Vega for leveraging volatility changes. The short-term options at 42.0 and 45.0 strikes provide immediate profit-making opportunities with substantial ROIs. In contrast, from a medium to long-term perspective, the options with strikes at 42.0, 43.0, and notably 36.0 and 39.0 for those looking for extended investment periods, offer strategic diversity to a bullish portfolio anticipating a 5% stock price increase. Notably, the evolving market context and individual risk tolerance dictate the ultimate selection to align with one's trading objectives and market outlook.
Similar Companies in Investment Trusts/Mutual Funds:
Report: SPDR S&P Regional Banking ETF (KRE), SPDR S&P Regional Banking ETF (KRE), Report: SPDR S&P Insurance ETF (KIE), SPDR S&P Insurance ETF (KIE), SPDR S&P Retail ETF (XRT), SPDR S&P Homebuilders ETF (XHB), SPDR S&P Metals and Mining ETF (XME), JPMorgan Chase & Co. (JPM), Report: Bank of America Corp (BAC), Bank of America Corp (BAC), Report: Wells Fargo & Company (WFC), Wells Fargo & Company (WFC), Report: Citigroup Inc. (C), Citigroup Inc. (C), Goldman Sachs Group, Inc. (GS), Report: Morgan Stanley (MS), Morgan Stanley (MS), Report: PNC Financial Services Group, Inc. (PNC), PNC Financial Services Group, Inc. (PNC), U.S. Bancorp (USB), Truist Financial Corporation (TFC), Charles Schwab Corporation (SCHW)
https://www.youtube.com/watch?v=zFKjg88uUR4
https://www.youtube.com/watch?v=fOCMUIqSHas
https://www.youtube.com/watch?v=6ofZpNe5AN4
https://seekingalpha.com/article/4664083-kbe-etf-dont-be-fooled-by-bounce-still-trouble-here
https://www.etftrends.com/whats-hot-not-besides-bitcoin-etfs/
https://www.youtube.com/watch?v=nO_enkFSzJg
https://seekingalpha.com/article/4667047-kbe-cre-worries-coming-home-to-roost
https://www.youtube.com/watch?v=tKv-nsLcBew
https://www.youtube.com/watch?v=VyTm2HKuvws
Copyright © 2024 Tiny Computers (email@tinycomputers.io)
Report ID: J0agBEZ
Cost: $0.33492
https://reports.tinycomputers.io/KBE/KBE-2024-02-12.html Home