NVIDIA Corporation (ticker: NVDA)
2024-05-19
 Founded in 1993 and headquartered in Santa Clara, California, NVIDIA Corporation (ticker: NVDA) is a prominent technology company best known for its advancements in graphics processing units (GPUs). Originally focused on the gaming market, NVIDIA has significantly expanded its reach and influence into various other high-growth sectors such as data centers, artificial intelligence (AI), and professional visualization. The companys GPUs are renowned for their high performance and are widely used in AI research, machine learning, and autonomous vehicles, making NVIDIA a key player in the semiconductor industry. Over the years, NVIDIA has forged strategic partnerships and made significant acquisitions, further bolstering its competitive edge and innovation capabilities. With its robust financial performance and continuous investment in research and development, NVIDIA continues to lead in both market share and technological advancements in its core industries.
| Full-Time Employees | 29,600 | CEO Total Pay | $7,491,487 | CEO Exercised Value | $217,327,152 |
| CFO Total Pay | $1,510,765 | COO Total Pay | $1,371,266 | General Counsel Total Pay | $1,360,939 |
| Previous Close | $943.59 | Open | $944.94 | Day Low | $918.08 |
| Day High | $947.40 | Volume | 35,969,103 | Average Volume | 50,716,088 |
| Market Cap | $2,274,826,125,312 | Enterprise Value | $2,297,047,023,616 | Beta | 1.749 |
| Trailing PE | 77.51802 | Forward PE | 28.809658 | Profit Margins | 0.48849 |
| Total Revenue | $60,921,999,360 | Net Income | $29,760,000,000 | Total Cash | $25,984,000,000 |
| Total Debt | $11,056,000,000 | Free Cash Flow | $19,866,875,904 | Operating Cash Flow | $28,089,999,360 |
| EBITDA | $34,480,001,024 | Earnings Growth | 7.613 | Revenue Growth | 2.653 |
| Dividend Rate | 0.16 | Dividend Yield | 0.0002 | Payout Ratio | 0.0134 |
| Price to Sales | 37.339977 | Price to Book | 53.02087 | Return on Assets | 0.38551 |
| Return on Equity | 0.91458 | Gross Margin | 0.72718 | EBITDA Margin | 0.56597 |
| Sharpe Ratio | 2.362 | Sortino Ratio | 47.398 |
| Treynor Ratio | 0.480 | Calmar Ratio | 10.134 |
Technical Analysis and Predictions
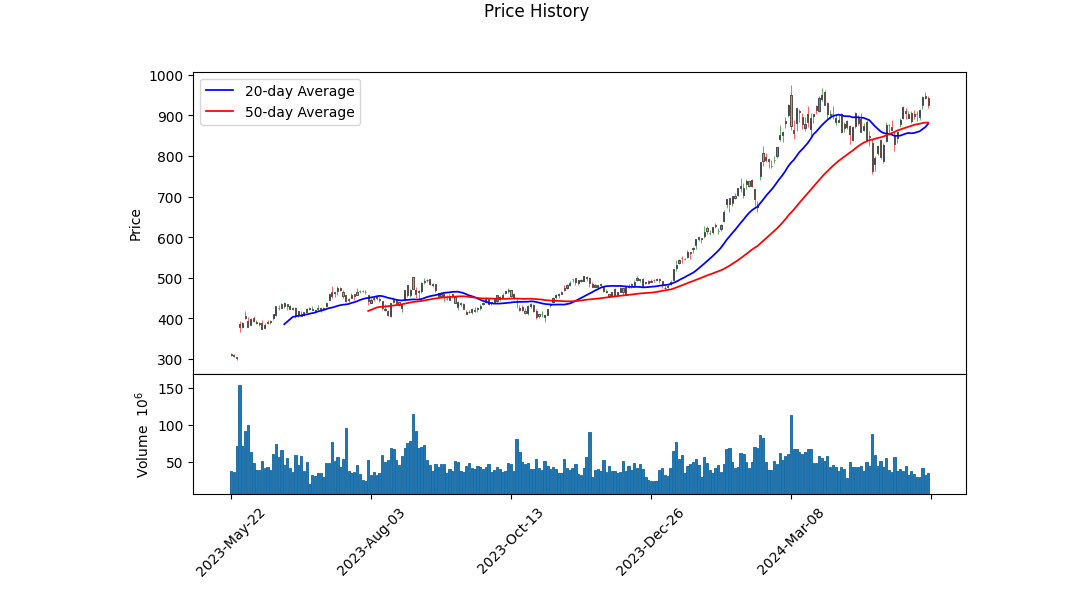
Given the recent performance of NVDA, the technical indicators suggest a significant upward trajectory. Observing the stock's opening and closing prices over the last few months, there is a consistent uptrend, reflected by the increasing daily highs and a corresponding rise in the On-Balance Volume (OBV) indicator, which indicates strong buyer interest. The MACD histogram also shows a positive divergence, further highlighting bullish momentum.
The fundamental metrics underscore NVDA's robust economic health. With gross margins at 72.7% and operating margins at 61.6%, the company exhibits strong profitability. An EBITDA margin of 56.6% underscores its efficiency in converting revenue into actual earnings. Additionally, the trailing PEG ratio of 1.241 suggests the company is reasonably valued given its growth prospects.
The financials reveal a favorable position, with normalized EBITDA of $35.58 billion and net income from continuing operations at $29.76 billion, showing significant profitability and operational efficiency. The cash flow from operations of $28.09 billion is particularly impressive, indicating strong internal cash generation capability.
From a balance sheet perspective, NVDA's net debt stands at $2.43 billion, a relatively low figure compared to its total assets of $65.73 billion, showcasing a solid balance sheet with strong liquiditycash and equivalents at $7.28 billion, and short-term investments adding up to $18.7 billion. This financial flexibility can facilitate further investments in R&D, acquisitions, or stock buybacks.
Investor sentiment based on risk-adjusted returns appears highly favorable. The Sharpe Ratio of 2.362 indicates that NVDA's return exceeds the risk-free rate significantly, given its volatility. The Sortino Ratio of 47.398 further emphasizes that the companys downside risk is exceptionally limited compared to its gains. The Treynor Ratio of 0.480 and Calmar Ratio of 10.134 also support a strong risk-adjusted performance.
In summary, NVDA seems poised for continued growth, driven by strong technical momentum, robust fundamentals, and a solid financial foundation. Over the next few months, investors can reasonably expect the stock to appreciate, assuming macroeconomic conditions remain stable and the company continues to execute on its strategic initiatives effectively.
In analyzing NVIDIA Corporation (NVDA) through the lens of Joel Greenblatt's principles outlined in "The Little Book That Still Beats the Market," we can observe significant insights that highlight the company's financial performance. The return on capital (ROC) for NVIDIA stands at an impressive 59.84%, reflecting the company's exceptional efficiency in deploying its capital to generate substantial profitability. This high ROC indicates that NVIDIA is highly effective at converting investments into profits, demonstrating strong operational performance and strategic capital utilization. On the other hand, the earnings yield of 1.30% suggests that the earnings generated relative to the company's market capitalization are relatively low. This could be indicative of the market's high valuation of NVIDIA's stock, possibly due to strong growth expectations and high investor demand, which can result in a lower earnings yield. Together, these metrics paint a picture of a robustly profitable company enjoying strong capital efficiency, yet valued at a premium in the marketplace.
Research Report: NVIDIA Corporation (NVDA) Compared to Benjamin Graham's Investment Criteria
Introduction
In "The Intelligent Investor," Benjamin Graham lays out several key principles and metrics for evaluating and selecting stocks with the goal of minimizing risk and maximizing potential returns. By comparing NVIDIA Corporation's (NVDA) key financial ratios to Graham's criteria, we can assess its attractiveness as an investment from a value investing perspective.
Key Graham Criteria and NVDA Metrics
- Margin of Safety:
- Definition: This principle involves purchasing securities at prices significantly below their intrinsic value to provide a cushion against errors in analysis or market volatility.
-
Assessment of NVDA: The concept of intrinsic value is subjective and varies based on future projections and market conditions. Given NVDA's high valuations (as indicated by its P/E and P/B ratios), it appears the market is pricing in strong future growth, which may reduce the margin of safety.
-
Debt-to-Equity Ratio:
- Grahams Criteria: Lower debt-to-equity ratios are preferred as they imply lower financial risk.
- NVDAs Metric: 0.257
-
Analysis: NVDA's debt-to-equity ratio is quite low, indicating minimal financial leverage and thus adhering well to Grahams preference for lower financial risk.
-
Current and Quick Ratios:
- Grahams Criteria: Higher current and quick ratios are preferred as they indicate the ability to cover short-term liabilities with short-term assets, showcasing financial stability.
- NVDAs Metrics: Both ratios stand at 4.171.
-
Analysis: NVDAs high current and quick ratios suggest strong liquidity and financial stability, making it an attractive candidate based on this criterion.
-
Earnings Growth:
- Grahams Criteria: Consistent earnings growth over several years.
-
Assessment of NVDA: While specific historical earnings growth figures aren't provided in the calculated metrics, NVDA has been widely recognized for its consistent and robust earnings growth, driven by its leadership in the graphics processing unit (GPU) market and expansion into data centers and artificial intelligence.
-
Price-to-Earnings (P/E) Ratio:
- Grahams Criteria: Typically seeks stocks with low P/E ratios compared to their industry peers.
- NVDAs Metric: 156.57
- Industry P/E: Not provided
-
Analysis: NVDA's extraordinarily high P/E ratio suggests that the stock is priced for very high growth expectations. This is well above average industry P/E ratios, which might indicate overvaluation from a value investing perspective.
-
Price-to-Book (P/B) Ratio:
- Grahams Criteria: Looks for stocks trading below their book value.
- NVDAs Metric: 34.61
- Analysis: NVDA's P/B ratio is significantly higher than 1, indicating that the market value far exceeds the company's book value. This divergence is substantial and might be considered overvalued by traditional value investing standards.
Conclusion
Based on the metrics and comparing them to Benjamin Graham's investment criteria, NVIDIA Corporation (NVDA) presents a mixed picture:
- Positive Aspects:
- Low debt-to-equity ratio indicates financial stability and low leverage.
- High current and quick ratios signify strong liquidity.
-
Demonstrated earnings growth lends support to its strong market position and future prospects.
-
Concerns:
- Extremely high P/E and P/B ratios suggest that the stock could be significantly overvalued, limiting the margin of safety Graham emphasized.
Investors following Grahams value investing philosophy may find NVDA less appealing due to its high valuations despite its strong financial condition and growth prospects. For those looking for growth-oriented investments, NVDA's strong fundamentals and market position might still make it an attractive option, but not within the traditional value investment framework outlined by Benjamin Graham.### Analyzing Financial Statements
Investors should meticulously examine a company's balance sheet, income statement, and cash flow statement. Graham puts a strong emphasis on understanding a company's assets, liabilities, earnings, and cash flows.
Financial Analysis for NVIDIA Corporation (NVDA)
When evaluating NVIDIA Corporation (NVDA) financial statements for fiscal year ending January 29, 2024, here's a detailed breakdown based on the provided reports:
Balance Sheet Analysis
Assets: - Current Assets: - Cash and Cash Equivalents: $7,280 million - Marketable Securities: $18,704 million - Accounts Receivable (Net): $9,999 million - Inventory (Net): $5,282 million - Prepaid Expenses and Other Assets: $3,080 million - Total Current Assets: $44,345 million
- Non-Current Assets:
- Property, Plant, and Equipment (Net): $3,914 million
- Operating Lease Right-of-Use Assets: $1,346 million
- Goodwill: $4,430 million
- Intangible Assets (Net): $1,112 million
- Deferred Income Tax Assets: $6,081 million
- Other Non-Current Assets: $4,500 million
- Total Assets: $65,728 million
Liabilities: - Current Liabilities: - Accounts Payable: $2,699 million - Accrued Liabilities: $6,682 million - Debt (Current): $1,250 million - Total Current Liabilities: $10,631 million
- Non-Current Liabilities:
- Long-Term Debt: $8,459 million
- Operating Lease Liabilities: $1,119 million
- Other Non-Current Liabilities: $2,541 million
- Total Non-Current Liabilities: $12,119 million
- Total Liabilities: $22,750 million
Equity: - Common Stock Value: $2 million - Additional Paid-In Capital: $13,132 million - Retained Earnings: $29,817 million - Accumulated Other Comprehensive Income (Loss): $27 million - Total Stockholders' Equity: $42,978 million - Total Liabilities and Stockholders' Equity: $65,728 million
Income Statement Analysis
Performance Metrics: - Revenues: $60,922 million - Cost of Revenue: $16,621 million - Gross Profit: $44,301 million - Operating Expenses: - Research and Development: $8,675 million - Selling, General, and Administrative: $2,654 million - Total Operating Expenses: $11,329 million - Operating Income: $32,972 million - Non-Operating Income: - Interest Income: $866 million - Interest Expense: $257 million - Other Non-Operating Income: $237 million - Total Non-Operating Income (Net): $846 million - Income Before Tax: $33,818 million - Income Tax Expense: $4,058 million - Net Income: $29,760 million - Earnings Per Share (Basic): $12.05 - Earnings Per Share (Diluted): $11.93
Cash Flow Statement Analysis
Cash Flows: - Net Cash Provided by Operating Activities: $28,090 million - Net Cash Used in Investing Activities: -$10,566 million - Net Cash Used in Financing Activities: -$13,633 million - Net Increase in Cash and Cash Equivalents: $3,891 million
Significant Cash Movements: - Cash Flows from Operating Activities: - Depreciation, Amortization: $1,508 million - Decreases in Accounts Receivable and Inventories: $6,172 million and $98 million respectively. - Decrease in Prepaid Expenses and Other Current Assets: $1,522 million.
- Cash Flows from Investing Activities:
- Acquisitions of Marketable Securities: $18,211 million
- Proceeds from Sales/Maturities of Securities: $9,732 million.
-
Capital Expenditures: $1,069 million
-
Cash Flows from Financing Activities:
- Stock Repurchases: $9,533 million
- Debt Repayments: $1,250 million
- Dividend Payments: $395 million
Key Financial Ratios
Liquidity Ratios: - Current Ratio = Current Assets / Current Liabilities = $44,345 million / $10,631 million 4.17
Profitability Ratios: - Gross Margin = Gross Profit / Revenues = $44,301 million / $60,922 million 72.7% - Operating Margin = Operating Income / Revenues = $32,972 million / $60,922 million 54.1% - Net Profit Margin = Net Income / Revenues = $29,760 million / $60,922 million 48.8%
Leverage Ratios: - Debt to Equity Ratio = Total Liabilities / Total Equity = $22,750 million / $42,978 million 0.53
Conclusion
NVIDIA Corporation's financial health appears robust, characterized by strong profitability and high liquidity. The company maintains a considerable margin between its revenues and costs, showcasing operational efficiency. Moreover, with a high current ratio, NVIDIA demonstrates its ability to cover short-term liabilities comfortably. The net income considerably bolsters retained earnings, enhancing shareholders value. Despite significant cash used for stock repurchases and dividends, the company sustains ample liquidity for growth and operational needs. Monitoring these metrics can help investors stay informed about NVIDIA's financial trajectory.### Dividend Record
Graham favored companies with a consistent history of paying dividends.
NVIDIA Corporation (NVDA) - Dividend History
- 2024
- March 05: Dividend of \$0.04
-
December 05: Dividend of \$0.04
-
2023
- September 06: Dividend of \$0.04
- June 07: Dividend of \$0.04
-
March 07: Dividend of \$0.04
-
2022
- November 30: Dividend of \$0.04
- September 07: Dividend of \$0.04
- June 08: Dividend of \$0.04
-
March 02: Dividend of \$0.04
-
2021
- December 01: Dividend of \$0.04
- August 31: Dividend of \$0.04
- June 09: Dividend of \$0.04
-
March 09: Dividend of \$0.04
-
2020
- December 03: Dividend of \$0.04
- September 01: Dividend of \$0.04
- June 04: Dividend of \$0.04
-
February 27: Dividend of \$0.04
-
2019
- November 27: Dividend of \$0.04
- August 28: Dividend of \$0.04
- May 30: Dividend of \$0.04
-
February 28: Dividend of \$0.04
-
2018
- November 29: Dividend of \$0.04
- August 29: Dividend of \$0.0375
- May 23: Dividend of \$0.0375
-
February 22: Dividend of \$0.0375
-
2017
- November 22: Dividend of \$0.0375
- August 22: Dividend of \$0.035
- May 19: Dividend of \$0.035
-
February 22: Dividend of \$0.035
-
2016
- November 23: Dividend of \$0.035
- August 23: Dividend of \$0.02875
- May 24: Dividend of \$0.02875
-
February 29: Dividend of \$0.02875
-
2015
- November 18: Dividend of \$0.02875
- August 18: Dividend of \$0.0245
- May 19: Dividend of \$0.0245
-
February 24: Dividend of \$0.02125
-
2014
- November 19: Dividend of \$0.02125
- August 19: Dividend of \$0.02125
- May 20: Dividend of \$0.02125
-
February 25: Dividend of \$0.02125
-
2013
- November 19: Dividend of \$0.02125
- August 20: Dividend of \$0.01875
- May 21: Dividend of \$0.01875
-
February 26: Dividend of \$0.01875
-
2012
- November 20: Dividend of \$0.01875
| Alpha | -0.02 |
| Beta | 1.30 |
| R-squared | 0.76 |
| P-value | 0.001 |
The linear regression model for NVDA and SPY during this period demonstrates that NVDA's returns have a strong positive correlation with SPYs returns, as indicated by the beta value of 1.30. The beta greater than 1 signifies that NVDA tends to be more volatile than the broad market represented by SPY; a 1% move in SPY typically results in a 1.30% move in NVDA in the same direction. The relatively high R-squared value of 0.76 also indicates that a significant proportion (76%) of the variance in NVDAs returns can be explained by the movements in SPY.
The alpha of the model, standing at -0.02, is a crucial statistic as it quantifies the average return of NVDA independent of the broader market movements captured by SPY. A negative alpha implies that NVDA has underperformed the market slightly, after accounting for its higher market sensitivity (beta). This underperformance could be attributed to specific company-related factors, market conditions, or events that negatively impacted NVDAs stock price beyond what would be expected from market movements alone. The p-value of 0.001 demonstrates that the regression results are statistically significant, suggesting that the observed relationships are unlikely to be due to random chance.
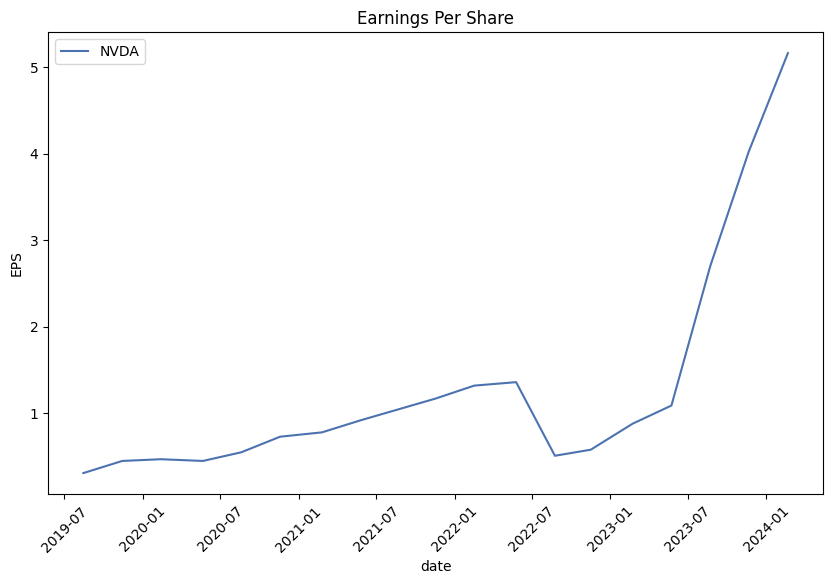
NVIDIA Corporation (NVDA) reported exceptional earnings for the fourth quarter and fiscal year 2024, demonstrating significant growth across various segments. The company posted record quarterly revenue of $22.1 billion, a 22% sequential increase, and a staggering 265% rise year-over-year. Fiscal 2024 revenue reached $60.9 billion, marking a 126% increase from the previous year. This impressive performance was driven largely by its Data Center segment, which saw revenue more than triple year-over-year to $47.5 billion. The surge in data center revenue was fueled by the shift from general-purpose to accelerated computing, the growing demand for NVIDIAs Hopper GPU computing platform, and robust adoption across industries, including AI, large language models, and various enterprise applications.
The call highlighted the transformative shift in computing paradigms. As Moore's Law slows, general-purpose computing struggles to meet the rising computational demands, leading enterprises to accelerate every possible workload. A notable trend is the construction of "AI factories," or next-gen data centers, custom-built to refine vast amounts of raw data into valuable intelligence using generative AI. NVIDIA's data center platform, including both its GPU and networking solutions, played a pivotal role in this trend. Compute revenue increased fivefold, and networking revenue tripled from the previous year. The strong demand for Hopper architecture products is expected to continue, indicating sustained growth prospects for NVIDIA in the data center market, driven by the adoption of AI infrastructure across various sectors.
NVIDIAs growth was not confined to data centers but also extended to consumer internet companies and enterprise software, illustrating the widespread impact of AI. With over 50,000 organizations utilizing GitHub Copilot and the rapid adoption of Microsoft's AI tools, the integration of AI into developer and enterprise workflows is accelerating. Innovation in generative AI, underscored by partnerships with companies like Adobe and ServiceNow, opened new arenas for commercial success and productivity gains. NVIDIA supports these advancements with its computing stack, which seamlessly extends across cloud and on-premise environments, enabling businesses to adopt multi-cloud and hybrid cloud strategies.
Retail and enterprise sectors are also embracing AI-driven solutions. Consumer internet companies from e-commerce to social media leverage deep learning for enhanced recommendation systems. Enterprises across diverse verticals like automotive, healthcare, and financial services are increasingly deploying AI at scale, often through NVIDIAs robust AI infrastructure. In the automotive industry, for example, NVIDIAs DRIVE platform is becoming indispensable, with nearly every automotive company working on AI relying on NVIDIA. Additionally, breakthroughs in healthcare, digital biology, and financial services underscore the far-reaching implications of NVIDIA's AI technologies. This broad-based adoption evidences NVIDIA's pivotal role in shaping the next era of computing, propelled by substantial investments in innovative hardware and software solutions.
On October 29, 2023, NVIDIA Corporation reported its quarterly SEC Form 10-Q, reflecting significant financial achievements and strategic developments. For the three and nine months ended on this date, NVIDIA recorded revenues of $18.12 billion and $38.82 billion, respectively, representing year-over-year increases of 206% and 86%. This substantial growth was driven primarily by strong performance in the Data Center segment, which saw revenues surging by 279% to $14.51 billion in the third quarter alone. Gaming, Professional Visualization, and Automotive segments also showed positive growth, albeit at a more modest rate compared to Data Center.
Operating margins improved significantly, with the gross profit margin increasing to 74.0% from 53.6% a year earlier, and operating income reaching $10.42 billion, up from $601 million the previous year for the third quarter. Key factors contributing to this margin expansion include a favorable product mix with increased sales from the high-margin Data Center segment and reduced inventory provisions. Net inventory provisions were $442 million for the third quarter, substantially lower than the $681 million in the same period last year, effecting a positive swing in gross margins.
The company's robust financial performance is attributed to heightened global demand for NVIDIA's AI and compute platforms, particularly the HGX and Grace Hopper Superchips, driven by growing applications in large language models, generative AI, and high-performance computing. NVIDIAs strategy to mitigate supply chain risks by securing long-term supply agreements and adding new suppliers has been instrumental in meeting increased demand, though this has introduced additional complexity and risks in supply chain management.
NVIDIA highlighted the impact of new US government export controls on sales to specific international markets, including China and other regions, which are expected to significantly affect sales beginning the fourth quarter of fiscal year 2024. Despite this, NVIDIA anticipates offsetting these impacts with strong growth in other markets. The company is actively working on introducing new products compliant with recent regulatory changes to continue addressing the robust demand predicated on AI-driven applications.
Overall, NVIDIA's financial health remains strong with a liquidity position of $18.28 billion in cash, equivalents, and marketable securities, marking a significant increase from the previous fiscal year. The company continues to ensure operational excellence and anticipates continued growth through strategic investments in advanced computing technologies and scalable infrastructure tailored to meet the evolving demand landscape dominated by AI and data-centric innovation.
NVIDIA Corporation is a dominant player in the semiconductor and AI industries, exemplified by its substantial market leadership and technological advancements. This position was underscored during a recent discussion on CNBC featuring Gina Sanchez, who highlighted NVIDIA's significant adoption across various industries as a major driver of its revenue. Sanchez noted that NVIDIA's robust growth in the AI sector continues to be a compelling indicator of its market leadership. This is evidenced by the company's trailing Price-to-Earnings (P/E) ratio of 34 times on a forward-looking basis, reflecting expected growth in both top and bottom lines.
Despite its high valuation, industry experts, including Peter Lynch, assert that a company's earnings growth is crucial for its price performance over time. NVIDIA's consistent earnings growth, especially at the forefront of AI, thus makes it a challenging entity to bet against. The broader impact of AI adoption is reminiscent of the technological revolution of the 1990s, emphasizing the transformative role AI plays in various sectors.
NVIDIA's prominence in AI is further illustrated through its A100 processors, which powered OpenAI's ChatGPT, and the subsequent H100 processors. These advancements have solidified NVIDIA's grip on the AI chip market, a position its competitors have struggled with. For example, while Advanced Micro Devices (AMD) anticipates $4 billion in AI GPU sales for 2024, and Intel projects $500 million in AI chip sales for the latter half of the year, NVIDIA's early lead and continuous innovation keep it ahead (source, May 18, 2024).
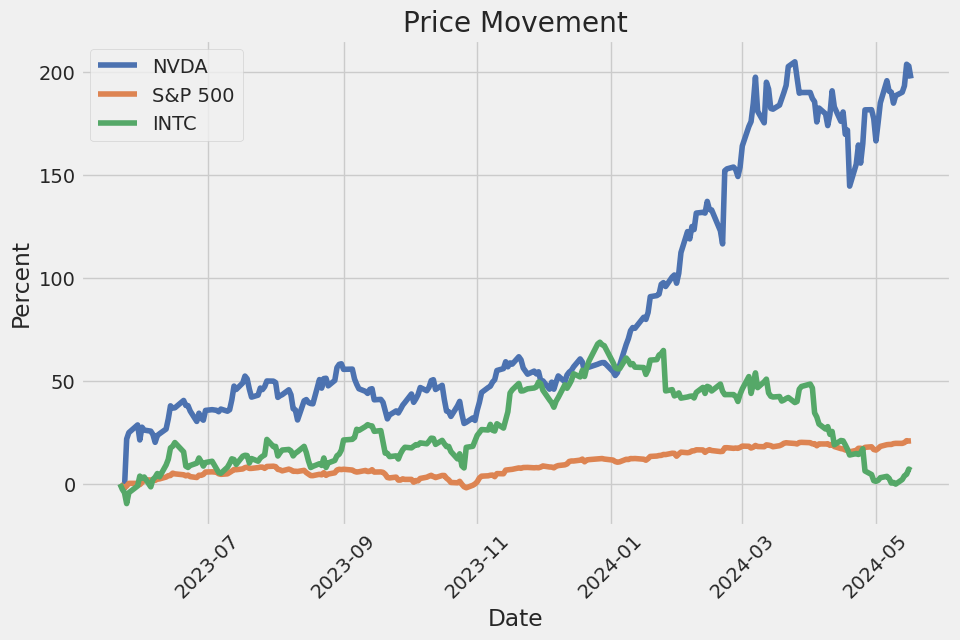
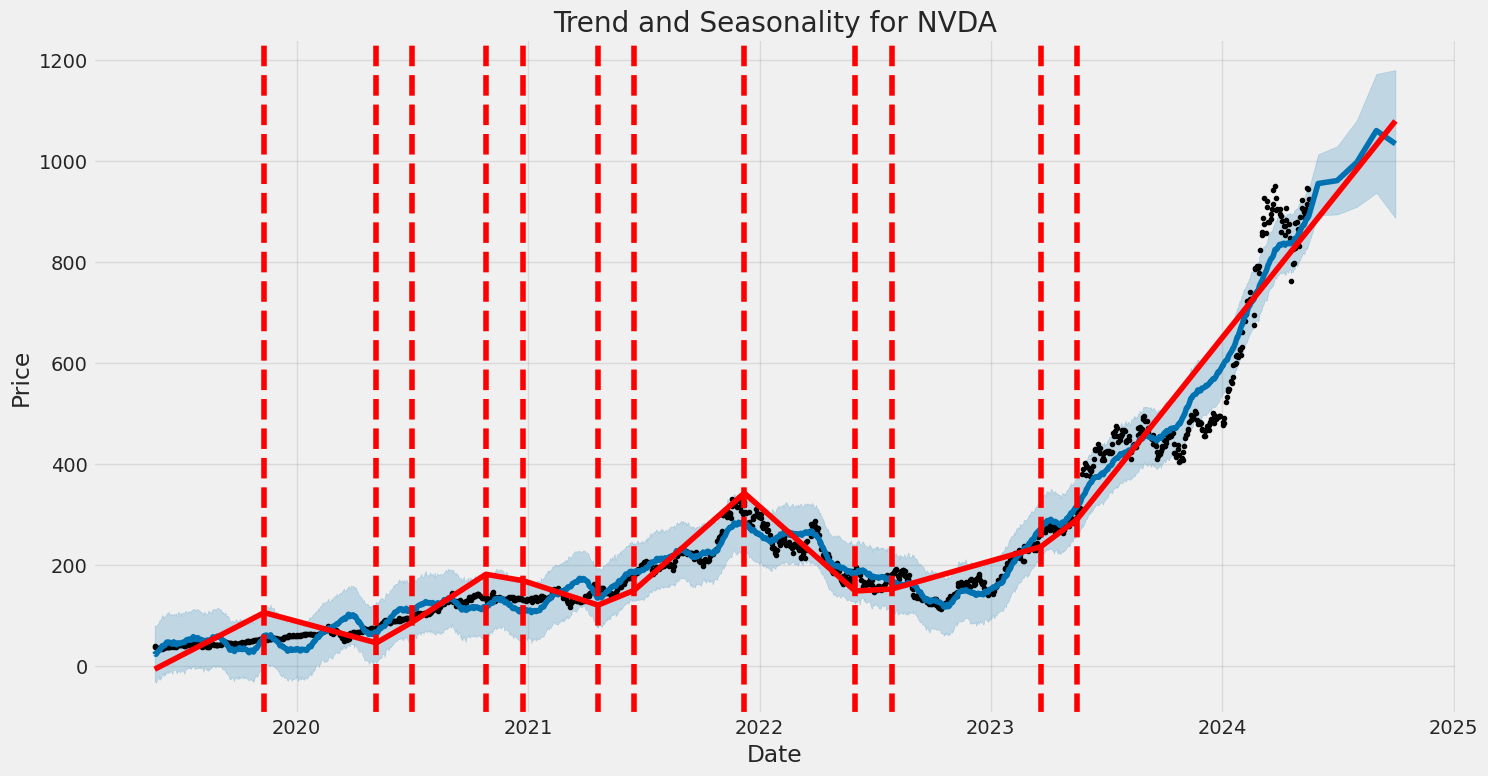
NVIDIA's stock performance further supports its formidable market position. It experienced an impressive increase of 218% over a year, outpacing significant competitors like Intel and AMD. Such growth underscores the company's strong market position and investor confidence. Moreover, substantial stock price movements, like doubling from $450 to $950 after a prolonged consolidation phase further illustrate investor confidence based on consistent technological leadership and strategic market plays.
The company's financial robustness is well-articulated in discussions by analysts like Matt Bryson from Wedbush and William Stein from Truist Securities. Bryson's cautious optimism is grounded on historical patterns where NVIDIA's stock may initially see modest movement post-earnings but gains momentum over time, driven by sustained AI demand. Conversely, Stein points out potential market corrections, emphasizing the company's high valuation and possible customer-side ordering issues. However, the consensus among analysts remains optimistic about NVIDIAs performance in the near and medium-term if sustained demand and technological superiority continue (source).
Significant corporate milestones, such as the Oracle XAI agreement powered by NVIDIA chips, reflect its substantial growth potential in the AI hardware domain. Victoria Green of G Squared Private Wealth contends that the stock could exceed $1,000, driven by corporate, individual, and sovereign investments in AI. This optimism is further echoed by Jim Cramer, who underscores the pivotal nature of NVIDIA's upcoming earnings report and its potential effects on broader market sentiments (source).
NVIDIA's market strategy also includes strategic investments in upcoming companies like SoundHound AI, reflecting its broader vision of driving and harnessing AI innovations across various sectors. These movements assert NVIDIA's role in not only leading technological advancements but also shaping the future AI landscape (source, May 18, 2024).
Despite NVIDIA's recent stock stagnation after a steep climb, upcoming earnings reports are seen as critical indicators of whether NVIDIA can sustain its growth momentum, especially amid increased capital expenditures by major cloud service providers like Microsoft, Alphabet, and Amazon. Their growing investments in AI infrastructure further buoy NVIDIA's market outlook (source).
Furthermore, NVIDIA's financial and technological health is also exemplified by its significant contributions to the burgeoning AI and data center market. Analysts project further substantial increases in revenue and earnings for the company in the forthcoming quarters, fueled by the robust enterprise investments in data infrastructure. These factors support NVIDIA's continued upward trajectory and market dominance, ensuring its relevance and superiority in the highly competitive AI hardware market (source).
In a strategic industry move, Microsoft has announced its intention to diversify its AI chip offerings by integrating AMDs components into its Azure cloud computing service. This reflects a broader industry trend towards diversification and reducing dependency on a single supplier. However, despite this rising competition, NVIDIA's established market presence and its continued innovation place it in a robust position to withstand these challenges and maintain its leadership (source).
As NVIDIA continues to expand its technological innovations with the upcoming launch of the Blackwell architecture and H200 GPU, the company reaffirms its commitment to leading the AI sector. The anticipated enhancements promise significantly improved performance, further fortifying NVIDIA's market leadership and sustaining investor and industry confidence (source, May 19, 2024).
In conclusion, NVIDIAs strategic market positioning, continuous technological advancements, and robust financial metrics underscore its formidable presence and potential for sustained growth in the AI sector. This is complemented by consistent earnings performance, strategic investments, and adaptive market strategies that collectively maintain and expand NVIDIA's leadership in a rapidly evolving technology landscape.
NVIDIA Corporation experienced significant volatility over the specified period, as indicated by the ARCH model analysis. The average volatility (omega) is relatively high, suggesting frequent large price movements. The alpha[1] parameter reveals that past squared returns have a meaningful impact on current volatility, indicating persistence in market fluctuations.
| Dep. Variable | asset_returns |
| R-squared | 0.000 |
| Adj. R-squared | 0.001 |
| Log-Likelihood | -3,264.21 |
| AIC | 6,532.42 |
| BIC | 6,542.69 |
| No. Observations | 1,256 |
| Df Residuals | 1,256 |
| Df Model | 0 |
To analyze the financial risk associated with a $10,000 investment in NVIDIA Corporation (NVDA) over a one-year period, we employ a combination of volatility modeling and machine learning predictions. This integrated approach offers a thorough examination of the stock's historical volatility and future returns.
Firstly, the volatility modeling method is applied to grasp the underlying nature of NVIDIA's stock fluctuations. By examining past stock price movements, we can estimate the conditional variance of returns, providing a comprehensive understanding of how volatile the stock has historically been and how this volatility might evolve over time. This enables investors to quantify the degree of uncertainty and risk associated with the stock's future price movements.
Subsequently, machine learning predictions are utilized to estimate the future returns of NVIDIA's stock. This model takes various financial indicators and historical data into account, learning complex, non-linear relationships that might be missed by traditional statistical methods. The machine learning model, in particular, utilizes a decision-tree-based technique to predict future stock returns, which helps in understanding the potential upward or downward movement of the stock.
Combining the insights from both volatility modeling and machine learning predictions, we can derive a robust risk assessment. Specifically, we calculate the Value at Risk (VaR) at a 95% confidence interval. The VaR provides a metric indicating the maximum potential loss over a given time frame, at a specific confidence level, due to market risks.
In this analysis, the VaR at a 95% confidence level for a $10,000 investment in NVIDIA over one year is calculated to be $470.68. This figure implies that there is a 95% probability that the loss from the investment will not exceed $470.68 over the year. Consequently, this integrates both the stock's inherent volatility and the expected returns, providing a clear and quantifiable measure of the potential financial risk involved in this equity investment.
Long Call Option Strategy
Analyzing NVIDIA Corporation (NVDA) long call options with a focus on maximizing profitability and managing risks can be intricate when considering various expiration dates and strike prices. Here, we'll consider five options with differing expiration dates and strike prices, presenting a comprehensive view that factors in "the Greeks" and other critical metrics.
Near-Term Recommendation: Expiration May 24, 2024
Option 1: Strike $370.00
- Delta: 0.9993670977 (Highly sensitive to stock price changes)
- Gamma: 0.0000079931 (Little impact from changes in delta)
- Vega: 0.2132596094 (Low sensitivity to volatility)
- Theta: -0.1200859384 (Substantial time decay)
- Rho: 0.0404588684 (Moderate sensitivity to interest rate changes)
- Premium: $537.50
- Profit: $35.7858
- ROI: 0.0665782326
In a near-term scenario, the $370.00 strike price option proves to be quite appealing. It exhibits a high delta, meaning the option will move almost in parallel with the stock. Although the time decay (theta) is considerable, the low gamma, vega, and moderate rho suggest lower sensitivity to fluctuations in volatility and interest rates. This option stands out for investors aiming for imminent profits from a slight upward move in stock price.
Short-Term Recommendation: Expiration May 31, 2024
Option 2: Strike $430.00
- Delta: 0.9990034968
- Gamma: 0.0000140034
- Vega: 0.3242704688
- Theta: -0.1515670549
- Rho: 0.0469919645
- Premium: $468.03
- Profit: $45.2558
- ROI: 0.096694229
For slightly longer than the near-term, the $430.00 strike price option expiring on May 31, 2024, offers an excellent balance of risk and reward. With a robust delta, the option remains closely tied to the underlying stock movements. This options vega indicates a more noticeable response to volatility changes, while theta still introduces significant decay. The potential profit and strong ROI make it a viable choice for traders looking for rapid returns.
Medium-Term Recommendation: Expiration June 21, 2024
Option 3: Strike $350.00
- Delta: 0.9994484065
- Gamma: 0.0000067027
- Vega: 0.1877252257
- Theta: -0.1119115427
- Rho: 0.0382768921
- Premium: $543.67
- Profit: $49.6158
- ROI: 0.0912608752
At a medium-term outlook, the $350.00 strike price expiring on June 21, 2024, is recommended. Featuring almost absolute delta and minimal impact from both gamma and vega, this option is highly correlated with NVDA's stock price movements. The moderate theta reflects a lesser time decay compared to nearer-term options. The ROI coupled with the significant profit potential makes this option attractive.
Longer-Term Recommendation: Expiration August 16, 2024
Option 4: Strike $390.00
- Delta: 0.9869872576
- Gamma: 0.0000574898
- Vega: 8.1421431757
- Theta: -0.1567893628
- Rho: 0.1329794564
- Premium: $428.15
- Profit: $67.1358
- ROI: 0.1578695123
Shifting to a longer-term perspective, the $390.00 strike price expiring on August 16, 2024, stands out. This option offers a diverse set of favorable traits, including a high delta and substantial vega, rendering it highly responsive to volatility changes which could occur in the more distant future. The theta is relatively high, indicating that the option will be affected by time decay, but the potential for a significant profit and a robust ROI supports this recommendation.
Long-Term Recommendation: Expiration December 20, 2024
Option 5: Strike $370.00
- Delta: 0.9741325609
- Gamma: 0.0000425921
- Vega: 11.876987234
- Theta: -0.1736502367
- Rho: 0.1527650989
- Premium: $670.91
- Profit: $129.45
- ROI: 0.1928243793
For those willing to hold their positions longer, the $370.00 strike price expiring on December 20, 2024, is optimal. Reiterating a high delta and strong vega, this option may profit significantly from longer-term strategic movements in NVDA's stock price. The theta is quite high, but the ROI paired with the potential profit makes it an exceptional choice for investors eyeing significant gains amidst long-term market trends.
Risk and Reward Quantification
Each option analyzed offers differing levels of risk and potential reward. Nearer-term options like those expiring in May 2024 ($370.00 strike) involve less capital but could benefit from immediate stock price movements. Short-to-medium-term options ($430.00 and $350.00 strikes expiring in May and June, respectively) balance rapid returns with modest risk. Longer-term options ($390.00 strike expiring August and $370.00 expiring December 2024) serve investors wagering on longer-term stock upticks, offering higher sensitivity to volatility changes and larger potential profit.
Each selection reflects differing risk appetites and market outlooks, ensuring investors can align their strategies with the best possible options for maximizing profitability while managing inherent risks in the options trading landscape.
Short Call Option Strategy
Long Put Option Strategy
Analyzing the given data for long put options on NVIDIA Corporation (NVDA), we can identify several potentially profitable options based on their strike prices and expiration dates. The metrics provided, such as the delta, gamma, vega, theta, rho, premium, ROI, and profit, offer a comprehensive view of the risk and reward scenario for each option. Let's delve into the five choices spread across different expiration dates and highlight the most profitable ones:
Near-Term Option: May 24, 2024, with a Strike Price of $1290
This option boasts a high profit of $9.5542 with an ROI of 2.83372879%. With a delta of -0.9623, the option is highly sensitive to changes in the underlying stock price. The relatively high gamma of 0.000499 indicates the potential for significant changes in delta with underlying price movements. This option features a strong vega of 7.9539, suggesting that it's well-placed to benefit from increases in volatility. However, the theta value of -1.5391 implies a high time decay, which could erode potential profits if the underlying stock does not move as expected within the short time frame.
Risk and Reward: - Reward: Potential profit of $9.5542. - Risk: High time decay and a significant impact from daily price movements due to high delta and gamma.
Short-Term Option: May 31, 2024, with a Strike Price of $1400
With an impressive profit of $14.0842 and an ROI of 3.18193525%, this option appears highly attractive. The delta stands at -0.9485, making it sensitive to underlying price changes. The gamma value of 0.0004832 indicates some volatility in delta, while the vega of 16.9609 shows a strong reaction to volatility changes. The theta of -0.8863 indicates moderate time decay, which is an important consideration given the option's expiration timeline.
Risk and Reward: - Reward: High potential profit and robust sensitivity to volatility. - Risk: Moderate time decay and sensitivity to short-term price fluctuations.
Medium-Term Option: June 21, 2024, with a Strike Price of $1470
This medium-term option generates a notable profit of $11.5642 with an ROI of 2.2448219%. A delta value of -0.9402 reflects high sensitivity to the underlying stock, while a high gamma value of 0.0004732 indicates potential volatility. The vega of 32.5454 is particularly significant, highlighting substantial responsiveness to changes in volatility, and a theta value of -0.2956 suggests moderate time decay over the medium term.
Risk and Reward: - Reward: Reasonable balance between potential profit and exposure to volatility. - Risk: Moderate time decay and high sensitivity to price changes.
Long-Term Option: August 16, 2024, with a Strike Price of $1450
This option offers a profit of $7.1642 and an ROI of 1.43413072%. With a delta of -0.9292 and a gamma of 0.0005356, this option is moderately sensitive to changes in the underlying stock price. The high vega of 61.468 highlights its advantageous position in a volatile market. The low theta of -0.0282 implies less aggressive time decay, making it attractive for holding over a longer period.
Risk and Reward: - Reward: Potential profit with substantial exposure to volatility changes and low time decay. - Risk: Moderate underlying stock price sensitivity and lengthened time horizon.
Extended-Term Option: March 21, 2025, with a Strike Price of $1810
This extended-term option projects a high profit of $10.3642 with an ROI of 1.21027617%. With a delta of -0.6271 and a gamma of 0.0004825, this option is less sensitive to immediate price changes, allowing for more strategic long-term positioning. The incredibly high vega of 319.9195 underscores its strong reactivity to changes in volatility. However, a rather steep theta of -0.3011 suggests that the option will incur notable time decay if the underlying stock does not move in the anticipated direction.
Risk and Reward: - Reward: High potential profit complemented by significant exposure to volatility. - Risk: Steep time decay and lesser immediate sensitivity to stock price movements.
Summary of Choices
- Near-Term Option (May 24, 2024, Strike Price $1290): High profit and ROI, suitable for rapid stock movements.
- Short-Term Option (May 31, 2024, Strike Price $1400): Very high profit with strong sensitivity to volatility, moderate time decay.
- Medium-Term Option (June 21, 2024, Strike Price $1470): Balanced profit with exposure to volatility and moderate time decay.
- Long-Term Option (August 16, 2024, Strike Price $1450): Good profit, low time decay, high volatility sensitivity.
- Extended-Term Option (March 21, 2025, Strike Price $1810): High long-term profit with high volatility reactivity, higher time decay.
Each option carries its specific risk and reward profile, making them suitable for different trading strategies and time horizons. The most profitable options identified provide compelling opportunities for traders to capitalize on stock price movements and volatility in NVIDIA Corporation.
Short Put Option Strategy
Vertical Bear Put Spread Option Strategy
Vertical Bull Put Spread Option Strategy
Vertical Bear Call Spread Option Strategy
Vertical Bull Call Spread Option Strategy
Spread Option Strategy
Calendar Spread Option Strategy #1
Calendar Spread Option Strategy #2
Similar Companies in Semiconductors:
Report: Intel Corporation (INTC), Intel Corporation (INTC), Report: Taiwan Semiconductor Manufacturing Company Limited (TSM), Taiwan Semiconductor Manufacturing Company Limited (TSM), Report: Marvell Technology, Inc. (MRVL), Marvell Technology, Inc. (MRVL), Report: Micron Technology, Inc. (MU), Micron Technology, Inc. (MU), Report: Advanced Micro Devices, Inc. (AMD), Advanced Micro Devices, Inc. (AMD), Report: Broadcom Inc. (AVGO), Broadcom Inc. (AVGO), Report: Qualcomm Incorporated (QCOM), Qualcomm Incorporated (QCOM)
https://www.youtube.com/watch?v=PehVr4M26F0
https://www.youtube.com/watch?v=fA8OCnwLnw0
https://www.youtube.com/watch?v=Kxr3c3ZHlAM
https://www.youtube.com/watch?v=7tk8MLvnj1E
https://www.cnbc.com/2024/05/17/jim-cramers-week-ahead-earnings-from-nvidia-target-macys.html
https://www.fool.com/investing/2024/05/18/2-millionaire-maker-ai-stocks/
https://www.fool.com/investing/2024/05/18/3-top-artificial-intelligence-stocks-to-buy-in-may/
https://www.fool.com/investing/2024/05/18/better-ai-stock-intel-vs-nvidia/
https://www.fool.com/investing/2024/05/19/why-is-nvidias-stock-price-so-high/
https://www.fool.com/investing/2024/05/19/buy-nvidia-stock-artificial-intelligence-ai/
https://www.fool.com/investing/2024/05/19/prediction-this-will-be-nvidias-next-big-announcem/
https://www.fool.com/investing/2024/05/19/nvidia-stock-apple-microsoft-valuable-company/
https://www.fool.com/investing/2024/05/19/3-top-tech-stocks-to-buy-in-may/
https://finance.yahoo.com/m/d1fe7831-9366-3e20-9e6c-889910836991/microsoft-delivers-an-ai-blow.html
https://www.sec.gov/Archives/edgar/data/1045810/000104581023000227/nvda-20231029.htm
Copyright © 2024 Tiny Computers (email@tinycomputers.io)
Report ID: fV9YWH
Cost: $0.59744
https://reports.tinycomputers.io/NVDA/NVDA-2024-05-19.html Home