Truist Financial Corporation (ticker: TFC)
2024-02-16
 Truist Financial Corporation (Ticker: TFC) stands as a significant entity in the banking sector, resulting from the merger between BB&T Corporation and SunTrust Banks on December 6, 2019. Headquartered in Charlotte, North Carolina, this organization prides itself on offering a broad range of banking, investment, and insurance services to its clients, spread across both personal and business domains. Truist is characterized by its extensive network that includes thousands of branches and ATMs, primarily located in the Southeast and Mid-Atlantic United States. The merger aimed at creating a more robust and competitive financial institution capable of delivering enhanced services and value to its customers while also striving to achieve greater operational efficiencies and a stronger market presence. With assets totaling in the hundreds of billions, Truist Financial Corporation seeks to leverage its scale, comprehensive service offerings, and innovative technology to meet the evolving needs of its clients and stakeholders in the dynamic financial landscape.
| Full Time Employees | 50,905 | CEO Total Pay | $6,842,294 | COO Total Pay | $3,871,910 |
| CFO Total Pay | $1,903,887 | Chief Risk Officer Total Pay | $5,282,135 | Chief Consumer and Small Business Banking Officer Total Pay | $3,823,930 |
| Previous Close | $35.41 | Open | $35.67 | Market Day Low | $35.50 |
| Market Day High | $36.51 | Dividend Rate | $2.08 | Dividend Yield | 5.87% |
| Payout Ratio | 52.26% | Five Year Avg Dividend Yield | 4.22 | Beta | 1.091 |
| Volume | 8,575,143 | Average Volume | 9,735,373 | Average Volume 10 Days | 11,044,290 |
| Market Cap | $48,454,778,880 | 52 Week Low | $25.56 | 52 Week High | $48.53 |
| Price to Sales Trailing 12 Months | 2.28 | Enterprise Value | $80,444,841,984 | Profit Margins | -5.13% |
| Shares Outstanding | 1,333,740,032 | Shares Short | 14,699,458 | Shares Percent Shares Out | 1.1% |
| Held Percent Insiders | 0.285% | Held Percent Institutions | 73.185% | Book Value | $39.309 |
| Price To Book | 0.924 | Net Income To Common | -$1,452,000,000 | Trailing EPS | -$1.09 |
| Forward EPS | $3.95 | Last Fiscal Year End | 1703980800 | Total Cash | $37,354,000,384 |
| Total Debt | $63,745,998,848 | Total Revenue | $21,280,999,424 | Revenue Per Share | 15.977 |
| Sharpe Ratio | -0.3786914073116108 | Sortino Ratio | -5.519173534116584 |
| Treynor Ratio | -0.08546287528152015 | Calmar Ratio | -0.41430854908373854 |
Analyzing the performance of TFC using a comprehensive array of financial, fundamental, and technical indicators provides a multi-faceted view of the stock's prospective trajectory. The risk-adjusted return metrics, such as the Sharpe, Sortino, Treynor, and Calmar ratios, present an initially challenging outlook. Each of these ratios offers insight into the relationship between TFC's expected return and the risk investors assume. The negative Sharpe and Sortino ratios suggest that the stock has underperformed relative to the risk-free rate over the past year, indicating that any returns have not adequately compensated for the risk undertaken. The Treynor Ratio further emphasizes this by showcasing a low return on beta, implying the market risk cannot justify the performance. Likewise, the Calmar Ratio, indicating the return per unit of downturn risk, also paints a cautious picture.
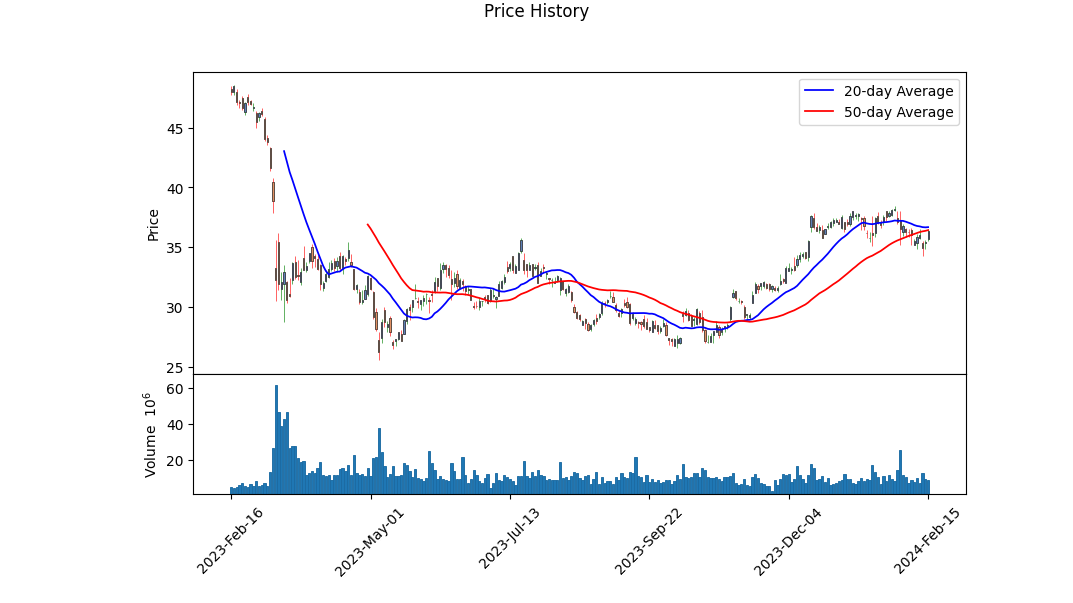
From a technical standpoint, recent trends detailed from the open-high-low-close (OHLC) data with technical indicators like OBV (On-Balance Volume) and MACD (Moving Average Convergence Divergence) histogram values inform about the stock's momentum and volume-driven trend directions. The OBV shows significant increases in volume accompanying price movements, suggesting a growing investor interest or preparation for significant price movements. Although the MACD histogram values are negative, which might imply bearish momentum, its decreasing negative value towards the report's end could signal a weakening of this downward trend.
The fundamental analysis, encompassing revenue growth, return on equity, and operating margins, alongside balance sheet strength, adds another layer to the prognostication. The fundamentals, such as a negative return on equity and a decrease in revenue growth, might initially seem discouraging. However, substantial assets, an ambitious capital expenditure attributed to bolstering operational capacity, and managing debts present a mixed but stabilizing financial position.
The balance sheet reflects a robust total asset base against its liabilities, a pivotal aspect for long-term solvency. A keen eye would notice the potential for leverage on this strong asset base to boost future earnings. The cash flow statements, underscoring strong free cash flows amidst capital expenditures and debt restructuring, fortify TFC's ability to invest in growth initiatives and service its debts efficiently.
Investor sentiment, fueled by analyst expectations, anticipates a rebound with predicted improvements in earnings and revenue in the coming year. While the current year might reflect a contraction, the outlook for next year and beyond, based on growth estimates, posits a recuperation and potential expansion phase, aligning with broader industry and sectoral forecasts.
Considering the compilation of technical, fundamental, and risk-adjusted performance data, TFC presents an intricate investment scenario. In the immediate months, investors might tread cautiously, influenced by recent underperformance in risk-adjusted returns and mixed fundamentals. However, a longer-term perspective, bolstered by analyst optimism and strategic financial maneuvers underscored in the cash flow and balance sheets, hints at a more favorable trajectory. The decisive factor will hinge on TFC's execution of growth strategies against the backdrop of market and economic variables. Investors are advised to weigh these multifaceted dynamics, considering both the inherent risks and potential for a recovery-led upside.
In evaluating the financial health and profitability of Truist Financial Corporation (TFC) through Joel Greenblatt's "magic formula" investing perspective, as outlined in "The Little Book That Still Beats the Market," two critical measures warrant our attention: the Return on Capital (ROC) and the Earnings Yield. For TFC, the ROC stands at approximately 1.88%. This metric, though seemingly modest, is pivotal in assessing how effectively the company utilizes its capital to generate profits, a vital sign of operational efficiency. More compelling, however, is TFC's Earnings Yield, which is calculated to be roughly 12.80%. This figure is quite significant and favorable, as it indicates the proportion of each dollar invested in the stock that was earned by the company, highlighting TFC's potential for yielding higher returns to investors. This substantial earnings yield, in contrast with its ROC, suggests that while the effective use of capital for generating profits may have room for improvement, the overall return potential for investors is promising, making TFC an attractive option for those adhering to Greenblatt's investment philosophy.
| Statistic Name | Statistic Value |
| R-squared | 0.452 |
| Adjusted R-squared | 0.451 |
| F-statistic | 1034 |
| Prob (F-statistic) | 4.94e-166 |
| Log-Likelihood | -2606.1 |
| AIC | 5216 |
| BIC | 5226 |
| coef (const) | -0.0573 |
| coef (0) | 1.3259 |
| std err (const) | 0.054 |
| std err (0) | 0.041 |
| t (const) | -1.055 |
| t (0) | 32.163 |
| P>|t| (const) | 0.292 |
| P>|t| (0) | 0.000 |
| [0.025 | 1.245 |
| 0.975] | 1.407 |
| Omnibus | 226.397 |
| Prob(Omnibus) | 0.000 |
| Jarque-Bera (JB) | 3204.982 |
| Prob(JB) | 0.00 |
| Skew | -0.373 |
| Kurtosis | 10.787 |
| Cond. No. | 1.32 |
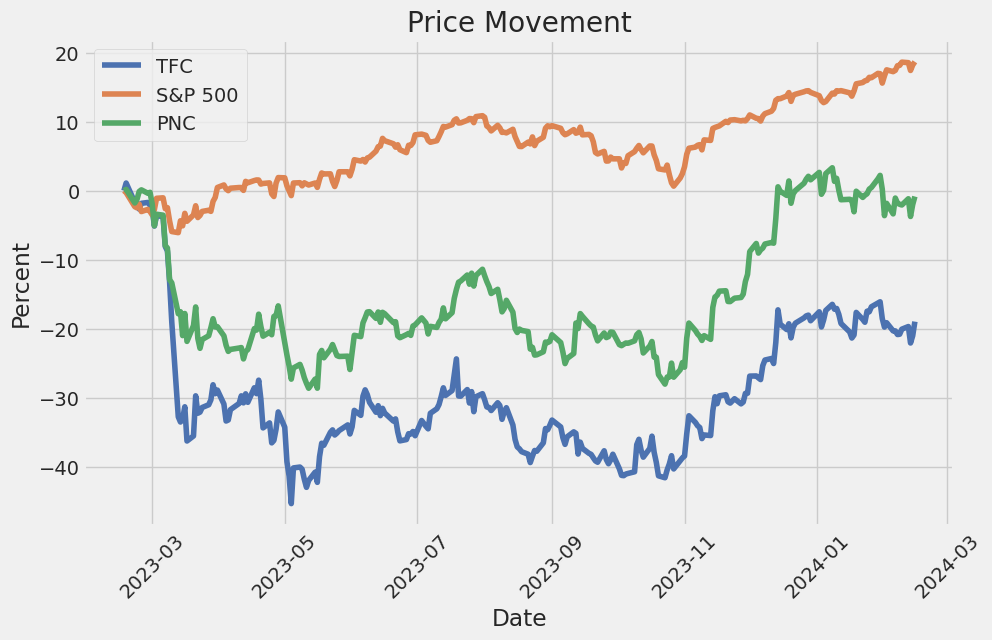
The relationship between TFC (presumably a specific financial asset) and SPY (an ETF that aims to track the S&P 500 and thus represents the performance of the overall market) is quantified through this linear regression model. The coefficient (beta) of 1.3259 suggests that for every unit increase in SPY, TFC is expected to increase by approximately 1.326 units, holding all else constant. This positive relationship indicates that TFC tends to move in the same direction as the overall market but at a magnified rate, given that the beta value is greater than 1. The obtained R-squared value of 0.452 presents that about 45.2% of the variability in TFC can be explained by the movements in SPY, which suggests a moderate level of correlation but also indicates that there are other significant factors affecting TFC's performance that are not captured by this model.
Further, the model's alpha, represented by the coefficient (const) of -0.0573, attempts to quantify the amount TFC would return over a period when SPY returns are zero, theoretically representing the asset-specific return independent of market influences. However, the statistical significance of the alpha term is questioned by its P-value (0.292), indicating that this alpha is not significantly different from zero at common significance levels, thus suggesting that after adjusting for market movements, TFC's performance does not significantly deviate from the market in this period. Additionally, despite the model's utility in explaining certain aspects of TFC's movements relative to SPY, the significant Omnibus and Jarque-Bera test results (indicative of non-normality) highlight potential limitations in the model's ability to capture all nuances of the relationship accurately.
Truist Financial Corporation reported its fourth quarter 2023 earnings with solid results despite facing several discrete challenges, such as a $6.1 billion goodwill impairment charge and a special FDIC assessment, among other factors. Chairman and CEO Bill Rogers underscored Truist's commitment to its purpose-driven mission of inspiring and building better lives and communities, highlighting significant contributions in affordable housing, job creation, charitable giving, and support for small businesses throughout the year. The company's adjusted net income stood at $1.1 billion or $0.81 per share, excluding the impacts of the impairment charge and other specific items.
During the earnings call, CFO Mike Maguire detailed the financial performance, explaining the composition of the goodwill impairment charge as a result of the annual impairment test, emphasizing its non-cash nature and lack of impact on liquidity, regulatory capital ratios, or the ability to serve clients. Total revenue saw a slight increase thanks to a modest decline in net interest income, and the company reported a progressive reduction in expenses attributed to ongoing organizational simplification and cost-saving plans. Truist also demonstrated prudent management of asset quality, with non-performing loans declining and continued careful loan loss reserve building amidst an uncertain economic environment.
Truist's strategic focus in the past quarter has been on organizational simplification, aiming for increased efficiency and effective capital allocation to drive revenue opportunities in 2024 and beyond. The company made significant progress by reducing headcount, consolidating commercial real estate units, and enhancing digital engagement with its clients. These efforts are poised to result in improved expense trends and a more streamlined operational structure going forward. The transformation endeavors undertaken during 2023, including leadership realignment and the launch of a new operating council, reflect Truists dedication to its long-term growth and efficiency goals.
Looking ahead to 2024, Truist outlined its continued focus on deepening relationships with core clients, leveraging efficiency gains for market share expansion, and further enhancing digital experiences. The financial guidance anticipates revenues to potentially decline by 1-3%, with an overall strategic intent to maintain a disciplined approach to expense management and asset quality. Truist's leadership remains optimistic about the potential for growth and improved performance through ongoing strategic initiatives and a commitment to its core banking, investment, and insurance services, aiming to build capital and strengthen the company's market position despite external challenges.
Truist Financial Corporation, in its SEC 10-Q filing dated September 30, 2023, presents key financial metrics and operational highlights, signaling the company's performance and strategic directions within the quarter. With an emphasis on financial health, regulatory compliance, and future outlooks, the filing addresses critical components that affirm Truist's ongoing business strategies and market positioning.
The document outlines Truist's financial condition, including assets, liabilities, and shareholders' equity, pinpointing changes from previous periods. It denotes a detailed account of the balance sheet items, such as loans and leases, investments, and deposit figures, providing a comprehensive view of the company's financial stature. Notably, it includes specifics about the allowance for credit losses, a critical indicator of the company's forecasted credit risk, reflecting on the robustness of their risk management practices.
Operating segments of Truist, namely Corporate and Commercial Banking (C&CB), Consumer Banking and Wealth (CB&W), and Insurance Holdings (IH), are thoroughly reviewed, showcasing revenue streams, operational challenges, and achievements within these units. This segmental analysis hints at the diversified business model Truist employs, navigating through various market conditions and leveraging opportunities across different financial services domains.
Regulatory and compliance matters occupy a significant section of the filing emphasizing Truist's commitment to adhering to the evolving financial regulatory landscape. This includes discussions on capital adequacy, liquidity management, and adherence to comprehensive capital analysis and review (CCAR) requirements. The document elaborates on the potential impact of regulatory changes on Truist's operations, emphasizing proactive strategies in place to mitigate risks associated with regulatory compliance.
The forward-looking statements section of the filing unveils Truist's anticipations on future economic conditions, market competitiveness, and regulatory environments. It candidly addresses the uncertainties and risks inherent in forecasting, providing stakeholders with a balanced view of optimism and caution. This outlines the strategic foresight embedded in Truist's planning and execution frameworks, preparing for industry changes, economic shifts, and unforeseen challenges.
Overall, the SEC 10-Q filing by Truist Financial Corporation for the quarter ended September 30, 2023, delivers a detailed narration of the company's financial health, strategic maneuvers, and future outlooks. By dissecting financial numbers, operational segments, regulatory frameworks, and market expectations, the document furnishes a holistic view of Truist's endeavors to sustain profitability, ensure compliance, and foster growth amidst a dynamically changing financial landscape.
In the shifting sands of the financial industry, Truist Financial Corporation has remained steadfast, navigating through economic uncertainty and market fluctuations with a keener focus on strategic growth and operational efficiency. The company's journey through recent quarters underscores not only its resilience but also its commitment to embracing challenges as avenues for innovation and improvement. Amidst a backdrop of cooling interest in regional banking due to changes in Treasury prices and loan rates, Truist has continued to underscore the value of agility, strategic acquisition, and customer-centric innovation.
A notable aspect of Truist's strategy revolves around its response to the evolving landscape of customer engagement and digital banking demands. The bank's move towards closing a portion of its branch network as a cost-saving measure reflects an industry-wide shift towards digital transformation. This adaptation is in line with changing consumer behaviors that increasingly favor online and mobile banking platforms over traditional branch visits. Such strategic closures, aimed at streamlining operations, are expected to bolster the bank's efficiency and enhance its capacity to invest in digital innovation, ultimately contributing to a more robust and versatile banking experience for its customers.
Moreover, Truist's recognition in the JUST Capital and CNBCs 2024 Rankings of America's Most JUST Companies, achieving the 14th position, is a testament to its commitment to corporate responsibility and sustainability. This prestigious ranking, driven by public opinion on what makes a just company, underscores Truist's adherence to principles of fairness, integrity, and community support. It is a reflection of the corporations concerted efforts to not only deliver financial services but also positively impact society. This aligns with Truist's broader mission to inspire and build better lives and communities, an ethos that permeates its operations and strategic objectives.
Financial performance and investor communication remain central to Truist's operational ethos. The nuanced interpretation of the bank's financial health, particularly in light of a net loss reported in the second quarter, as detailed in an analysis by Seeking Alpha, offers a compelling narrative. The discussion points to strategic decisions and one-time charges as pivotal factors affecting the quarterly results. However, a deeper dive reveals a strong underlying performance and strategic investments in areas like digital innovation, which are critical for long-term growth and competitiveness in the banking sector.
Furthermore, the banks inclusion in Bloomberg's Dividend Focus List for 2024 highlights its solid financial outlook and the reliability of its dividend payments. This acknowledgment serves as a beacon for investors prioritizing stable returns amidst economic uncertainties. Truist's dedication to returning value to its shareholders, coupled with a strategic approach to financial management and risk mitigation, positions the bank favorably among dividend-focused investors.
Adding a layer of complexity to Truists operational landscape are the broader industry trends and challenges. The recent report highlighting Diamond Hill Capital's reduction in Truist shares reflects a dynamic investment environment, where strategic portfolio reallocations are commonplace. This development, along with the ongoing transformations within the banking sectorspanning regulatory pressures, technological advancements, and the imperative for operational efficiencyarticulates the multifaceted challenges and opportunities Truist faces.
Truist's proactive engagement with these challenges, from regulatory compliance to embracing digital banking, illustrates a strategic approach that blends prudence with innovation. The bank's efforts to expand its digital offerings, enhance customer service, and streamline operations through branch network adjustments are indicative of a forward-looking stance that prioritizes resilience and long-term value creation.
The banks upcoming participation in the BofA Securities Financial Services Conference further signifies Truist's active role in the dialogue around the future of financial services. This engagement underscores the corporations openness to share its strategies, performance, and outlook with the wider financial community, fostering transparency and investor confidence.
In conclusion, Truist Financial Corporation's multifaceted strategy, characterized by operational efficiency, strategic growth through acquisitions, digital transformation, and unwavering commitment to corporate responsibility, paints a picture of a bank that is not only navigating the complexities of the present but is also firmly focused on shaping the future of banking. Amidst an array of challenges and opportunities, Truist stands out through its adaptability, strategic foresight, and a deep-rooted commitment to contributing positively to the communities it serves, securing its place as a dynamic player in the regional banking sector.
The volatility of Truist Financial Corporation (TFC) between February 19, 2019, and February 15, 2024, demonstrates a significant level of fluctuation in its asset returns, as indicated by the analysis using an ARCH model. The omega coefficient, representing the long-term average volatility, is quite high at 3.5932, indicating that TFC's asset returns have been subject to substantial variation over this period. Additionally, the alpha coefficient of 0.4566 showcases the impact of previous period's returns on the current volatility, further confirming the unpredictable nature of TFC's financial performance.
| Statistic Name | Statistic Value |
|---|---|
| Mean Model | Zero Mean |
| Vol Model | ARCH |
| Log-Likelihood | -2826.29 |
| AIC | 5656.58 |
| BIC | 5666.85 |
| No. Observations | 1257 |
| omega | 3.5932 |
| alpha[1] | 0.4566 |
In analyzing the financial risk associated with a $10,000 investment in Truist Financial Corporation (TFC) over a year, we employ a combination of volatility modeling and machine learning predictions. This approach complements the comprehensive understanding of TFC's stock fluctuation patterns with the predictive insights on future returns, offering a holistic view of potential investment risks.
The application of volatility modeling, specifically designed to understand and quantify the variability in Truist Financial Corporation's stock prices, plays a pivotal role in gauging the extent and pace of price changes. By modeling the conditional variance of the stock's returns, we obtain a dynamic measure of risk that adapts to changes in market behavior over time. This methodological approach is particularly well-suited for assessing financial instruments like TFC's stock, where volatility is a significant component of investor risk.
Integrating machine learning predictions into our analysis further enriches our risk assessment framework. The machine learning model, trained on historical data, forecasts future stock returns based on patterns identified from past performance. This predictive capability is invaluable, as it not only corroborates the findings from the volatility modeling but also provides an expectation of future performance under varying conditions. The utilization of a machine learning algorithm that specializes in capturing the non-linear relationships between variables enhances the robustness and accuracy of our predictions.
The key metric derived from our integrated analysis is the Value at Risk (VaR) at a 95% confidence interval, which stands at $452.36 for a $10,000 investment in TFC over a one-year period. VaR is a widely recognized risk measure that estimates the maximum expected loss over a specific timeframe, given normal market conditions. The calculated VaR of $452.36 signifies that, with 95% confidence, the maximum potential loss from the investment in TFC would not exceed this amount under normal market conditions over the specified period. This figure is crucial for investors, as it provides a quantifiable risk parameter that assists in making informed decisions based on personal risk tolerance and investment objectives.
Our comprehensive analysis, combining the insights from volatility modeling and machine learning predictions, presents a detailed picture of the potential risks in equity investment in Truist Financial Corporation. Through the calculated VaR, investors are equipped with a critical risk measurement that aids in the evaluation of whether the potential return justifies the risk of investment in TFC stocks. This nuanced understanding of both the variability in stock performance and the predictive future returns underpins a more informed investment strategy.
Analyzing the options chain for Truist Financial Corporation (TFC) reveals several interesting insights, especially when focusing on call options and considering the objective of securing a stock price target 5% higher than its current level. We assess these options based on their Greek parametersdelta, gamma, vega, theta, and rhoand their profitability metrics like return on investment (ROI) and profit.
High Delta Options for Near-Term Gains Options with a high delta are closer to being in-the-money (ITM) or are already ITM, meaning they have a higher chance of being profitable if the stock price moves in the anticipated direction. For instance, the option with a strike price of 15.0 expiring on 2024-03-15 has a very high delta of 0.9528, indicating that for every $1 move in the stock, the option's price is expected to move approximately $0.95. This option, while expensive (premium of 21.19), offers a more direct correlation to the stock price movement and less time for theta (time decay) to erode its value, making it a strong candidate for near-term bullish bets.
High Gamma and Vega Options for Volatility Plays Options with high gamma and vega values are particularly interesting for traders anticipating significant volatility. The option with a strike of 35.0 expiring on 2024-02-23 has a gamma of 0.1582 and vega of 1.4348, suggesting it will be very responsive to changes in the stocks volatility and price movement. With a relatively low premium of 1.36, this option could provide a high return if the stock moves favorably and volatility increases.
Optimal Theta and ROI Considerations Theta measures the rate at which an options value declines over time, assuming all other variables remain constant. Options with lower (less negative) theta values are preferable as they are less affected by time decay. An interesting option in this regard is the strike 34.5 expiring on 2024-03-01, with a theta of -0.0317 and a significant ROI of 1.9617. This suggests it has a potent mix of being relatively resistant to time decay while offering high profitability potential.
Striking a Balance with Rho Rho measures an option's sensitivity to changes in the risk-free interest rate, which might not be the primary concern in the short term but could influence longer-dated options. For those considering longer time horizons, the option with a strike of 27.5 expiring on 2024-09-20 demonstrates a solid rho value of 10.6685 alongside a favorable delta of 0.7234, indicating good potential for appreciation with rising interest rates.
Conclusion For traders targeting a stock price boost of 5% in the near term, options with high delta values such as the one expiring on 2024-03-15 with a strike price of 15.0 offer strong potential for direct gains in line with stock movements. For those speculating on volatility, options with high gamma and vega like the one with a strike of 35.0 expiring on 2024-02-23 can provide significant leverage. Meanwhile, options balancing low theta with high ROI metrics, as seen with the strike 34.5 option expiring on 2024-03-01, are appealing for their blend of profitability and resistance to time decay. Lastly, for a longer investment horizon, considering rho becomes crucial, making the option with a strike of 27.5 expiring on 2024-09-20 a compelling choice. It's paramount, however, to always consider the interplay between these Greeks and the market context to refine the optimal strategy.
Similar Companies in BanksRegional:
Report: The PNC Financial Services Group, Inc. (PNC), The PNC Financial Services Group, Inc. (PNC), KeyCorp (KEY), Western Alliance Bancorporation (WAL), Zions Bancorporation, National Association (ZION), U.S. Bancorp (USB), M&T Bank Corporation (MTB), Report: Fifth Third Bancorp (FITB), Fifth Third Bancorp (FITB), Report: Huntington Bancshares Incorporated (HBAN), Huntington Bancshares Incorporated (HBAN), Comerica Incorporated (CMA), Report: Regions Financial Corporation (RF), Regions Financial Corporation (RF), Report: Bank of America Corporation (BAC), Bank of America Corporation (BAC), JPMorgan Chase & Co. (JPM), Report: Wells Fargo & Company (WFC), Wells Fargo & Company (WFC), Report: Citigroup Inc. (C), Citigroup Inc. (C), Capital One Financial Corporation (COF)
https://www.youtube.com/watch?v=FH-kQ0swxHY
https://seekingalpha.com/article/4664463-truist-financial-dont-let-the-net-loss-scare-you
https://seekingalpha.com/article/4666693-47-stocks-from-bloomberg-dividend-focus-for-2024
https://finance.yahoo.com/news/truist-ranks-top-25-among-141500738.html
https://finance.yahoo.com/news/truist-financial-corp-sees-significant-190438233.html
https://finance.yahoo.com/news/might-not-great-idea-buy-195008592.html
https://finance.yahoo.com/news/truist-financial-corps-dividend-analysis-103332460.html
https://finance.yahoo.com/news/truist-speak-bofa-securities-financial-152200107.html
https://finance.yahoo.com/news/citigroup-c-pushed-fed-speed-143700288.html
https://finance.yahoo.com/news/griffon-paypal-highlighted-zacks-bull-132500626.html
https://finance.yahoo.com/news/truist-charitable-fund-names-17-141500455.html
https://www.sec.gov/Archives/edgar/data/92230/000009223023000084/tfc-20230930.htm
Copyright © 2024 Tiny Computers (email@tinycomputers.io)
Report ID: 71daDW
Cost: $0.66063
https://reports.tinycomputers.io/TFC/TFC-2024-02-16.html Home