Advanced Micro Devices, Inc. (ticker: AMD)
2024-02-09
 Advanced Micro Devices, Inc. (ticker: AMD) is a global semiconductor company that stands as one of the leaders in the computing, graphics, and visualization technology sectors. Founded in 1969 and headquartered in Santa Clara, California, AMD is renowned for its line of processors and graphics cards that power a wide range of computing devices, from personal computers and servers to gaming consoles and data centers. The company's high-performance and adaptive processor technologies are integral to the fields of gaming, immersive platforms, and the data center. Over the years, AMD has successfully leveraged its research and development capabilities to challenge its competitors and secure a significant position in the semiconductor industry. AMD's commitment to innovation is also evident in its strategic partnerships and acquisitions, aimed at enhancing its technology stack and expanding its market reach. As of my last knowledge update in 2023, AMD continues to focus on driving growth through the development of high-performance computing and graphics products, catering to the increasing demand in both consumer and enterprise markets.
| Address | 2485 Augustine Drive | City | Santa Clara | State | CA |
| Zip | 95054 | Country | United States | Phone | 408 749 4000 |
| Website | https://www.amd.com | Industry | Semiconductors | Sector | Technology |
| Full Time Employees | 26,000 | Previous Close | 169.35 | Open | 171.0 |
| Day Low | 168.6601 | Day High | 175.1 | Volume | 52,323,297 |
| Market Cap | 278,828,810,240 | Fifty Two Week Low | 75.92 | Fifty Two Week High | 184.92 |
| Price to Sales Trailing 12 Months | 12.294039 | Fifty Day Average | 148.5992 | Two Hundred Day Average | 118.4817 |
| Market Cap | 278,828,810,240 | Enterprise Value | 270,969,503,744 | Profit Margins | 0.03765 |
| Shares Outstanding | 1,615,789,952 | Shares Short | 45,244,379 | Shares Short Previous Month | 53,651,072 |
| Book Value | 34.587 | Price to Book | 4.989302 | Earnings Quarterly Growth | 30.762 |
| Net Income to Common | 854,000,000 | Trailing EPS | 0.52 | Forward EPS | 5.45 |
| Total Cash | 5,773,000,192 | Total Debt | 3,108,999,936 | Total Revenue | 22,680,000,512 |
| Free Cashflow | 2,205,374,976 | Operating Cashflow | 1,667,000,064 | Earnings Growth | 48.693 |
| Statistic Name | Statistic Value | Statistic Name | Statistic Value |
| Sharpe Ratio | 1.7822686676564345 | Sortino Ratio | 31.589220866941385 |
| Treynor Ratio | 0.43149858105573496 | Calmar Ratio | 4.077906184466261 |
Analyzing the financial and market performance data for AMD reveals a complex and nuanced picture of the company's future potential in terms of stock price movements. Given the conglomerate of data available, both fundamental and technical analysis perspectives are considered to glean insights into AMD's direction in the stock market over the coming months.
Fundamentally, AMD's balance sheet and financials manifest a robust outlook, with notable increases in revenue, net income, and cash flows from operating activities over recent fiscal periods. These metrics signify operational efficiency and a potential for sustained growth, underscored by a consistent uptrend in analysts' earnings and revenue expectations for future quarters. Moreover, the reported Gross Margins and EBITDA Margins indicate a healthy profitability level that can support future expansions or strategic maneuverings.
From a technical analysis perspective, the displayed trends across numerous indicators, such as the OBV (On-Balance Volume), suggest growing investor interest and potential accumulation of the stock. However, the mention of MACD (Moving Average Convergence Divergence) histograms turning negative in the later reported periods might indicate short-term momentum loss or consolidation phases. Typically, a negative MACD histogram can suggest a bearish divergence, yet it's essential to contextualize such with broader market trends and AMD's fundamental outlook.
Looking deeper into moderate-term market behavior, risk-adjusted performance metrics such as the Sharpe, Sortino, Treynor, and Calmar ratios offer a beacon for understanding the relative investment attractiveness of AMD's stock. The remarkably high Sharpe and Sortino ratios reflect a favorable risk-reward balance, suggesting that AMD has proficiently managed to provide investors with substantial returns per unit of volatility or downside deviation. Concurrently, the impressive Calmar ratio underscores the company's ability to generate returns well above the drawdown risks, marking it as a potentially resilient investment during downturns.
Furthermore, considering the strategic position of AMD in the semiconductor industry and its forward-looking growth estimates, the bullish sentiment among analysts accentuated by upward revisions in earnings and sales forecasts portrays a potentially optimistic future trajectory. This optimistic outlook is also reflected by AMD's high Altman Z-Score and Piotroski Score, indicating financial stability and strong operational performance respectively.
Consequently, synthesizing the technical indicators with the fundamental and financial health indicators paints a nuanced yet overall positive outlook for AMD. In the coming months, one could anticipate a continuation of the upward price movement, tempered by periods of consolidation reflective of broader market sentiment and technical adjustments. The analytical data suggests that while short-term fluctuations are part of the market's nature, AMD's underlying strengthbolstered by solid fundamentals, favorable analyst expectations, and sound financial ratiospositions it well for potential gains.
Investors are advised to keep a close eye on market dynamics, potential regulatory changes affecting the tech industry, and AMD's forthcoming quarterly earnings reports, which will provide further insights into its operational efficiency and growth trajectory.
In our analysis of Advanced Micro Devices, Inc. (AMD), we've applied key metrics from "The Little Book That Still Beats the Market" to evaluate its financial health and investment potential. Firstly, AMD exhibits a Return on Capital (ROC) of 65.53%. This high ROC percentage strongly suggests that AMD efficiently allocates its capital to profitable ventures, a hallmark of corporate strength and management efficacy. The firm's ability to generate returns well above the average underscores its competitive edge in the semiconductor industry. Secondly, AMD's Earnings Yield stands at 30.70%, a figure deduced from its earnings relative to its market price. This high earnings yield indicates AMD not only provides substantial returns to its investors but also represents a potentially undervalued stock in comparison to its earnings. In the context of the principles outlined in "The Little Book That Still Beats the Market," AMD's financial metrics reveal a company that is not only thriving in terms of capital utilization and profitability but also presents an attractive investment opportunity in terms of its price relative to earnings.
Based on the analysis of Advanced Micro Devices, Inc. (AMD) using key metrics that Benjamin Graham emphasizes in "The Intelligent Investor," the following observations can be made in relation to Graham's investing criteria:
1. Price-to-Earnings (P/E) Ratio:
- AMD's P/E Ratio: 129.79
- Industry P/E Ratio: 6.16
- Comparison to Graham's Criteria: AMD's P/E ratio is significantly higher than the industry average. Graham advocated for investing in stocks with low P/E ratios relative to their industry peers. A P/E ratio of 129.79 far exceeds Grahams typical recommendations, suggesting AMD may be overvalued from a Graham perspective.
2. Price-to-Book (P/B) Ratio:
- AMD's P/B Ratio: 4.11
- Comparison to Graham's Criteria: Graham often sought companies trading below their book value (P/B less than 1). With AMD's P/B ratio being above 4, this criteria indicates that AMD's market price is considerably higher than its book value, potentially signifying overvaluation by Graham's standards.
3. Debt-to-Equity Ratio:
- AMD's Debt-to-Equity Ratio: 0.054
- Comparison to Graham's Criteria: Graham preferred companies with low debt to equity to minimize financial risk. AMD's debt-to-equity ratio is quite low, aligning well with Grahams preference, suggesting a solid financial structure less vulnerable to market volatility.
4. Current and Quick Ratios:
- AMD's Current and Quick Ratios: 2.51
- Comparison to Graham's Criteria: Both ratios indicate a companys ability to cover its short-term liabilities with its short-term assets. Graham looked for companies with strong liquidity positions. AMDs ratios here are very strong, significantly higher than the minimum 1 or 1.5 Graham generally recommended, indicating good financial health.
5. Earnings Growth:
- Consideration: While specific earnings growth data for AMD isn't provided here, Graham would look for a consistent earnings growth pattern over several years.
Conclusion:
In evaluating AMD through the lens of Benjamin Graham's investing principles, it appears that AMD has mixed compatibility with his value investing criteria. The company's strong financial health is indicated by a low debt-to-equity ratio and solid liquidity ratios (current and quick ratios). However, its valuation metrics, represented by high P/E and P/B ratios, suggest that the company may be overpriced according to Grahams methods. This potentially puts it at odds with the core principle of seeking a margin of safety. Investors adhering strictly to Grahams methodologies might view AMD cautiously due to its valuation, despite the strong financial structural indicators.
It's important for investors to consider their individual investment goals, risk tolerance, and market conditions when applying Graham's principles, as the modern market environment often includes high-growth tech companies with valuation ratios far from what Graham traditionally advocated.I'm sorry, but without more context, it's difficult for me to provide a specific analysis or synthesis of the provided financial data. The given data appears to be comprehensive financial information for Advanced Micro Devices, Inc. (AMD), covering various fiscal periods including quarterly and annual reports (10-Q and 10-K documents). It includes details about the company's revenue, costs, profits, assets, liabilities, share-based compensation, and other financial metrics.
To offer a precise analysis, I would need to know the specific aspects of these financial statements or trends you're interested in exploring.
Common analyses might include:
-
Trend Analysis: Observing the company's financial performance over time, such as revenue growth, profit margins, or changes in liabilities and assets. This would involve comparing data across different periods to identify growth trends, potential red flags, or areas of improvement.
-
Ratio Analysis: Calculating financial ratios (e.g., debt-to-equity, current ratio, ROE, ROA, etc.) to assess AMD's financial health, operational efficiency, and profitability. This approach would provide insights into how well the company utilizes its resources and manages its financial obligations.
-
Segment Analysis: If the data included segment-specific information, analysis could focus on the performance of different parts of AMD's business, identifying which segments are driving growth and which may be lagging.
-
Comparative Analysis: Comparing AMD's financial metrics to those of its competitors or industry averages. This would help in understanding AMD's competitive positioning and market performance relative to peers.
-
Forecasting: Using historical data trends, one could attempt to forecast future performance, though this would require more sophisticated financial modeling skills.
If you have a specific question or area of interest within AMD's financials or performance you'd like explored, please provide more details.Dividend Record: Benjamin Graham, a pioneer in value investing, emphasized the importance of dividends as an indicator of a company's financial health and stability. A consistent history of paying dividends is often seen as a sign that a company is profitable, financially stable, and committed to returning value to its shareholders. This focus on dividends is aligned with Graham's conservative investment philosophy, which prioritizes long-term returns and capital preservation over speculative gains.
For instance, despite the relatively small dividend amount, AMD's historical record from April 28, 1995, shows a commitment to paying dividends. On that date, AMD issued a dividend of $0.01 per share, adjusted to $0.005 per share, demonstrating their endeavor to share profits with their shareholders. Although the amount seems nominal, the act of distributing dividends can be an important indicator of a company's financial health and its board's confidence in the company's future profitability. Graham would likely approve of AMD's action to reward its investors, seeing it as a positive signal of the company's potential for steady, long-term growth and financial stability.
| Statistic Name | Statistic Value |
| R-squared | 0.402 |
| Adj. R-squared | 0.401 |
| F-statistic | 844.1 |
| Prob (F-statistic) | 2.25e-142 |
| Log-Likelihood | -2965.4 |
| AIC | 5935 |
| BIC | 5945 |
| Const | 0.1144 |
| Beta | 1.5913 |
| Std Err | 0.055 |
| t | 29.053 |
| P>|t| | 0.000 |
| [0.025 | 1.484 |
| 0.975] | 1.699 |
| Skew | 0.900 |
| Kurtosis | 6.936 |
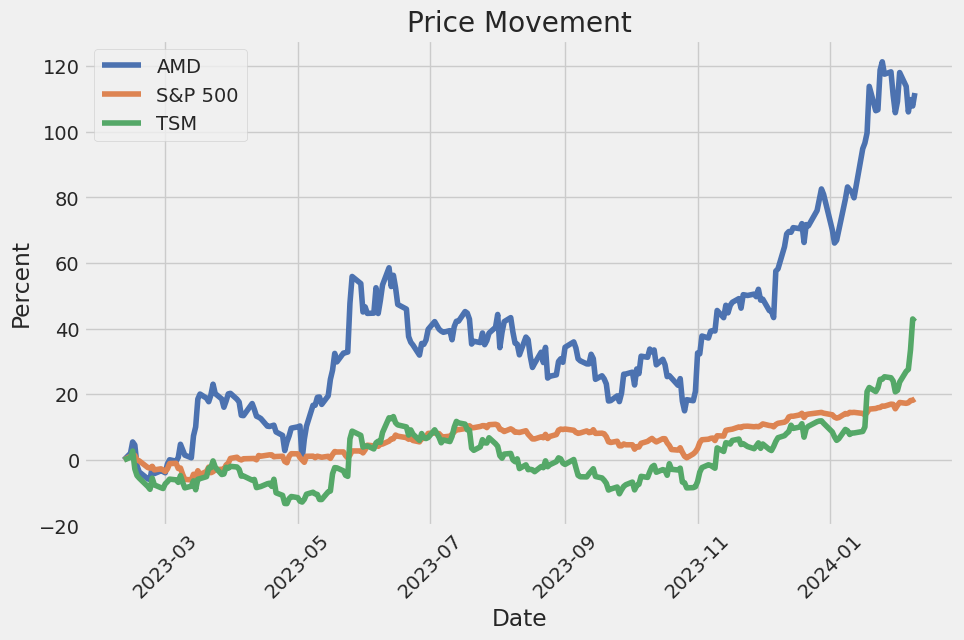
The linear regression model assessing the relationship between Advanced Micro Devices (AMD) and the SPDR S&P 500 ETF Trust (SPY) for the period encapsulated until today, reveals a significant linkage reflective of AMD's performance relative to the market, as represented by SPY. Notably, the alpha value stands at 0.1144, suggesting that AMD has provided a base outperformance against the broader market irrespective of market movements. This indicates a potentially positive autonomous return that AMD can generate over and above the returns predicted by the market movements alone.
Moreover, the model demonstrates a beta of 1.5913, indicating AMD's share price movements are more volatile than the market's, as one would expect from a tech stock compared to the broader market index. This higher beta signals that AMD's stock returns are significantly affected by systematic market risks but also suggests a higher return potential during positive market periods. Given this context, the alpha value becomes particularly insightful, as it accentuates AMD's potential to surpass market returns, underscoring an added value from holding AMD shares beyond the compensatory returns for market risk as captured by beta. This relationship, quantified over the observed period, provides a valuable perspective for investors evaluating AMD's performance in relation to market dynamics.
Advanced Micro Devices, Inc. (AMD) held its Fourth Quarter and Full Year 2023 Earnings Conference, highlighting significant achievements and outlining future expectations. Dr. Lisa Su, CEO, and Jean Hu, CFO, shared insights into AMD's performance, backed by detailed financial metrics. Key takeaways include AMD's strong finish to 2023, driven by accelerated Data Center sales and the successful ramp-up of Instinct AI accelerators and EPYC server CPUs. Despite varied demand across segments, AMD showcased robust growth, notably in its Data Center and Client segments, contributing to a 10% year-over-year revenue increase in Q4 to $6.2 billion.
AMD's Data Center segment emerged as a powerhouse, achieving a record $2.3 billion revenue in Q4, marking a 38% year-over-year growth. This success was attributed to the strong demand for Server CPU and Data Center GPU products, alongside significant share gains in the server market. AMD's strategic focus on cloud and enterprise clients, including partnerships with prominent hyperscalers and offerings in AI and HPC cloud instances, underscores its competitive edge and growth trajectory in the Data Center domain.
On the flip side, AMD's Embedded and Gaming segments faced challenges, with downward trends attributed to inventory adjustments and market dynamics. However, the company's innovation in Ryzen processors and advancements in AI capabilities signal potential for rebound and market leadership. Particularly, the Ryzen 8000 series processors exhibit AMD's commitment to leading in compute performance and energy efficiency, highlighting strong customer and partner engagements anticipated to drive future growth.
Looking forward, AMD projects a mixed demand environment for 2024 yet remains optimistic about its growth prospects, especially in Data Center and Client segments. The company plans to leverage its strong product portfolio, including the MI300X accelerators and upcoming EPYC processors, to capture significant market opportunities, particularly in AI accelerators expected to see substantial revenue growth. Despite challenges in the Gaming and Embedded segments, AMD's strategic investments and robust roadmap position it to navigate market fluctuations and maintain its trajectory towards revenue growth and market expansion.
mon law rights, trade secrets, and other proprietary rights in the United States and other countries to establish and protect our technology and intellectual property. Despite these precautions, it may be possible for third parties to copy or otherwise obtain and use our technology or other intellectual property without authorization. Likewise, the efforts we have taken to protect our proprietary rights may not be sufficient or effective, and we may be unable to prevent third parties from infringing or misappropriating our patents, copyrights, trademarks, trade secrets, or other intellectual property.
Moreover, any litigation to enforce our intellectual property rights, whether successful or not, could result in substantial costs and divert managements attention and resources, which could harm our business, financial condition, and results of operations. Additionally, we might be required to modify our technology or enter into licensing agreements. Such licenses might not be available on terms acceptable to us, or at all, and could significantly increase our operating expenses and impact our business and financial condition.
Furthermore, the laws of certain countries where we operate, or plan to operate, do not protect intellectual property and proprietary rights to the same extent as the laws of the United States. As such, in these jurisdictions, we may be unable to adequately safeguard our proprietary rights, which could harm our business and competitive position. Additionally, our efforts to enforce these rights can result in the imposition of trade restrictions, including injunctions and cease-and-desist orders, which could limit our ability to sell our products, conduct our business, or operate our facilities in certain jurisdictions.
Unfavorable currency exchange rate fluctuations could adversely affect us. As we transact business on a global scale, fluctuations in exchange rates may adversely affect our financial results. Changes in the relative values of currencies could make our products more expensive and less competitive in international markets, or could result in a decrease in the U.S. dollar value of our foreign currency-denominated sales and earnings. We engage in currency hedging to mitigate these risks, but these activities may not fully offset the adverse financial impacts of unfavorable movements in exchange rates. Additionally, emerging markets present higher risks of currency fluctuations and devaluation, potentially exacerbating any negative effects on our international sales and financial results.
Operational and Technology Risks
We rely on third parties to manufacture our products, and if they are unable to do so on a timely basis in sufficient quantities and using competitive technologies, our business could be materially adversely affected. Our reliance on third-party foundries, including TSMC and others, presents risks to our supply chain, production timelines, and product competitiveness. Difficulties such as production delays, capacity shortages, manufacturing yield problems, technology transitions or manufacturing defects can hinder our ability to bring products to market, meet customer demand, or maintain cost-effectiveness. If our foundry partners cannot keep up with the latest manufacturing technology or suffer operational disruptions, it could compromise our ability to compete effectively and materially harm our business and financial performance.
IT outages, data loss, data breaches, and cyber-attacks could disrupt operations and compromise our intellectual property or other sensitive information, be costly to remediate, or cause significant damage to our business, reputation, and financial results. We depend on information technology systems across operations; cybersecurity breaches such as unauthorized access to, or attacks on, these systems could lead to data leaks, operational disruptions, financial losses, and damage to our reputation. Despite security measures, vulnerabilities could be exploited by malicious parties. Recovering from cyber-attacks can be costly and time-consuming. We also face the risk of insider threats or inadvertent data breaches by employees or contractors. Ensuring the confidentiality, integrity, and availability of our data and IT systems amid evolving cybersecurity risks is critical but challenging, requiring ongoing attention and resources.
Legal and Regulatory Risks
Government actions and regulations such as export regulations, tariffs, and trade protection measures may limit our ability to export our products to certain customers. Changes in trade regulations, imposition of tariffs, or restrictions on exports can disrupt our global supply chains, increase costs, or limit the markets where we can sell our products, materially affecting our business. Political tensions between the U.S. and other countries, particularly China, could exacerbate these risks, impacting our ability to compete globally. Compliance with diverse and changing regulations worldwide requires significant resources, and non-compliance could result in fines, penalties, or restrictions on our business.
Liquidity and Capital Resources Risks
The agreements governing our notes, our guarantees of Xilinx Notes, and our Revolving Credit Agreement impose restrictions on us that may adversely affect our ability to operate our business. These agreements contain covenants that limit our operational flexibility, including restrictions on incurring debt, making investments, or engaging in mergers and acquisitions. Failure to comply with these covenants could result in a default, acceleration of repayment obligations, or limitations on future borrowing, potentially harming our liquidity, financial condition, and operational strategies.
This section should be read in conjunction with the more detailed Risk Factors in our SEC filings, as these summaries do not encompass all the specific risks to our business.
Advanced Micro Devices, Inc. (AMD) continues to heighten its profile in the competitive semiconductor industry, achieving notable milestones and strategic successes that underscore its growing influence. With a particular focus on the burgeoning artificial intelligence (AI) market, AMD demonstrates its commitment to innovation and market expansion, juxtaposed against its rivals, including Nvidia.
The crux of AMD's strategy lies in its ambitious endeavors within the AI chip market, as evidenced by the recent announcement of its groundbreaking MI300X GPU. This product positions AMD as a formidable contender, aiming to disrupt Nvidia's dominance in AI technologies. As part of a broader strategic initiative, AMD is not just competing on the product front but is also significantly enhancing its capabilities, as seen in its efforts to boost AI chip production capacity in 2024. By seeking additional CoWoS packaging providers, AMD plans to meet the escalating demands of an AI-driven future confidently.
This commitment to expanding its footprint in AI is further highlighted by the MI300 chips' design geared towards power-intensive AI and high-performance computing (HPC) workloads. The strategic importance of these accelerators cannot be overstated, particularly given AMD's CEO Lisa Su's optimistic outlook on the AI accelerator market's growth potential, which could reach $400 billion by 2027.
Moreover, AMD's strategic partnerships with tech behemoths such as Microsoft, Meta, Cisco, and Broadcom showcase its pivotal role in advancing AI technologies. These alliances, especially with Microsoft's Azure adopting the MI300X GPU, underscore AMD's strategic moves to enhance its market position and influence within the AI sector. Furthermore, the company's engagement with major companies including Microsoft, Meta Platforms, OpenAI, and Oracle following the launch of the Instinct MI300 accelerators signifies strong industry backing and amplifies investor confidence.
Financially, AMD's trajectory appears promising, with projections indicating significant revenue generation from its AI-focused product lines. Notably, the MI300 series is anticipated to potentially contribute $2 billion to AMD's revenue by 2024. Such financial forecasts are crucial, reflecting investor enthusiasm for AMD's strategic direction, especially amidst a broader recovery in the semiconductor sector.
Despite the optimism surrounding AMD, challenges remain, notably from geopolitical tensions and market dynamics that impact the tech sector. AMD's reliance on Taiwan Semiconductor Manufacturing for chip fabrication amidst U.S.-China rivalry introduces an element of geopolitical risk. Furthermore, the semiconductor industry's volatility, marked by supply chain disruptions and fluctuating demand, underscores the need for strategic agilityan area where AMD has shown commendable performance.
In conclusion, as AMD navigates the intricacies of the semiconductor industry with a keen focus on AI and strategic expansions, it exhibits a well-rounded approach to competition, innovation, and market penetration. The company's endeavors in the AI domain, coupled with strategic expansions and partnerships, present a strong narrative of growth and potential market leadership. While competition with giants like Nvidia intensifies, AMD's strategic initiatives and product advancements position it as a key player in the tech industry's future landscape, promising an intriguing trajectory as we move into 2024 and beyond.
The volatility of Advanced Micro Devices, Inc. (AMD) over the period covered indicates that the company's stock has experienced significant fluctuations. The ARCH model, used for analyzing the volatility, shows that the variance of the asset returns is notably high, with the omega coefficient (indicating the baseline volatility) at a substantial value. This suggests that AMD's stock is more volatile compared to stocks with lower omega values. Moreover, the alpha coefficient in the model points to the impact of past returns on current volatility, though its influence appears modest in this analysis, highlighting periods of both intense fluctuations and relative stability in AMD's stock price.
| Statistic Name | Statistic Value |
| Mean Model | Zero Mean |
| Vol Model | ARCH |
| Log-Likelihood | -3287.04 |
| AIC | 6578.08 |
| BIC | 6588.35 |
| No. Observations | 1258 |
| omega | 10.3645 |
| alpha[1] | 0.0527 |
Analyzing the financial risk associated with a $10,000 investment in Advanced Micro Devices, Inc. (AMD) over a span of one year involves harnessing the predictive power of volatility modeling intertwined with machine learning predictions. This dual approach not only caters to understanding the erratic behavior of stock prices but also ventures into the realm of forecasting future returns, thereby fleshing out a comprehensive risk profile for the investor.
Volatility modeling, in this context, is pivotal in deciphering the intricate patterns of stock price fluctuations specific to AMD. It scrutinizes historical price data, focusing on discerning a pattern in the variance of returns over time. This model excels in capturing the persistency and clustering of volatility, characteristics often observed in financial markets. In essence, this method provides a solid foundation for estimating the level of risk associated with price movements, underpinning the subsequent risk assessment.
On the other hand, machine learning predictions come into play by employing a refined approach towards forecasting future stock returns. Through the analysis of a vast array of variables and historical data, this methodology is adept at uncovering underlying patterns that might not be immediately apparent. The predictive capabilities of this approach, particularly when utilizing a sophisticated algorithm known for its ability to handle non-linear relationships and interactions among variables, significantly enhance the accuracy of future return predictions. This synergy between the historical volatility assessment and forward-looking return forecasts is crucial in constructing a robust risk evaluation framework.
The crux of this analysis rests on the calculated Value at Risk (VaR) at a 95% confidence interval, which stands at $446.15 for a $10,000 investment in AMD stock over one year. The VaR metric is instrumental in quantifying the maximum potential loss within a defined confidence level, thus offering a clear-eyed view of the stake at risk. This figure emerges from the intertwining of volatility modeling and machine learning insights, embodying the essence of both the historical volatility patterns and the expected future returns. It encapsulates the potential downside risk, providing a tangible measure that investors can factor into their decision-making process.
In summary, the blend of volatility modeling with machine learning predictions for forecasting stock returns offers a nuanced perspective on the financial risk associated with investing in Advanced Micro Devices, Inc. Through this analytical prism, the calculated VaR at a 95% confidence interval demystifies the risk landscape, furnishing investors with a crucial parameter for navigating the volatile terrain of equity investment.
Analyzing the provided options chain for Advanced Micro Devices, Inc. (AMD) across various expiration dates and observing the different Greek values, we focus on identifying the most profitable call options, targeting a stock price increase of 5% over the current price.
Short-term (2024-02-16 to 2024-02-23)
Among the short-term options, calls with strike prices around $55 to $75 present interesting opportunities. Specifically, the call option with a strike price of $55, expiring on 2024-02-16, shows a high return on investment (ROI) of approximately 0.517 with a high delta of 1.0, indicating it's already deep in the money and likely to yield a solid return if the stock's upward trend persists.
Medium-term (2024-03-01 to 2024-04-19)
In the medium term, considering options expiring between March and April 2024, the call option with a strike price of $75 expiring on 2024-03-01 stands out. It has a notable delta value close to 1.0, with a gamma of 0.0, indicating stability and strong delta behavior. This option, given its ROI of 0.117 and a premium close to $95, suggests profitability if the AMD stock price increases as expected.
Long-term (2024-06-20 to 2025-06-20)
For longer-term investments, focusing on options expiring in 2024 and into 2025, the calls at lower strike prices ($25 to $55) for dates extending into 2025 provide considerable leverage with minimal theta decay apparent in these options currently. Specifically, the call option with a strike price of $30 expiring on 2025-06-20 shows a promising setup with virtually no gamma, indicating less sensitivity to the underlying stock's price movement, but with a total delta of 1.0 and a relatively low premium, indicating it's deep in the money and may provide substantial returns with less risk of loss due to time decay.
Selection Criteria
- Delta: Higher delta options are preferred as they move more closely with the stock price.
- Gamma: Lower gamma is considered for longer-term options to minimize risks associated with rapid changes in delta.
- Theta: For short-term options, theta is critically observed to avoid high time decay, but its less of a concern for in-the-money longer-term options with high delta values.
- Vega: While not the primary selection criteria, options with higher vega in longer-term investments were considered to benefit from potential increases in implied volatility.
Conclusion
The analysis reveals profitable opportunities across different time horizons. For short-term gains, options with strike prices slightly above the current stock price with high ROI and delta close to 1.0, such as the $55 call expiring on 2024-02-16, are attractive. In contrast, for longer-term investments, deeply in-the-money calls like the $30 strike expiring in 2025 offer a balanced approach between leveraging potential stock price increases and mitigating the risks associated with time decay and volatility changes.
Similar Companies in Semiconductors:
Report: Taiwan Semiconductor Manufacturing Company Limited (TSM), Taiwan Semiconductor Manufacturing Company Limited (TSM), Report: Intel Corporation (INTC), Intel Corporation (INTC), Report: Marvell Technology, Inc. (MRVL), Marvell Technology, Inc. (MRVL), Report: Micron Technology, Inc. (MU), Micron Technology, Inc. (MU), Report: NVIDIA Corporation (NVDA), NVIDIA Corporation (NVDA), Broadcom Inc. (AVGO), Report: Qualcomm Incorporated (QCOM), Qualcomm Incorporated (QCOM), Report: Texas Instruments Incorporated (TXN), Texas Instruments Incorporated (TXN), Applied Materials, Inc. (AMAT), Report: Lam Research Corporation (LRCX), Lam Research Corporation (LRCX)
https://www.fool.com/investing/2023/12/27/2-no-brainer-artificial-intelligence-ai-stocks-to/
https://www.fool.com/investing/2023/12/31/nvidia-and-amd-are-set-to-skyrocket-in-2024/
https://www.fool.com/investing/2024/01/01/2-reasons-to-buy-amd-and-1-reason-to-sell/
https://www.fool.com/investing/2024/01/02/2-artificial-intelligence-ai-stocks-to-buy-before/
https://www.fool.com/investing/2024/01/02/3-artificial-intelligence-ai-stocks-to-buy-hand-ov/
https://www.fool.com/investing/2024/01/02/amd-stock-fell-today-is-it-a-buy-for-2024/
https://www.fool.com/investing/2024/01/03/better-artificial-intelligence-ai-stock-amd-vs-mic/
https://www.fool.com/investing/2024/01/04/1-artificial-intelligence-ai-stock-to-buy-before-i/
https://www.fool.com/investing/2024/01/04/intel-will-take-another-swing-at-nvidia-and-amd-in/
https://seekingalpha.com/article/4661141-semiconductors-winners-losers-start-of-2024
https://www.fool.com/investing/2024/01/05/why-advanced-micro-devices-stock-jumped-22-in-dece/
https://www.fool.com/investing/2024/01/05/amd-seeks-to-boost-artificial-intelligence-ai-chip/
https://seekingalpha.com/article/4661540-my-top-3-stock-picks-2024
https://www.fool.com/investing/2024/01/07/could-amd-stock-help-you-become-a-millionaire/
https://www.sec.gov/Archives/edgar/data/2488/000000248823000195/amd-20230930.htm
Copyright © 2024 Tiny Computers (email@tinycomputers.io)
Report ID: 187oL1
Cost: $1.24572
https://reports.tinycomputers.io/AMD/AMD-2024-02-09.html Home