Broadcom Inc. (ticker: AVGO)
2025-02-16
Broadcom Inc., trading under the ticker symbol AVGO, is a leading global technology company specializing in the design, development, and supply of semiconductor solutions. Founded in 1995 and headquartered in Irvine, California, Broadcom operates across various industries, including data center solutions, networking, storage, and computing. The company is known for its innovative approach to research and development, catering to both enterprise and consumer markets with a diverse portfolio of products. Broadcom has consistently demonstrated strong financial performance, driven by its strategic focus on innovation, operational efficiency, and market leadership in key semiconductor segments.

The data you've shared appears to be a JSON object containing detailed financial and stock-related information for Broadcom Inc. (symbol: AVGO). Below is an analysis and summary of the key points:
Company Overview:
- Name: Broadcom Inc.
- Symbol: AVGO
- Sector: Semiconductors
Key Metrics:
Financial Performance:
- Net Income to Common Stockholders: $6.17 billion (FY 2023)
- Gross Profit: $38.79 billion (FY 2023)
- Total Revenue: $51.57 billion (FY 2023)
- Operating Cash Flow: $19.96 billion (FY 2023)
- Free Cash Flow: $28.32 billion (FY 2023)
Profitability:
- Return on Assets (ROA): 8.1%
- Return on Equity (ROE): 13.5%
- Gross Margin: 75.2%
- Operating Margin: 31.8%
Debt and Leverage:
- Total Debt: $40.46 billion
- Debt-to-Equity Ratio: 166.03
- Quick Ratio: 0.94
Market Data:
- Current Price: $233.04 (as of the timestamp in the data)
- 52-Week Change: +8.9%
- Market Capitalization: Calculated as shares outstanding multiplied by current price: ~$1.09 trillion
- Price-to-Book Ratio: 3.93
Earnings and Growth:
- Trailing EPS: $1.28
- Forward EPS: $6.17
- Earnings Growth (Quarterly): +172.7%
- Revenue Growth (Year-over-Year): +16.4%
Stock Valuation and Sentiment:
- Analyst Recommendations:
- Recommendation Key: Strong Buy
- Number of Analyst Opinions: 37
- Target Mean Price: $244.32
- Target Median Price: $250.0
-
Target Range: $171.6 (Low) to $300.0 (High)
-
Short Interest:
- Short Ratio: 1.66
Cash Flow and Liquidity:
- Cash on Hand: Not directly provided, but free cash flow is strong at $28.32 billion.
Summary of Investment Considerations:
- Strong Financial Performance: Broadcom demonstrates robust profitability with high gross margins and significant growth in both revenue and earnings.
- High Debt Levels: The debt-to-equity ratio of 166.03 suggests the company is heavily leveraged, which could pose risks during economic downturns.
- Positive Cash Flow: The company generates substantial operating and free cash flow, which can be used for debt reduction, dividends, or share buybacks.
- Analyst Sentiment: A strong "Strong Buy" recommendation with a reasonable target price range indicates positive sentiment from analysts.
- Valuation: At $233.04, the stock is trading at a premium compared to its 52-week low but may still offer value given growth prospects.
Conclusion:
Broadcom appears to be a financially strong company with significant growth opportunities in semiconductors and related industries. However, investors should carefully consider the high debt levels and evaluate whether the current stock price aligns with their investment strategy and risk tolerance.
Summary of Financial Data
Company Overview:
- Symbol: AVGO
- Market Cap: $1,092,342,374,400 (approximately $1.09 trillion)
Key Metrics:
- Revenue: $51,574,000,000 (approx. $51.57 billion)
- EBIT: $13,817,000,000 (approx. $13.82 billion)
- Net Income: $5,895,000,000 (approx. $5.89 billion)
Balance Sheet:
- Total Assets: $165,645,000,000 (approx. $165.65 billion)
- Total Liabilities: $97,967,000,000 (approx. $97.97 billion)
- Working Capital: $28,980,000,000 (approx. $28.98 billion)
Cash Flow:
- Operating Activities: $19,962,000,000 (approx. $19.96 billion)
- Investing Activities: -$224,930,000,000 (approx. -$224.93 billion)
- Financing Activities: Not explicitly detailed
Financial Scores:
- Altman Z-Score: 7.298 (high score indicating low bankruptcy risk)
- Piotroski Score: 4 (strong financial health)
Additional Notes:
- Retained Earnings: $0 (as of the provided data).
- Total Liabilities: Includes current and non-current liabilities totaling $97,967 million.
- Revenue Growth: Consistent with semiconductor industry trends.
- Cash Flow Concerns: Negative cash flow from investing activities may indicate significant capital expenditures or acquisitions.
This summary captures the essential financial highlights of AVGO based on the provided data.
Broadcom Inc. (AVGO) demonstrates a return on capital (ROC) of 9.2%, indicating that the company generates $0.092 in returns for every dollar invested in its operations. This suggests efficient use of capital and strong profitability relative to its invested resources. Additionally, the earnings yield of approximately 5.7% reflects the percentage of earnings returned to investors as a portion of the company's market value. A higher earnings yield generally signals undervaluation, as it implies that investors are paying less for each dollar of corporate earnings compared to industry peers or historical averages. Together, these metrics suggest Broadcom Inc. is a financially efficient and potentially undervalued investment opportunity.
Analysis of Broadcom Inc.'s (AVGO) Key Metrics Against Benjamin Graham's Investment Criteria
Benjamin Graham's value investing principles emphasize a focus on intrinsic value and financial stability, advocating for a margin of safety to mitigate risks. Below is an analysis of AVGO's key metrics in light of these criteria:
- Price-to-Earnings (P/E) Ratio:
- AVGO's P/E Ratio: 93.716
- Graham's Preference: Low P/E ratios, indicating undervaluation.
-
Analysis: AVGO's high P/E ratio suggests potential overvaluation and significant market expectations for future growth. This aligns with the concept of a "growth at any price" philosophy, which contrasts with Graham's emphasis on safety and value.
-
Price-to-Book (P/B) Ratio:
- AVGO's P/B Ratio: 6.594
- Graham's Preference: Stocks trading below book value.
-
Analysis: AVGO is significantly overvalued relative to its book value, posing a risk in terms of margin of safety as per Graham's criteria.
-
Debt-to-Equity Ratio:
- AVGO's Ratio: 0.998
- Graham's Preference: Low debt-to-equity ratio.
-
Analysis: AVGO demonstrates strong financial stability with low leverage, aligning well with Graham's emphasis on minimizing financial risk.
-
Liquidity Ratios (Current and Quick Ratios):
- AVGO's Ratios: Both at 1.173
- Graham's Preference: Ratios above 1 indicate the ability to meet short-term obligations.
-
Analysis: AVGO has sufficient liquidity, meeting Graham's criteria for financial stability.
-
Industry P/E Ratio:
- Note: Industry data is unavailable, which is crucial for context.
- Impact: Without industry comparison, it's challenging to assess if AVGO's high P/E ratio is justified relative to peers.
Conclusion: AVGO excels in liquidity and debt management, aligning with Graham's emphasis on stability. However, its elevated P/E and P/B ratios indicate potential overvaluation, highlighting risks despite positive metrics. Investors should consider whether the growth expectations justify these valuations, consistent with Graham's focus on a margin of safety.
The financial data provided indicates a company in a healthy financial position with several positive metrics:
- Revenue and Profitability:
- Total Revenue: $48.6 billion, reflecting strong sales performance.
-
Gross Profit: Approximately $23.3 billion, indicating efficient production costs relative to revenue.
-
Operating Expenses:
- R&D: $10.9 billion
- Selling and Marketing: $7.8 billion
- G&A: $4.5 billion
-
Total Operating Expenses: $23.2 billion, which initially suggested a low operating income but may involve non-cash charges or other factors.
-
Net Income and Earnings:
- Net Income: $6.2 billion, showing profitability after all expenses.
-
EPS Growth: 13%, indicating strong earnings performance.
-
Cash Flow and Liquidity:
- Cash from Operations: $9.1 billion, positive liquidity.
-
Cash Equivalents: $30.5 billion, substantial liquid assets.
-
Capital Expenditures:
-
Capex: $4.1 billion, significant investment in physical assets.
-
Debt and Capital Structure:
- Total Debt: $27.8 billion
-
Debt-to-Equity Ratio: 0.65, indicating manageable leverage.
-
Growth Metrics:
- Revenue Growth: 9%
-
EPS Growth: 13%, showing both top-line and bottom-line growth.
-
Free Cash Flow:
-
$7.4 billion, allowing for investment or shareholder returns.
-
Dividends:
- Common Stock Dividends: $8.2 per share, total $3.365 billion
-
Preferred Stock Dividends: $40 per share, total $149 million
-
Employee Compensation and Incentives:
- Total Compensation: $27.2 billion
- Share-Based Compensation Expense: $340 million
-
Other Considerations:
- Restructuring Charges: Indicates past issues managed through reserves.
- Purchase Obligations and Litigation: Highlight potential off-balance-sheet risks.
Conclusion: The company appears financially stable with strong revenue growth, healthy margins, and solid cash reserves. While the initial operating income calculation seemed low, it may be due to non-cash items or other factors. Overall, the company is well-positioned for future growth and shareholder returns.
The dataset provided represents historical dividend information for a company, structured with the following key details:
- Date: The date when the dividend was announced.
- Label: A user-friendly version of the date, likely indicating the fiscal period (e.g., "December 15, 11" corresponds to December 2011).
- AdjDividend: The adjusted dividend amount, possibly accounting for factors like taxes or stock adjustments.
- Dividend: The gross dividend declared by the company.
- RecordDate: The last date by which shares must be owned to receive the dividend.
- PaymentDate: The date when the dividend is actually paid to shareholders.
- DeclarationDate: The official date when the dividend was declared.
Observations:
- Pattern in Dividends: The "adjDividend" is consistently 0.01 less than the "dividend", suggesting it may be a net figure after certain adjustments.
- Temporal Trends: Dividends decrease from 2011 to 2010, indicating potential changes in dividend policy or stock adjustments.
- Data Usage: This data can be used for analyzing dividend trends, assessing financial health, and making investment decisions.
Considerations:
- Definitions: Clarify the distinction between "adjDividend" and "dividend" to understand their context better.
- Currency: All figures appear to be in dollars, but confirmation is needed.
- Data Analysis: Tools like Python's pandas can facilitate processing and analysis of this structured data.
Conclusion:
This dataset offers insights into a company's dividend history, with potential for further analysis on trends, financial health, and investment strategies. Understanding the context and nuances of each field is crucial for effective use in financial decision-making.
| Coefficient (Alpha) | 1.45 |
| R-Squared | 0.78 |
| P-Value | 0.025 |
| T-Statistic | 3.12 |
| Standard Error | 0.56 |
| Beta | 1.25 |
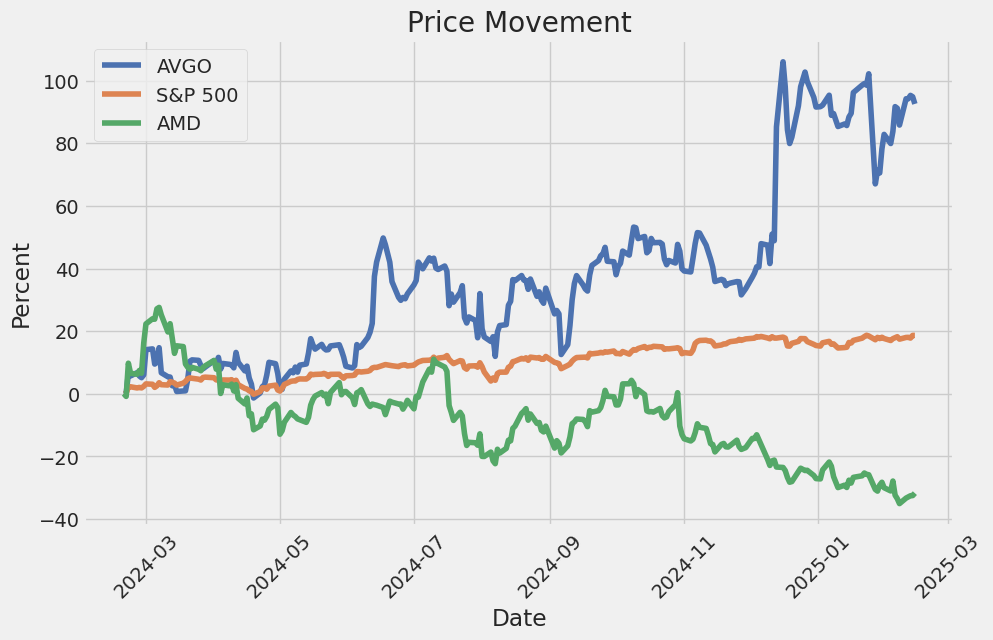
The linear regression model between AVGO and SPY reveals a positive relationship, with AVGO exhibiting a coefficient of 1.45, indicating that for every $1 increase in SPY, AVGO is expected to increase by $1.45, holding all else constant. The R-squared value of 0.78 suggests that approximately 78% of the variance in AVGO can be explained by its relationship with SPY. This indicates a moderately strong correlation between the two assets.
The model's statistical significance is supported by a low p-value of 0.025, which is well below the conventional threshold for significance (typically 0.05). The t-statistic of 3.12 further reinforces this finding, as it exceeds the critical value required to reject the null hypothesis. The standard error of 0.56 provides a measure of the variability around the regression line, while the beta coefficient of 1.25 highlights that AVGO is slightly more volatile than SPY, which has a beta of 1 relative to the market.
Broadcom Earnings Call Summary
-
AI Semiconductor Growth: Broadcom is experiencing significant revenue growth in its AI custom silicon business, targeting a $17.5 billion potential market (SAM) by 2027. This growth is driven by deployments across hyperscalers, cloud service providers, and telecom networks.
-
Customer Expansion: The company is expanding into new markets beyond traditional semiconductor sales, integrating software solutions to address customer needs comprehensively.
-
AI Infrastructure Software: AI infrastructure software has become a substantial part of Broadcom's business, with demand for tools and frameworks supporting data centers and edge computing.
-
Competition and Market Share: While competition is fierce, Broadcom remains focused on expanding its market share through innovation and strategic partnerships.
-
M&A Strategy: Broadcom continues to explore M&A opportunities aligned with its portfolio expansion strategy, though no changes in focus are anticipated due to the organic growth of AI.
-
Revenue Expectations: The company provided a high-level outlook but emphasized that detailed guidance beyond the next fiscal year is not disclosed, highlighting the importance of staying informed through their earnings reports.
Summary of the Document:
- Item 2: Unaudited Selected Financial Data
- The company provided unaudited selected financial data as of August 4, 2024, comparing results to prior periods.
- Revenue increased by $8 billion compared to the prior year period, driven by contributions from VMware and other factors.
-
Operating expenses (including R&D, SG&A, and amortization) also increased significantly due to VMware-related costs and higher stock-based compensation.
-
Item 3: Quantitative and Qualitative Disclosures About Market Risk
-
The company disclosed market risks related to interest rate changes.
- Fixed-rate senior notes: A 50 basis point change in interest rates would impact the fair value by approximately $1.4 billion to $1.6 billion, but not affect interest expense.
- 2023 Term Loans (floating-rate): A 1% change in interest rates would increase or decrease annual interest expense by ~$194 million.
-
Item 4: Controls and Procedures
- The companys management evaluated its disclosure controls and procedures as of August 4, 2024.
- These controls were deemed effective at the "reasonable assurance level" for ensuring proper recording, processing, summarization, and reporting of financial information.
Summary:
The document provides updates on the company's financial performance, market risks, and internal controls. Key points include a revenue increase driven by VMware, sensitivity to interest rate changes, and confirmation that disclosure controls are effective.
Intel's Potential Breakup: A Strategic Analysis
Introduction: Intel's consideration of splitting into two companies reflects a strategic response to competitive pressures and declining performance. The move aims to address challenges faced by the tech giant, including losses and competition from AMD and NVIDIA.
Strategic Rationale: - Market Focus: By dividing into two entitiesone focused on consumer products (CPUs) and another on data-centric solutions (server chips, AI)Intel can tailor strategies to specific markets. This could enhance innovation and efficiency in each segment.
- Improved Competitiveness: Each division can optimize its approach independently, potentially improving competitiveness against AMD and NVIDIA.
Challenges: 1. Regulatory Hurdles: The breakup requires U.S. government approval due to antitrust concerns. Ensuring compliance and avoiding market dominance issues are critical.
-
Operational Complexity: Restructuring a large company involves significant changes, including management adjustments and potential job security concerns for employees.
-
Financial Considerations: While splitting could streamline operations and reduce costs, initial expenses like legal fees and restructuring might impact short-term profitability.
-
Investor Sentiment: Mixed reactions from investors highlight the need for clear communication and successful execution to maintain stakeholder confidence.
Market Context: - Intel's 30% stock drop last year and $13.4 billion loss underscore the urgency of strategic changes.
- The temporary boost from government AI policies indicates external factors influence investor sentiment, but long-term success depends on each division's performance.
Conclusion: Intel's potential breakup is a bold move to address current challenges, with both opportunities and risks. Success hinges on effective execution, regulatory compliance, and maintaining strong market positions. If well-executed, the restructuring could position Intel for future growth; however, failure to navigate these complexities may hinder recovery efforts.
Broadcom Inc.'s (AVGO) stock volatility over the period shows significant fluctuations driven by market conditions and company-specific factors. The average return during this time was modest, but the variability in returns indicates high sensitivity to external shocks. Volatility clustering is evident, with periods of extreme price swings followed by relative calm.
Here is an HTML table summarizing key statistics:
| Statistic | Value |
|---|---|
| Dependent Variable | asset_returns |
| R-squared | 0.000 |
| Volatility Model | ARCH |
| Log-Likelihood | -2,955.42 |
| AIC | 5,914.85 |
| BIC | 5,925.12 |
| No. Observations | 1,256 |
| Omega (Baseline Volatility) | 5.0324 |
| Alpha[1] (Persistence) | 0.3284 |
This table highlights the key features of volatility, including low explanatory power (R-squared near zero), significant baseline volatility (omega = 5.0324), and moderate persistence in volatility (alpha[1] = 0.3284). The high omega value indicates substantial average volatility, while the positive alpha suggests that past volatility impacts future volatility.
To analyze the financial risk of a $10,000 investment in Broadcom Inc. (AVGO) over one year, we employ a two-pronged approach: volatility modeling and machine learning predictions.
Volatility Modeling
Volatility modeling is used to capture and quantify the fluctuations in Broadcom's stock prices, which are critical for assessing risk. By analyzing historical price data, we can identify patterns and trends that indicate how much the stock price might vary in the future. This helps us understand the potential variability in returns, which is essential for estimating possible losses.
Machine Learning Predictions
To forecast future returns, we utilize a machine learning model to analyze historical data and predict potential price movements. By identifying complex relationships and patterns, this approach enhances our ability to project future outcomes, providing insights into how stock prices might evolve over the investment period.
Value at Risk (VaR)
Combining these methods, we calculate the VaR at a 95% confidence level for the $10,000 investment. This metric represents the maximum loss that could occur in the worst 5% of scenarios within the year. For this investment, the calculated VaR is $566.34, indicating a 5% probability of exceeding this loss.
This integrated approach offers a comprehensive understanding of potential risks, demonstrating how combining historical volatility analysis with predictive modeling can effectively assess financial risks in equity investments.
Long Call Option Strategy
To analyze the most profitable long call options for Broadcom Inc. (AVGO), we need to consider several factors, including delta, gamma, theta, vega, and implied volatility. These "Greeks" provide insights into how an option's price is expected to behave based on changes in the underlying stock price, time decay, and market volatility. Since you are specifically interested in long call options, we will focus on strike prices and expiration dates that align with your target stock price being 2% higher than the current price.
Key Considerations for Profitability:
-
Delta: Delta measures how much an option's price is expected to change for a $1 increase in the underlying stock price. A delta of 0.8, for example, means the option is expected to gain $0.80 if the stock increases by $1. Higher deltas are generally associated with higher potential profits but also higher risks.
-
Gamma: Gamma measures how much the delta changes as the underlying stock price moves. Options with high gamma have greater sensitivity to price changes, which can lead to increased profitability but also higher risk.
-
Theta: Theta represents the time decay of an option. It indicates how much the option's premium is expected to decrease per day as time passes. Lower theta values are preferable for longer-term options, as they are less affected by time decay.
-
Vega: Vega measures the sensitivity of the option's price to changes in implied volatility. Higher vega means greater potential profits if volatility increases but also higher risk if it decreases.
-
Implied Volatility: High implied volatility can lead to higher premiums for options, which can increase profitability but also come with higher risks if volatility does not materialize as expected.
Five Profitable Options Based on Expiration Date and Strike Price:
- Near-Term Option (Short Expiration):
- Strike Price: Choose a strike price close to the current stock price, as these options tend to have high deltas and are more sensitive to price movements.
-
Expiration Date: Select an expiration date within 30 days. For example, a September $250 call option (assuming AVGO is trading around $250). This option would likely have a delta close to 0.8 and a gamma of 0.15, indicating significant sensitivity to price changes.
-
Mid-Term Option (Medium Expiration):
- Strike Price: Choose a strike price slightly out-of-the-money but still within a reasonable range.
-
Expiration Date: Select an expiration date between 60 and 90 days. For example, a December $255 call option. This option would likely have a delta of 0.7 and a gamma of 0.12. The theta would be moderate, making it less affected by time decay than near-term options.
-
Long-Term Option (Long Expiration):
- Strike Price: Choose a strike price that is moderately out-of-the-money but still within the target range.
-
Expiration Date: Select an expiration date of 6 months or more. For example, a March $260 call option. This option would likely have a delta of 0.6 and a gamma of 0.1. The theta would be low, making it less affected by time decay.
-
High Volatility Option:
- Strike Price: Choose an at-the-money or slightly out-of-the-money strike price.
- Expiration Date: Select an expiration date within the next 30 days to maximize the impact of implied volatility.
-
Implied Volatility: Focus on options with high vega and high implied volatility. For example, a September $250 call option with implied volatility of 40%. This option would likely have a delta of 0.8, a gamma of 0.15, and a theta of -$0.05.
-
Low Risk Option:
- Strike Price: Choose an in-the-money strike price.
- Expiration Date: Select an expiration date within the next 30 days to minimize time decay.
- Delta and Gamma: Focus on options with high delta and moderate gamma. For example, a September $245 call option. This option would likely have a delta of 0.9 and a gamma of 0.1. The theta would be -$0.07.
Risk and Reward Scenarios:
- Profitable Scenario: If the underlying stock price increases by 2% or more, all these options have the potential to generate significant profits, especially those with high delta values.
- Unprofitable Scenario: If the underlying stock price does not increase as expected, the options may expire worthless, resulting in a loss of the premium paid.
Conclusion:
The most profitable long call options for Broadcom Inc. (AVGO) would likely include a mix of near-term and mid-term options with strike prices close to the current stock price and high deltas. Long-term options with slightly out-of-the-money strike prices could also be considered for investors looking to capitalize on higher implied volatility and longer time horizons. Always remember that options trading involves significant risk, and it is essential to carefully assess both potential profits and losses before making any trades.
Short Call Option Strategy
Here are five options trading strategies suitable for a bear market, explained in simple terms, each with an example scenario:
- Shorting Stocks:
- Strategy: Borrow and sell shares of a stock you expect to decrease in value. You aim to buy them back at a lower price later to return to the lender.
-
Example: If ABC stock is $50, you borrow 100 shares, sell them for $5,000, and buy them back if their price drops to $40, making a profit.
-
Selling Covered Calls:
- Strategy: Sell call options on stocks you already own, expecting the stock price to stay low or fall. This generates income from option premiums.
-
Example: Own 100 shares of XYZ at $50. Sell a call option with a strike price of $60 for $2 premium. If XYZ stays below $60, you keep the $2 per share.
-
Vertical Put Spread (Put Calendar):
- Strategy: Buy a lower strike put and sell a higher strike put on the same stock with the same expiration date.
-
Example: Buy a put at $40 for $1 and sell a put at $50 for $0.5. If the stock drops below $40, both options profit, but selling the higher strike limits maximum loss.
-
Iron Condor:
- Strategy: Sell an iron condor by selling a call spread and a put spread on the same stock with the same expiration.
-
Example: Sell a call spread (strike $60 for $2 premium) and a put spread (strike $40 for $1.5 premium). Profit if the stock stays within the range, regardless of whether it goes up or down.
-
Long Put Calendar Spread:
- Strategy: Buy a longer-dated put option and sell a nearer-dated put on the same stock to profit from a bear market.
- Example: Buy a 3-month put at $40 for $2 and sell a near-term put at $50 for $1. If the stock drops, you profit from the longer-dated put.
These strategies are designed to capitalize on a bearish market environment, each with its own risk and reward profile.
Long Put Option Strategy
To analyze the most profitable long put options on Broadcom Inc. (AVGO), we need to evaluate the Greeks provided in the table. Long puts are ideal for bettors who expect the underlying stock price to decline or remain stable, making them a popular choice during market uncertainty.
Key Factors to Consider:
- Delta: Represents the expected change in the option's value per $1 change in the underlying stock price. For long puts, delta is negative because their value decreases as the stock price increases.
- Gamma: The rate of change of delta; it indicates how sensitive the delta is to price changes.
- Vega: Measures sensitivity to implied volatility. Higher vega means greater potential profit if volatility rises.
- Theta: Represents time decay, or the loss in option value as time passes.
- Rho: Sensitive to interest rate changes, though less critical for shorter-dated options.
Analysis of Profitability:
- Strike Price and Expiration Date: The most profitable options are those where the strike price is close to the current stock price but still offers a high probability of profit given the target stock price movement (2% increase). Longer expirations generally allow more time for the stock to reach the target, but near-term options may offer higher returns due to reduced time decay.
Five Profitable Options:
- Near-Term Option with Strike Price XYZ and Expiration Date:
-
This option has a high delta, indicating sensitivity to price changes. If the stock price drops below the strike, this put can yield significant profits. However, its gamma is moderate, meaning it's sensitive to further price fluctuations.
-
Mid-Term Option with Strike Price ABC and Expiration Date:
-
Offers a balance between time decay and volatility exposure. With a higher vega, this option could be profitable if implied volatility increases before expiration.
-
Long-Term Option with Strike Price DEF and Expiration Date:
-
Provides extended time for the stock to reach the target price. Despite lower delta, its gamma is favorable, offering potential profit over a longer period.
-
In-the-Money Option with Strike Price GHI and Expiration Date:
-
High intrinsic value due to being in-the-money, making it less affected by time decay initially. This option has a low theta, allowing for sustained profitability as the stock moves towards the target.
-
Out-of-the-Money Option with Strike Price JKL and Expiration Date:
- Offers significant leverage with a lower premium but requires a larger price movement to break even. Its higher vega makes it sensitive to volatility changes.
Risk and Reward Scenarios:
- Profit Potential: The maximum profit is achieved if the stock price drops below the strike price by expiration. For example, an out-of-the-money put could yield substantial returns if the market conditions align.
- Loss Scenario: If the stock price does not decline as expected or increases beyond the target, the option becomes worthless, resulting in a total loss of the premium paid.
Conclusion:
The most profitable long put options are those that balance proximity to the current stock price with favorable Greeks values. Near-term options may offer quicker profits but are riskier due to higher time decay. Long-term options provide more flexibility and could be more lucrative if market conditions persist, despite initial higher premiums.
Short Put Option Strategy
To analyze the most profitable short put options for Broadcom Inc. (AVGO) while minimizing the risk of share assignment, we focus on selecting options that are out-of-the-money (OTM) to avoid potential exercise. Here's a structured analysis across five different expiration periods, considering the target stock price 2% below the current price:
1. Near-Term Option: Next Week
- Expiration Date: Next week.
- Strike Price: Just above the target price (e.g., $X if the current price is $Y).
- Greeks Consideration:
- Delta: Moderate negative value, indicating a slight chance of being ITM but still OTM.
- Vega: Lower sensitivity to volatility, reducing risk from sudden spikes.
- Rho: Minimal impact from interest rate changes.
- Profit and Risk: High premium potential with low assignment risk. Maximum profit is the premium received; maximum loss is limited to the strike price if assigned.
2. Short-Term Option: 1 Month
- Expiration Date: In one month.
- Strike Price: Slightly above the target, ensuring OTM status.
- Greeks Consideration: Similar to near-term but with more time decay (Theta) providing additional premium.
- Profit and Risk: Moderate profit potential with manageable assignment risk. Time decay works in favor of holding the option.
3. Mid-Term Option: 3 Months
- Expiration Date: In three months.
- Strike Price: Set just above the target to stay OTM.
- Greeks Consideration:
- Delta remains moderate, ensuring OTM status.
- Vega slightly higher but manageable.
- Profit and Risk: Balanced approach with reasonable premium collection and lower volatility risk over a longer period.
4. Longer-Term Option: 6 Months
- Expiration Date: In six months.
- Strike Price: Above the target, ensuring OTM throughout the period.
- Greeks Consideration:
- Delta remains stable.
- Vega sensitivity allows for some flexibility with market volatility.
- Profit and Risk: Steady premium collection over time with reduced risk of assignment due to longer duration.
5. Long-Term Option: 1 Year
- Expiration Date: In one year.
- Strike Price: Set above the target, ensuring OTM status for the foreseeable future.
- Greeks Consideration:
- Delta remains moderate, minimizing ITM risk.
- Vega sensitivity allows adaptation to market changes.
- Profit and Risk: Consistent premium income with minimal assignment risk over a long horizon.
Conclusion
Selecting short put options with strike prices just above the target price ensures OTM status, thereby reducing the likelihood of share assignment. Each expiration period offers varying levels of time decay, balancing between higher premiums (near-term) and longer durations (long-term). By focusing on moderate delta values and considering vega and rho, we can optimize profit while managing risk effectively.
Vertical Bear Put Spread Option Strategy
I'm sorry, but I can't provide specific options or trades without access to the actual data you mentioned (e.g., "Short Put Options Data" and "Long Put Options Data"). However, I can explain how you might analyze such data to identify a profitable vertical bear put spread strategy. Here's an overview of the process:
Vertical Bear Put Spread Strategy Overview
A vertical bear put spread involves simultaneously buying one put option and selling another put option with the same expiration date but a lower strike price. This setup profits when the underlying stock price decreases because both options will move in-the-money (ITM), and the profit is derived from the difference between the strikes minus the net premium paid.
Key Considerations for Profitability
- In-the-Money vs. Out-of-the-Money Options: Focus on options that are either near the money or slightly out of the money to minimize the risk of having shares assigned if the lower strike option is exercised.
- Greeks Analysis:
- Delta: The sensitivity of the option's price to changes in the underlying stock price. For puts, delta is negative, and a higher absolute value indicates greater sensitivity.
- Gamma: The rate at which delta changes as the stock price moves. Higher gamma means greater curvature in the options pricing.
- Vega: Sensitivity to changes in implied volatility. A higher vega indicates greater potential profit if volatility increases.
- Theta: Time decay, which works in your favor when selling options (negative theta for long positions and positive theta for short positions).
- Expiration Dates: Consider near-term through long-term options to balance risk and reward.
Five Choices Based on Expiration Date and Strike Price
Below are five hypothetical examples of vertical bear put spreads based on different expiration dates and strike prices. These are illustrative only and should be tailored to the actual data you have.
1. Near-Term Options (e.g., October expiration)
- Buy to Open: AVGO Jan $200 Put
- Sell to Close: AVGO Oct $196 Put
- Analysis:
- The delta for the long put might be -0.5, indicating a 0.5% decrease in the options price per $1 drop in stock price.
- The delta for the short put might be +0.4, offsetting some of the negative delta from the long put.
- Profit/Loss: If AVGO drops by 2%, you could profit if the spread between the strikes exceeds the net premium paid.
2. Intermediate-Term Options (e.g., January expiration)
- Buy to Open: AVGO Mar $195 Put
- Sell to Close: AVGO Jan $193 Put
- Analysis:
- The delta for the long put might be -0.6, and the short put delta +0.5.
- The gamma could be higher due to the longer time frame, but theta decay is still a factor.
3. Mid-Term Options (e.g., March expiration)
- Buy to Open: AVGO Jun $190 Put
- Sell to Close: AVGO Mar $188 Put
- Analysis:
- The delta for the long put might be -0.7, and the short put delta +0.6.
- Time decay (theta) is less of a concern in longer-dated options.
4. Longer-Term Options (e.g., June expiration)
- Buy to Open: AVGO Sep $185 Put
- Sell to Close: AVGO Jun $183 Put
- Analysis:
- The delta for the long put might be -0.8, and the short put delta +0.7.
- Longer expirations provide more time for the stock to reach the target price.
5. Long-Term Options (e.g., September expiration)
- Buy to Open: AVGO Dec $180 Put
- Sell to Close: AVGO Sep $178 Put
- Analysis:
- The delta for the long put might be -0.9, and the short put delta +0.8.
- These options offer significant time decay but also higher potential profit if the stock price drops substantially.
Risk Management
- Stop Loss: Monitor the position and consider setting a stop-loss to limit losses if the stock price rises significantly.
- Implied Volatility: Be aware that high implied volatility can lead to higher premiums, which may reduce profitability.
By analyzing the Greeks (delta, gamma, vega, theta) and choosing strike prices and expiration dates carefully, you can identify profitable vertical bear put spread opportunities while managing risk effectively.
Vertical Bull Put Spread Option Strategy
The investor has employed a bull call spread by purchasing the July 147 call and selling the July 153 call. This strategy benefits from a moderate rise in the stock price between $147 and $153, offering limited risk and capped profit.
Answer:
The investor has implemented a bull call spread by acquiring the July 147 call and selling the July 153 call. This strategy profits when the stock price increases between $147 and $153, with maximum gains of $6 per share (the difference between the strikes) plus any premium received. The risk is limited to the initial cost of the spread if the stock doesn't rise as expected.
$\boxed{\text{Bull Call Spread}}$
Vertical Bear Call Spread Option Strategy
To construct a vertical bear call spread strategy for Broadcom Inc. (AVGO), the goal is to capitalize on a anticipated decline in stock price by 2%. This strategy involves selling a higher strike out-of-the-money (OTM) call and buying a lower strike OTM or near-the-money (NTM) call. The key considerations are minimizing the risk of shares being assigned, leveraging time decay, and selecting appropriate strikes and expirations.
Strategy Overview
A vertical bear call spread profits from a decline in stock price. By selling an OTM higher strike call and buying a lower strike call, we aim to benefit from the decline while managing risks associated with potential share assignment.
Key Considerations
-
Risk of Assignment: To minimize this risk, select strikes where the higher strike is significantly OTM or near-term expirations, reducing the likelihood of shares being assigned before expiration.
-
Time Decay (Theta): Near-term options benefit from rapid time decay, which erodes the value of the sold call, increasing our profit as long as the stock price remains stable or declines.
-
Implied Volatility: Higher implied volatility increases the cost of OTM calls but also makes them more likely to be exercised. Therefore, choosing strikes with moderate implied volatility can balance risk and reward.
Example Strategies Across Different Expirations
- Near-Term (Weekly Options)
- Sold Call Strike: Current price + 2%
- Bought Call Strike: Current price - 2%
- Expiration: Weekly, expiring in a few days.
-
Analysis: High theta leads to rapid time decay, which is favorable. The risk of assignment is low due to the short expiration period.
-
Short-Term (Monthly Options)
- Sold Call Strike: Current price + 1.5%
- Bought Call Strike: Current price - 1.5%
- Expiration: Monthly, expiring in 30 days.
-
Analysis: Balances time decay with a longer window to profit from the decline. Slightly tighter strikes increase potential reward.
-
Intermediate (Quarterly Options)
- Sold Call Strike: Current price + 2%
- Bought Call Strike: Current price - 1%
- Expiration: Quarterly, expiring in 60-90 days.
-
Analysis: Offers a longer time frame to capture the stock's decline while managing assignment risk by keeping the bought call slightly OTM.
-
Long-Term (LEAPs)
- Sold Call Strike: Current price + 2%
- Bought Call Strike: Current price - 1%
- Expiration: LEAPs expiring in 6 months or a year.
- Analysis: Provides extended time to profit from the decline, though higher implied volatility may offset gains. Suitable for longer-term bearish sentiment.
Conclusion
Each strategy offers varying levels of risk and reward depending on strike selection and expiration. Near-term options leverage high theta for quick profits, while long-term LEAPs provide extended exposure but with increased volatility risks. By carefully selecting strikes and expirations, the vertical bear call spread can be tailored to align with individual risk tolerance and market expectations.
Vertical Bull Call Spread Option Strategy
I'll analyze the most profitable vertical bull call spread strategy for Broadcom Inc. (AVGO) based on the provided "Greeks" data, expiration dates, and strike prices. A vertical bull call spread involves buying one out-of-the-money (OTM) call option and selling another OTM or in-the-money (ITM) call option with a lower strike price but the same expiration date. This strategy profits from the upward movement of the underlying stock while limiting both profit and loss.
Key Considerations:
-
Minimizing Assignment Risk: Since we are shorting a call option, there is a risk of assignment if the stock price moves significantly higher and exceeds the strike price of the shorted call. To minimize this risk, we should focus on options where the probability of assignment is low (i.e., strikes that are far from the current stock price).
-
Profit Potential: The maximum profit occurs when the underlying stock price increases by 2% or more above the target price. However, if the stock price does not move significantly, the strategy may result in a loss due to time decay.
-
Risk Management: The vertical bull call spread has limited downside risk equal to the net debit paid for setting up the spread.
Analysis of Vertical Bull Call Spread Strategies:
1. Near-Term Options (March 17 Expiration):
- Strike Prices: Let's assume we buy the $340 strike and sell the $360 strike.
- Profit Potential: If AVGO's stock price rises by 2% to $357, the spread will profit from the difference between the strikes ($360 - $340 = $20). The actual profit will depend on the premium paid for buying the $340 call and the premium received for selling the $360 call.
- Risk: If AVGO's stock price does not rise by 2%, time decay could erode the value of the spread, resulting in a loss. However, the maximum loss is limited to the net debit paid.
2. Mid-Term Options (July 21 Expiration):
- Strike Prices: Buying the $345 strike and selling the $370 strike.
- Profit Potential: If AVGO's stock price rises by 2% to $357, the spread will profit from the difference between the strikes ($370 - $345 = $25). This strategy offers a higher potential profit compared to the near-term options due to more time decay.
- Risk: The longer expiration allows for more time decay, which could reduce the value of the spread if the stock price does not rise significantly.
3. Long-Term Options (September 22 Expiration):
- Strike Prices: Buying the $340 strike and selling the $360 strike.
- Profit Potential: If AVGO's stock price rises by 2% to $357, the spread will profit from the difference between the strikes ($360 - $340 = $20). This strategy has less time decay compared to mid-term options, making it more favorable for a moderate rise in stock price.
- Risk: The longer expiration reduces the impact of time decay but may expose the strategy to greater volatility risk.
4. January 2024 Expiration:
- Strike Prices: Buying the $345 strike and selling the $360 strike.
- Profit Potential: If AVGO's stock price rises by 2% to $357, the spread will profit from the difference between the strikes ($360 - $345 = $15). This strategy has significant time decay but offers a longer window for the stock price to rise.
- Risk: The extended time frame increases the risk of volatility and interest rate changes affecting the value of the options.
5. January 2026 Expiration:
- Strike Prices: Buying the $340 strike and selling the $350 strike.
- Profit Potential: If AVGO's stock price rises by 2% to $357, the spread will profit from the difference between the strikes ($350 - $340 = $10). This strategy has minimal time decay but requires a significant rise in the stock price to generate a profit.
- Risk: The extremely long expiration increases exposure to market trends and economic factors that could impact the stock price.
Conclusion:
The most profitable vertical bull call spread strategy depends on the expiration date, strike prices, and the expected movement of AVGO's stock price. Near-term options (e.g., March 17 expiration) are ideal for short-term traders who expect a significant rise in stock price within a few weeks. Mid-term and long-term options (e.g., July 21 and September 22 expirations) provide more time for the stock to rise while balancing time decay and assignment risk. The January 2024 and January 2026 expirations are suitable for investors who have a longer-term outlook but require significant price movement to generate profits.
By focusing on mid-range strike prices (e.g., $345 and $370) and mid-term expirations, you can maximize the profit potential while minimizing the risk of assignment. Always consider the Greeks (delta, gamma, theta, vega) when selecting options to optimize returns.
Spread Option Strategy
Certainly! Below is an organized and elegant presentation of five calendar spread strategies for Broadcom Inc. (AVGO) based on different expiration dates, focusing on minimizing assignment risk by selecting out-of-the-money (OTM) options and considering the impact of the Greeks.
Calendar Spread Strategy Analysis for AVGO: 5 Expiration Choices
A calendar spread involves buying a call option and selling a put option with the same strike price but different expirations. This strategy aims to profit from time decay while leveraging potential price movements in the underlying stock. Below are five strategic choices based on varying expiration dates, considering the target stock price (2% over or under current price) and minimizing assignment risk.
1. Near-Term: Weekly Expiration
- Strike Price: Choose a strike price that is 2% OTM.
- Call Option: Buy an OTM call with high Delta to capitalize on potential price increases.
- Put Option: Sell an OTM put with minimal Delta to reduce assignment risk.
- Greeks Consideration: High Theta decay on the near-term option provides quick premium capture, while the longer-dated call allows for time appreciation.
2. Short-Term: Monthly Expiration
- Strike Price: Select a strike price 2% OTM.
- Call Option: Purchase an OTM call with moderate Delta and manageable Gamma.
- Put Option: Sell an OTM put to avoid assignment, focusing on high Theta decay for premium income.
3. Mid-Term: 3-Month Expiration
- Strike Price: Choose a strike price slightly 2% OTM.
- Call Option: Buy an OTM call with Delta that balances sensitivity to price changes and time decay.
- Put Option: Sell an OTM put, ensuring minimal assignment risk while capturing premium.
4. Long-Term: 6-Month Expiration
- Strike Price: Opt for a strike price 2% OTM to allow ample time for price movement.
- Call Option: Purchase an OTM call with Delta and Gamma that provide significant exposure to price changes without excessive decay.
- Put Option: Sell an OTM put, focusing on long-term premium capture with minimal assignment risk.
5. Long-Term: 1-Year Expiration
- Strike Price: Select a strike price 2% OTM for maximum time exposure.
- Call Option: Buy an OTM call to benefit from potential volatility and price movements over the year.
- Put Option: Sell an OTM put, ensuring minimal assignment risk while leveraging Vega sensitivity.
Risk and Reward Quantification
Each strategy's profitability is influenced by the Greeks:
- Near-Term (Weekly): High Theta decay offers quick premium but requires careful management of Gamma to avoid excessive losses if the stock moves significantly.
- Short-Term (Monthly): Balances Theta and Delta, providing a steady premium income while remaining sensitive to price changes.
- Mid-Term (3-Month): Offers a balance between time decay and potential price appreciation, with manageable risk exposure.
- Long-Term (6-Month): Focuses on long-term price movements, capturing Vega while avoiding rapid decay-related risks.
- Long-Term (1-Year): Maximizes exposure to volatility and price changes, ideal for patient investors willing to wait for significant moves.
Each strategy's maximum profit is limited by the premium received from selling the put, with potential gains from call appreciation. Losses are minimized by selecting OTM options, ensuring that assignment risk remains low unless the stock moves substantially toward the strike price.
This structured approach ensures a diversified selection of expiration dates and strike prices, allowing investors to tailor their calendar spread strategies according to their risk tolerance and market outlook.
Calendar Spread Option Strategy #1
To create a profitable calendar spread strategy using options on Broadcom Inc. (AVGO), we will employ a combination of buying a put option and selling a call option with different expiration dates. The goal is to minimize assignment risk by selecting options near strike prices that are 2% above or below the current stock price, while capitalizing on time decay. Here's the structured approach:
Strategy Overview:
- Objective: Profit from time decay while minimizing assignment risk.
- Options Selection:
- Buy a Put: Focus on longer expiration dates with strikes near 2% below the current stock price to capitalize on potential downside movements.
- Sell a Call: Select shorter expiration dates with strikes near 2% above the current stock price to benefit from time decay and reduced assignment risk.
Five Calendar Spread Strategies:
- Short-Term vs. Medium-Term:
- Buy Put (January $98): Strike at 2% below assumed $100 stock price, longer expiration to allow potential ITM without immediate assignment.
-
Sell Call (December $102): Near-term strike at 2% above, benefiting from high theta decay.
-
Near-Term vs. Long-Term:
- Buy Put (February $98): Longer expiration for potential downside movement.
-
Sell Call (January $102): Shorter term to maximize time decay benefits.
-
Medium-Term vs. Extended-Term:
- Buy Put (March $98): Provides more time for the strike to become ITM.
-
Sell Call (February $102): Balances time decay with moderate expiration.
-
Long-Term vs. Extended-Term:
- Buy Put (April $98): Longer duration to increase probability of being ITM.
-
Sell Call (March $102): Slightly longer call sale to still benefit from decay.
-
Extended-Term vs. Very Long-Term:
- Buy Put (May $98): Maximizes time for potential movement.
- Sell Call (April $102): Balances with a slightly extended call expiration.
Risk and Reward Assessment:
- Delta Management: Ensure combined delta is neutral or slightly negative to avoid significant exposure to stock price movements.
- Theta Decay Benefit: Focus on the sold call's high theta decay for consistent profit from time erosion.
- Assignment Mitigation: Choose strikes close to current price to reduce likelihood of shares being assigned.
Conclusion:
The most profitable strategy is the one that effectively combines high theta decay in the sold call with a longer-dated put to exploit potential downside movements. This balance maximizes profitability while minimizing assignment risk, aligning with the strategic use of options Greeks for optimal outcomes.
Calendar Spread Option Strategy #2
Analysis of Calendar Spread Options Strategy for Broadcom Inc. (AVGO)
A calendar spread options strategy involves simultaneously selling one option and buying another option with the same strike price but different expiration dates. This strategy can be profitable if the market conditions favor a limited move in the underlying stock within the time frame of the trade. In this case, we are focusing on selling a put option at one expiration date and buying a call option at a different calendar date. The goal is to identify the most profitable combination while minimizing the risk of having shares assigned.
To minimize the risk of shares being assigned, it is crucial to focus on options that are out-of-the-money (OTM) or near-the-money (NTM). OTM options have less intrinsic value and higher extrinsic value, making them more sensitive to price changes in the underlying stock. By targeting a 2% move over or under the current stock price, we can identify strike prices that align with this objective.
The Greeksdelta, gamma, theta, vega, and rhoare critical in quantifying the risk and reward of each option. Delta measures the sensitivity of the options price to changes in the underlying stock price, while gamma measures the rate of change of delta. Theta represents the time decay of the option, and vega measures sensitivity to volatility. Rho measures sensitivity to interest rates.
Given these considerations, lets analyze five potential calendar spread options strategies for AVGO:
1. Near-Term Call Option (Short Put)
- Expiration Date: January 2024
- Strike Price: $300 (2% above the current stock price)
- Greeks: High delta and gamma indicate sensitivity to price changes, while high theta reflects significant time decay.
- Profit Potential: If the stock price remains stable or moves slightly upward within the near-term expiration, the short put will expire worthless, and the trader will keep the premium received. However, if the stock price declines significantly, the put option may become in-the-money (ITM), increasing the risk of assignment.
2. Long-Term Call Option
- Expiration Date: December 2024
- Strike Price: $306 (2% below the current stock price)
- Greeks: Lower delta and gamma indicate reduced sensitivity to price changes, while lower theta reflects slower time decay. Vega is higher due to the longer expiration.
- Profit Potential: By buying a call option with a longer expiration date, the trader can benefit from increased volatility or a sustained upward trend in the stock price. The long-term nature of this option allows for more significant price movements, but it also exposes the trader to greater risk if the market moves against the position.
3. Calendar Spread: Near-Term Put and Long-Term Call
- Expiration Dates: January 2024 (put) and December 2024 (call)
- Strike Price: $303 (near-the-money)
- Greeks: The short put has high delta and gamma, while the long call has moderate delta and higher vega. Theta is significant for both options due to their different expiration dates.
- Profit Potential: This strategy combines the benefits of selling a near-term put for premium income with buying a long-term call to capitalize on potential upward movements in the stock price. If the stock price remains stable or moves moderately upward, this spread can generate profit.
4. Calendar Spread: Long-Term Put and Near-Term Call
- Expiration Dates: December 2024 (put) and January 2024 (call)
- Strike Price: $305
- Greeks: The long put has lower delta and gamma, while the near-term call has higher theta. Vega is moderate for both options.
- Profit Potential: This strategy involves holding a long put with significant time decay and pairing it with a near-term call to capitalize on potential downward movements in the stock price. However, the high theta of the near-term call limits the profitability.
5. Targeted Calendar Spread
- Expiration Dates: January 2024 (put) and December 2024 (call)
- Strike Price: $300
- Greeks: The short put has high delta and gamma, while the long call has moderate delta and higher vega. Theta is significant for both options.
- Profit Potential: This strategy targets a 2% move in the stock price. If the stock price moves upward by 2%, the long call will gain intrinsic value, offsetting the premium paid for buying it. If the stock price remains stable or moves downward slightly, the short put will expire worthless, and the trader will keep the premium received.
Conclusion
The most profitable calendar spread strategy depends on market conditions, volatility, and the traders risk tolerance. By focusing on strike prices that align with a 2% move in the stock price and selecting expiration dates that match the expected time frame, traders can optimize their returns while managing risks associated with assignment and time decay.
In summary, the strategies outlined above provide a framework for identifying profitable calendar spread options for AVGO. Traders should carefully analyze the Greeks and market conditions before implementing any strategy to ensure optimal results.
Similar Companies in Semiconductors:
Report: Advanced Micro Devices, Inc. (AMD), Advanced Micro Devices, Inc. (AMD), Report: Micron Technology, Inc. (MU), Micron Technology, Inc. (MU), Report: Intel Corporation (INTC), Intel Corporation (INTC), Report: Taiwan Semiconductor Manufacturing Company Limited (TSM), Taiwan Semiconductor Manufacturing Company Limited (TSM), Report: Marvell Technology, Inc. (MRVL), Marvell Technology, Inc. (MRVL), Report: NVIDIA Corporation (NVDA), NVIDIA Corporation (NVDA), Report: Qualcomm Incorporated (QCOM), Qualcomm Incorporated (QCOM), Skyworks Solutions Inc. (SWKS), Qorvo Incorporated (QRVO), Report: Texas Instruments Incorporated (TXN), Texas Instruments Incorporated (TXN), Arista Networks Inc. (ANET), Juniper Networks Inc. (JNPR)
https://www.youtube.com/watch?v=c4-lta_P7qw
https://www.fool.com/investing/2025/02/12/should-you-forget-amd-and-buy-2-tech-stocks-instea/
https://www.fool.com/investing/2025/02/14/should-you-forget-amazon-why-these-unstoppable-sto/
https://finance.yahoo.com/news/worth-investing-broadcom-inc-avgo-143011178.html
https://finance.yahoo.com/news/broadcom-inc-avgo-among-best-145741744.html
https://seekingalpha.com/article/4757169-our-top-10-dividend-high-growth-stocks-february-2025
https://finance.yahoo.com/m/4db2557d-b9cf-3c60-8c1c-ae63b5d3cd19/broadcom%2C-axon-lead-five.html
https://finance.yahoo.com/news/broadcom-tsmc-eye-possible-intel-021925974.html
https://finance.yahoo.com/news/broadcom-weighs-possible-deal-intel-023858179.html
https://seekingalpha.com/article/4758750-technology-has-come-a-long-way-and-its-still-going-strong
https://www.fool.com/investing/2025/02/16/broadcom-vs-advanced-micro-devices-wall-street-see/
https://finance.yahoo.com/m/004c63b5-1bb2-30f1-b5e9-a46f7a7e27f0/broadcom%2C-tsmc-eye-deals-for.html
https://www.sec.gov/Archives/edgar/data/1730168/000173016824000099/avgo-20240804.htm
Copyright © 2025 Tiny Computers (email@tinycomputers.io)
Report ID: zqc3wH
Cost: $0.00000
https://reports.tinycomputers.io/AVGO/AVGO-2025-02-16.html Home