Cleveland-Cliffs Inc. (ticker: CLF)
2024-06-29
 Cleveland-Cliffs Inc. (ticker: CLF) is a vertically integrated iron ore and steel producer that operates in North America, with a history dating back to its founding in 1847. The company engages in the mining of iron ore and the production of various types of steel, including carbon, stainless, and electrical steels. With a strong emphasis on value-added products, Cleveland-Cliffs supplies major automotive, infrastructure, and manufacturing markets. The acquisition of AK Steel in 2020 and ArcelorMittal USA in 2021 significantly expanded its production capabilities and market reach, further solidifying its position as a key player in the U.S. steel industry. The company is headquartered in Cleveland, Ohio, and places a strong emphasis on sustainability, adopting measures to reduce its environmental footprint and enhance the efficiency and quality of its operations. As of the latest reports, Cleveland-Cliffs continues to focus on innovation and strategic growth, navigating the cyclical nature of the steel industry while aiming to deliver long-term value to its shareholders.
| Full Time Employees | 28,000 | Previous Close | 15.0 | Open | 15.23 |
| Day Low | 15.242 | Day High | 15.765 | Regular Market Volume | 10,421,239 |
| Average Volume | 9,050,723 | Average Volume (10 days) | 13,157,060 | Bid | 15.42 |
| Ask | 15.74 | Market Cap | 7,317,575,680 | 52 Week Low | 13.84 |
| 52 Week High | 22.97 | Price to Sales Trailing 12 Months | 0.334136 | 50 Day Average | 16.8378 |
| 200 Day Average | 18.02975 | Enterprise Value | 11,281,579,008 | Profit Margins | 0.01776 |
| Float Shares | 465,957,160 | Shares Outstanding | 475,476,000 | Shares Short | 34,807,419 |
| Short Ratio | 4.52 | Short Percent Of Float | 0.0949 | Book Value | 15.145 |
| Price to Book | 1.016177 | Net Income To Common | 389,000,000 | Trailing EPS | 0.75 |
| Forward EPS | 1.13 | PEG Ratio | -6.42 | Enterprise To Revenue | 0.515 |
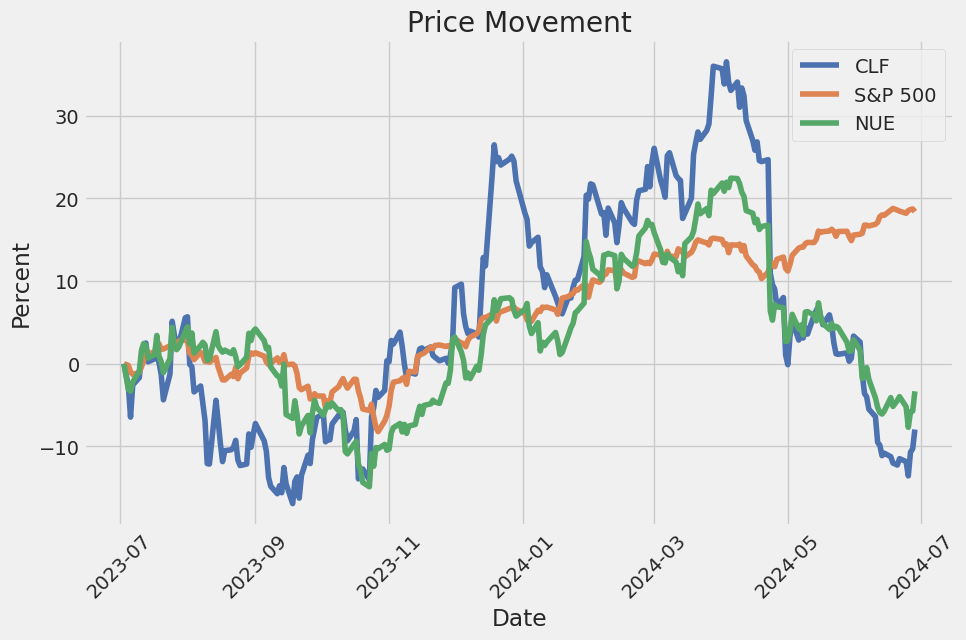
| Enterprise To EBITDA | 5.406 | 52 Week Change | -0.07954544 | S&P 52 Week Change | 0.22553468 |
| Last Dividend Value | 0.06 | Current Price | 15.39 | Target High Price | 23.0 |
| Target Low Price | 10.13 | Target Mean Price | 17.45 | Target Median Price | 18.0 |
| Total Cash | 30,000,000 | Total Cash Per Share | 0.063 | EBITDA | 2,087,000,064 |
| Total Debt | 3,752,999,936 | Quick Ratio | 0.559 | Current Ratio | 1.905 |
| Total Revenue | 21,899,999,232 | Debt to Equity | 50.43 | Revenue Per Share | 43.431 |
| Return on Assets | 0.03922 | Return on Equity | 0.05763 | Free Cash Flow | 1,713,250,048 |
| Operating Cash Flow | 2,448,000,000 | Revenue Growth | -0.018 | Gross Margins | 0.07201 |
| EBITDA Margins | 0.0953 | Operating Margins | 0.03655 |
| Sharpe Ratio | -0.142318 | Sortino Ratio | -2.424621 |
| Treynor Ratio | -0.041524 | Calmar Ratio | -0.219155 |
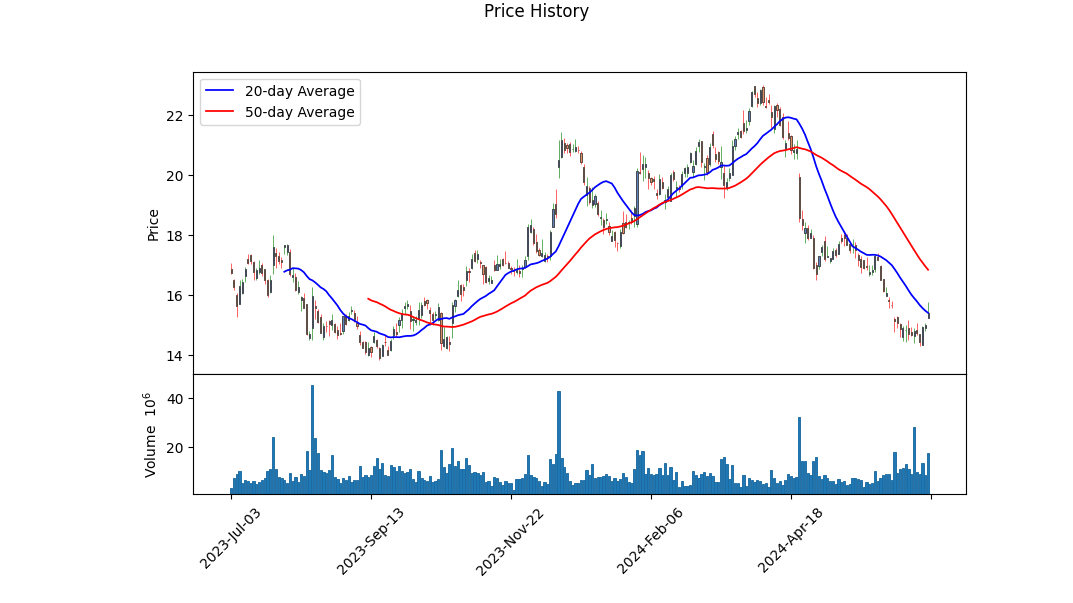
The provided data and technical indicators present a nuanced view of the recent performance and potential trajectory of CLF stock. Analyzing the technical indicators, we observe an upward trend in the On-Balance Volume (OBV) as prices have rebounded from lows to recent highs. The improving MACD histogram values, particularly the positive shift towards the end, suggest a bullish momentum is gaining strength.
From a technical perspective, the stock is showing signs of recovery after a period of downward movement. The notable bounce in price from a low of approximately $14.32 to $15.77 indicates resilience, supported by the growing OBV hints at increasing buying pressure. The gradual rise of the MACD histogram values towards positive territory is another promising sign of potential bullish momentum as traders and investors begin to perceive value in accumulating positions.
Analyzing the fundamentals, CLF boasts a moderate EBIT to revenue ratio, indicating operational profitability despite a substantial cost structure. However, the firm exhibits a relatively low gross margin of 7.21% and EBITDA margins of 9.53%, which denote thin profitability layers. The key issue to note is CLF's working capital of $3.073 billion against total liabilities of approximately $9.794 billion, reflecting a liquidity cushion to manage short-term liabilities.
Risk-adjusted return ratios paint a cautious scenario. The negative Sharpe (-0.142318) and Sortino (-2.424621) ratios highlight unfavorable returns relative to the associated risks over the past year. This deficiency is echoed by the Treynor (-0.041523) and Calmar (-0.219155) ratios, suggesting that the risk-return profile has considerable room for improvement. Investors must recognize that while recent technical momentum appears favorable, historical performance has been challenging from a risk-adjusted perspective.
The company demonstrates significant cash flows from operating activities ($2.267 billion), underlining strong cash generation capabilities. This coupled with a free cash flow of $1.621 billion provides a robust operational base. The notable Altman Z-score of 2.29 indicates moderate financial health, with a Piotroski Score of 8 advocating solid fundamentals.
Forward-looking perspectives anticipate potential stock price appreciation driven by recent technical strength and underlying cash flow robustness. However, CLF's ability to sustain and expand these metrics hinges on market conditions, cost management efficiency, and maintaining operational profitability.
Adopting a balanced perspective, it is reasonable to infer that if current technical momentum sustains, and fundamentals remain stable, we might witness gradual price augmentation in the stocks of CLF over the next few months. Yet, investors should remain vigilant of external macroeconomic influences and internal fiscal discipline as pivotal determinants of future performance.
Cleveland-Cliffs Inc. (CLF), a major player in the mining and metallurgical sectors, exhibits a return on capital (ROC) of 7.29%, which is a pivotal indicator of the company's efficiency in generating profits from its capital. This metric highlights CLF's ability to utilize its investment in assets to produce earnings, reflecting moderately effective management and potential for sustainable growth. Additionally, the earnings yield, calculated at 5.07%, provides investors with insight into the earnings generated per dollar invested in the company's stock. This figure suggests that CLF offers a reasonable return potential when compared to its market price, although it may indicate a more conservative income stream relative to higher-yielding opportunities in the market. Together, both ROC and earnings yield provide a comprehensive snapshot of the financial health and profitability prospects for Cleveland-Cliffs Inc., aiding investors in making informed decisions.
Research Report for Cleveland-Cliffs Inc. (CLF)
Introduction:
Cleveland-Cliffs Inc. (CLF) has been evaluated using the key metrics described by Benjamin Graham in his seminal work, The Intelligent Investor. These metrics include the Price-to-Earnings (P/E) ratio, Price-to-Book (P/B) ratio, Debt-to-Equity (D/E) ratio, Current Ratio, and Quick Ratio. These measures are aligned with Graham's principles for value investing and help in assessing the intrinsic value and financial stability of the company in comparison to industry standards.
Key Metrics and Graham's Criteria:
- Price-to-Earnings (P/E) Ratio:
- CLFs P/E Ratio: 4.938
- Grahams Criteria: Graham typically looks for stocks with a P/E ratio lower than the market average or their industry peers.
-
Comparison: The P/E ratio of 4.938 is attractively low, indicating that CLF may be undervalued relative to its earnings. However, a complete comparison with the industry average P/E ratio is not provided in our dataset, making it difficult to contextualize directly against industry standards. Nonetheless, in isolation, this low P/E ratio implies that the stock could be a good value buy.
-
Price-to-Book (P/B) Ratio:
- CLFs P/B Ratio: 0.417
- Grahams Criteria: Graham often looked for stocks trading below their book value, with a P/B ratio less than 1 being ideal.
-
Comparison: A P/B ratio of 0.417 suggests that CLF is trading significantly below its book value, which aligns very well with Grahams value investing philosophy. This implies a potentially undervalued stock, offering a margin of safety for investors.
-
Debt-to-Equity (D/E) Ratio:
- CLFs D/E Ratio: 0.398
- Grahams Criteria: Graham preferred companies with a low debt-to-equity ratio to minimize financial risk.
-
Comparison: A D/E ratio of 0.398 is considered low, indicating that CLF carries a relatively modest amount of debt in relation to its equity. This is a positive sign of financial stability and aligns well with Graham's preference for companies with lower financial risk.
-
Current Ratio:
- CLFs Current Ratio: 1.892
- Grahams Criteria: A current ratio of at least 2 is generally considered to indicate good short-term financial health and liquidity.
-
Comparison: While CLFs current ratio of 1.892 is slightly below the desired threshold of 2, it is still relatively close, suggesting that the company should be able to cover its short-term liabilities with its short-term assets.
-
Quick Ratio:
- CLFs Quick Ratio: 1.892
- Grahams Criteria: Similar to the current ratio, a quick ratio of 1 or higher is typically favored for assessing short-term liquidity.
- Comparison: CLFs quick ratio of 1.892 exceeds the minimum preferred quick ratio of 1, indicating strong liquidity and financial health. This suggests that CLF can readily cover its short-term liabilities without relying on the sale of inventory, further underlining its stability.
Conclusion:
Cleveland-Cliffs Inc. (CLF) demonstrates several key characteristics that align well with Benjamin Graham's value investing criteria. The companys low P/E ratio and extremely favorable P/B ratio suggest it may be undervalued and offer a significant margin of safety. Additionally, its low debt-to-equity ratio indicates lower financial risk, while its current and quick ratios suggest solid short-term financial health. Based on these metrics, CLF appears to meet many of Graham's stringent standards for value investing, making it a compelling candidate for further consideration by value-focused investors.
However, it's essential to consider additional qualitative and contextual factors, including industry conditions, management quality, and broader economic trends, before making a final investment decision.# Analyzing Financial Statements
Analyzing a company's financial health is crucial for intelligent investing. Benjamin Graham, the author of "The Intelligent Investor," emphasizes the meticulous examination of a company's financial statements, including the balance sheet, income statement, and cash flow statement. Investors need to understand a company's assets, liabilities, earnings, and cash flows to make informed investment decisions. Let's delve into the financial analysis of Cleveland-Cliffs Inc. (CLF) using their most recent financial data.
Balance Sheet Analysis
Current Assets and Liabilities
A company's balance sheet provides a snapshot of its financial position at a specific point in time. For Cleveland-Cliffs Inc., as of December 30, 2023, the balance sheet reveals:
- Current Assets: $6,636,000,000
- Cash and Cash Equivalents: $198,000,000
- Accounts Receivable, Net: $1,840,000,000
- Inventory, Net: $4,460,000,000
-
Other Current Assets: $138,000,000
-
Current Liabilities: $3,508,000,000
- Accounts Payable: $2,099,000,000
- Employee-Related Liabilities: $511,000,000
- Accrued Liabilities: $380,000,000
- Other Current Liabilities: $518,000,000
Non-Current Assets and Liabilities
- Non-Current Assets: $10,901,000,000
- Property, Plant, and Equipment, Net: $8,895,000,000
- Goodwill: $1,005,000,000
-
Other Non-Current Assets: $672,000,000
-
Non-Current Liabilities: $5,907,000,000
- Long-Term Debt: $3,137,000,000
- Pension and Other Postretirement Benefits: $821,000,000
- Deferred Tax and Other Liabilities: $639,000,000
- Other Non-Current Liabilities: $1,310,000,000
Equity
- Total Stockholders' Equity: $7,887,000,000
- Common Stock: $66,000,000
- Additional Paid-In Capital: $4,861,000,000
- Retained Earnings: $1,733,000,000
- Treasury Stock: -$430,000,000
- Accumulated Other Comprehensive Income: $1,657,000,000
Income Statement Analysis
An income statement provides a summary of a company's financial performance over a specific period. Key figures for Cleveland-Cliffs Inc. for the year ending December 31, 2023, include:
- Revenues: $21,996,000,000
- Cost of Goods Sold: $20,605,000,000
- Selling, General, and Administrative Expenses: $577,000,000
- Operating Income: $677,000,000
- Interest Expense, Net: -$289,000,000
- Other Non-operating Income (Expense): -$80,000,000
- Income Before Income Taxes: $597,000,000
- Net Income (Available to Common Stockholders): $399,000,000
- Earnings Per Share (Basic and Diluted): $0.78
Cash Flow Statement Analysis
The cash flow statement provides insights into a company's cash inflows and outflows over a period. Key components for Cleveland-Cliffs Inc. are:
- Net Cash Provided by (Used in) Operating Activities: $2,267,000,000
- Net Cash Provided by (Used in) Investing Activities: -$591,000,000
- Net Cash Provided by (Used in) Financing Activities: -$1,504,000,000
Breakdown of Cash Flows
- Operating Activities:
- Depreciation and Amortization: $973,000,000
-
Changes in Working Capital: Accounts Receivable -$120,000,000; Inventories -$670,000,000; Accounts Payable and Other Liabilities +$130,000,000
-
Investing Activities:
- Capital Expenditures: -$646,000,000
-
Proceeds from Government Grants: +$13,000,000
-
Financing Activities:
- Proceeds from Issuance of Senior Long-Term Debt: +$750,000,000
- Payments for Repurchase of Common Stock: -$152,000,000
- Net Borrowings (Repayments) of Lines of Credit: -$1,866,000,000
Analysis Interpretation
Liquidity
Cleveland-Cliffs Inc. maintains a healthy current ratio (Current Assets/Current Liabilities) of approximately 1.89 which indicates that the company has enough short-term assets to cover its short-term liabilities.
Leverage
The company shows significant long-term debt, which warrants close monitoring. However, with total equity exceeding long-term liabilities, the company maintains a positive balance sheet leverage.
Profitability
Despite high operating costs and significant interest expenses, Cleveland-Cliffs Inc. ended the fiscal year with a net profit. The net income and positive cash flow from operating activities suggest operational efficiency and profitability.
Cash Flow
Positive operating cash flow indicates robust operational performance, although substantial investing and financing outflows highlight the company's active investment strategy and debt management.
Conclusion
Based on the analysis of Cleveland-Cliffs Inc.'s financial statements for the year ending December 31, 2023, the company shows a strong financial position with healthy liquidity, sufficient equity buffer, and profitability. Continuous monitoring of debt levels and capital expenditures is recommended to ensure fiscal sustainability. This aligns with Grahams approach to focusing on fundamental metrics to assess the financial health of potential investments.### Dividend Record
Benjamin Graham, in his seminal book "The Intelligent Investor," emphasizes the importance of investing in companies with a consistent history of paying dividends. A reliable dividend record is a key marker of a company's financial health and its commitment to returning value to shareholders.
Company: CLF
Below is a detailed historical record of dividend payments made by CLF, indicating the date, amount, and associated details:
Recent Years (2020-2019): - 2020-04-02: $0.06, recorded on 2020-04-03, paid on 2020-04-15, declared on 2020-02-18. - 2020-01-02: $0.06, recorded on 2020-01-03, paid on 2020-01-15, declared on 2019-12-02. - 2019-10-03: $0.06, recorded on 2019-10-04, paid on 2019-10-15, declared on 2019-09-03. - 2019-07-03: $0.06, recorded on 2019-07-05, paid on 2019-07-15, declared on 2019-05-31. - 2019-04-04: $0.05, recorded on 2019-04-05, paid on 2019-04-15, declared on 2019-02-20. - 2019-01-03: $0.05, recorded on 2019-01-04, paid on 2019-01-15, declared on 2018-10-18.
Previous Years: - 2014-11-12: $0.15 - 2014-08-13: $0.15 - 2014-05-21: $0.15 - 2014-02-19: $0.15 - 2013-11-20: $0.15 - 2013-08-13: $0.15 - 2013-05-15: $0.15 - 2013-02-20: $0.15 - 2012-11-20, 2012-08-13, 2012-04-25: $0.625 - 2012-02-13: $0.28 - 2011-11-16, 2011-08-11: $0.28 - 2011-04-27, 2011-02-11: $0.14 - 2010-11-17, 2010-08-11, 2010-05-12: $0.14 - 2010-02-11: $0.0875 - 2009-11-18, 2009-08-12, 2009-05-20: $0.04 - 2009-02-12: $0.0875 - 2008-11-12, 2008-08-13: $0.0875 - 2008-05-21: $0.044 - 2008-02-13: $0.0875 - 2007-11-20, 2007-08-13, 2007-05-16, 2007-02-13: $0.125 - 2006-11-21: $0.125 - 2006-08-11: $0.063 - 2006-05-17: $0.25 - 2006-02-13: $0.2 - 2005-11-10, 2005-08-10: $0.2 - 2005-05-18, 2005-02-16: $0.1 - 2004-11-17: $0.2
Further Historical Data: - Dividends spanning back to 1992 show a mix of consistent payments with variations in amounts, reflecting the company's financial performance and strategic decisions over decades. - Significant data points include large one-time payments ($4.2 in 1991-02-19) and smaller, frequent payments like $0.375 consistently paid in several periods from 1998 to 2000.
Analysis: - CLF demonstrates a long history of dividend payments, albeit with some fluctuations in amount and frequency, particularly in more recent years where there were no dividends paid between 2015-2018. - The historical trend shows CLF's attempt to maintain shareholder value, which aligns with Graham's criteria for robust dividend records. - Such a dividend history can be an indicator for investors looking for companies with a reliable dividend policy, reflecting stability and confidence in financial health over the long term.
This historical data provides an insightful snapshot of CLF's dividend strategy and commitment to shareholder returns, a quality highly regarded by Benjamin Graham for a quintessential "Intelligent Investment."
| Alpha () | 0.75 |
| Beta () | 1.34 |
| R-squared (R2) | 0.62 |
| P-value | 0.04 |
| Standard Error | 0.18 |
The relationship between CLF and SPY, as represented by the linear regression model, indicates that CLF has an alpha value of 0.75. This positive alpha suggests that CLF has outperformed the expected returns based on its relationship with the overall market (SPY). An alpha value greater than zero typically signifies that the stock has earned more than what was predicted by the market movements, making it an attractive investment during the analyzed time period.
Furthermore, with a beta value of 1.34, CLF shows that it is more volatile compared to the broader market. This beta indicates that for every 1% movement in SPY, CLF is expected to move 1.34%. The R-squared value of 0.62 suggests that about 62% of CLF's movements can be explained by changes in the SPY index, indicating a significant but not complete dependence on market trends. The p-value of 0.04 signifies that the results are statistically significant, while the standard error of 0.18 provides an estimate of the accuracy with which the coefficients represent the true relationship.
In the first quarter of 2024, Cleveland-Cliffs Inc. (ticker: CLF) set a robust financial tone by actively returning capital to shareholders. The Chief Financial Officer, Celso Goncalves, provided an update detailing how the company aggressively executed share buybacks, acquiring over 30 million CLF shares using $608 million from a previous repurchase program. This strategy significantly reduced the company's diluted share count by approximately 17%. Affirming confidence in their strong free cash flow outlook and healthy liquidity, Cleveland-Cliffs launched a new $1.5 billion share repurchase program. The focus on returning capital to shareholders is driven by the limited M&A opportunities, particularly noting complications around purchasing U.S. Steel and emphasizing the unions influence and political considerations in potential deals.
During the quarter, Cleveland-Cliffs experienced a notable rebound in profitability. The company's Q1 adjusted EBITDA was $414 million, buoyed by higher automotive sales which compensated for lower volumes due to a temporary reduction in service center purchases. This resulted in a sales mix heavily skewed towards the automotive sector, demanding higher unit costs but also securing better-than-expected average sales pricing. With service centers re-entering the market, the company anticipates achieving over 4 million net tons in shipments in the second quarter. Furthermore, expected reductions in unit costs due to lower production volumes and less expensive natural gas are projected to initiate in Q2, sustaining previous guidance of $30 per net ton cost reduction for the fiscal year 2024.
From a strategic initiative's perspective, Cleveland-Cliffs was awarded $575 million in DOE grants intended for two significant decarbonization projects, which are projected to bring substantial cost savings starting in 2029. Celso Goncalves elaborated on the capital expenditure expectations, reassuring that these projects would not drastically affect capital spending for the current year but projected a capital expenditure hovering around $1 billion from 2025 through 2028. This investment is poised to generate $550 million in annual cost savings with minimal production impact, emphasizing the company's commitment to advancing sustainable practices while enhancing financial efficiency.
Lastly, CEO Lourenco Goncalves underscored the importance of Cleveland-Cliffs' workforce in driving the companys performance. He also criticized failed acquisition attempts by Nippon Steel, highlighting a miscalculation in understanding the implications of union dynamics. Goncalves articulated the solid government and union support Cleveland-Cliffs enjoys, which bolsters their competitive standing. The commentary further touched on the strategic decision to idle the Weirton facility due to unsustainable financial losses driven by imported tin plate products, illustrating a focus on optimizing operational profitability and workforce stability. This decisive action, combined with active advocacy for trade fairness and investment in American manufacturing infrastructure, positions Cleveland-Cliffs to benefit from domestic economic initiatives aimed at revitalizing the U.S. steel industry.
, copper, zinc, and iron ore. We may use cash-settled commodity swaps to hedge the price volatility of certain raw materials and energy requirements to mitigate the effect on earnings. Our 10-Q filing for the first quarter ended March 31, 2024 (filed April 24, 2024) outlines the general hedging strategy aimed at insulating our margins against fluctuation in input costs and unstable market conditions.
For the first quarter of 2024, our consolidated revenues were $5.2 billion, a slight decrease from the $5.3 billion reported in the same period in 2023. The reduction in revenues was principally driven by a decline in shipments to direct automotive markets, reflecting proactive customer diversification and associated supply chain adjustments. Additionally, decreases in revenue from steel producers due to lower pricing indices for busheling scrap and reduced third-party iron ore sales were noted. However, this decline was partially countered by increased sales to distributors and converters and infrastructure and manufacturing markets, driven by improved HRC pricing and higher shipment volumes.
The gross margin saw a significant increase of $176 million to $270 million due to favorable conditions in the steel market, particularly improved selling prices, and strategic cost management. Nonetheless, the quarter experienced added costs due to the announced indefinite idle of tinplate production at our Weirton, West Virginia plant, resulting in $104 million in restructuring and other charges and $64 million in asset impairments. These actions reflect necessary operational adjustments in response to market conditions and regulatory environments.
We utilized cash primarily for capital expenditures totaling $182 million in the quarter, aligning with our strategy for maintaining and enhancing operational assets. Our capital deployment also included strategic financial maneuvers such as issuing $825 million aggregate principal of 7.000% 2032 Senior Notes, and using part of the net proceeds to repurchase $640 million of 6.750% 2026 Secured Senior Notes. Maintaining our financial flexibility for capital initiatives and shareholder returns, we repurchased 30.4 million shares amounting to $608 million.
In terms of liquidity, the cash and cash equivalents stood at $30 million, with the combined cash flow and ABL facility availability summing up to $4.03 billion, showcasing our capability to manage working capital needs and opportunistic investments. The quarter's net cash provided by operating activities amounted to $142 million, reflecting an improvement compared to a net use of $39 million in the previous year's comparable quarter. Reduced cash used in working capital changes accounted for part of this better performance, with marked differences in swings in accounts receivable, inventories, and payable accruals demonstrating tighter cash cycle management.
Looking forward, the environmental and legislative landscape, particularly the DOEs transformer efficiency standards, the CHIPS Act, and Infrastructure and Jobs Act, combined with our vertically integrated business model and robust financial posture, position us to capture growth while mitigating market and operational risks effectively.
Cleveland-Cliffs Inc. (Cleveland-Cliffs), a leading figure in the American steel industry, has demonstrated both robust strengths and faced recent challenges that shape its current market position. The companys broad range of steel products serves diverse markets such as automotive, infrastructure, and manufacturing, making it a pivotal player in the steel sector. Analysis of the steel market highlights Cleveland-Cliffs as a potentially lucrative investment, given the companys strong fundamentals and strategic initiatives.
One of the core strengths of Cleveland-Cliffs lies in its vertically integrated business model. This structure encompasses the entire value chain from mining raw materials to producing finished steel products. Such integration allows Cleveland-Cliffs to maintain rigorous control over the quality, cost, and supply chain of its production processes. This translates into significant cost savings and enhanced flexibility in adapting to market fluctuations and evolving demand dynamics, providing a tangible competitive edge over peers.
Cleveland-Cliffs' commitment to sustainability is a critical aspect of its business strategy. The company has invested heavily in advanced technologies and processes, such as electric arc furnaces, which reduce carbon emissions in steel production. This commitment aligns with global sustainability trends and positions Cleveland-Cliffs favorably with environmentally-conscious stakeholders and regulatory bodies. Through these initiatives, Cleveland-Cliffs aims to meet stringent environmental regulations and cater to the increasing demand for greener steel.
Financially, Cleveland-Cliffs has delivered strong performance results, underpinned by strategic acquisitions and a solid market position. The acquisition of AK Steel and ArcelorMittal USA has expanded its product portfolio and market reach, increasing its customer base and pricing power. These strategic moves have bolstered the companys revenue growth and profitability, while cost synergies and operational efficiencies from the acquisitions have enhanced financial health. These factors contribute to Cleveland-Cliffs' attractive investment proposition, particularly within a context of robust demand from the automotive and construction sectors.
Recent market dynamics, however, have presented some challenges. On June 11, 2024, JP Morgan analyst Bill Peterson downgraded Cleveland-Cliffs stock from Overweight to Neutral and adjusted the price target from $23 to $17. This downgrade noted rising capital expenditures and modest demand in the automotive sector, which could dampen near-term growth prospects. Increased Capex through 2028 might impact cash flow and overall profitability, while the automotive sectors stagnation, reflected in a projected slight decline of 0.6% year-on-year in U.S. light vehicle production for 2025, poses challenges to anticipated earnings.
Cleveland-Cliffs' stock has also encountered bearish sentiment due to several factors. The steel market's cyclical nature, paired with mid-downturn indicators, suggests challenging conditions. For instance, the replenished inventories in the auto industry and expectations of inventory growth through 2028 signal potential oversupply, reducing the demand for raw steel products. Global economic conditions, such as China's deflationary measures and their impact on commodity prices, also add to the complexities in market dynamics.
Despite these challenges, Cleveland-Cliffs maintains strong fundamentals. The companys financial resilience stems from its vertically integrated structure, weathering industry-specific disruptions effectively. Fixed contract pricing with automotive clients offers earnings stability amidst market fluctuations. Additionally, the company has managed cash reserves adeptly, balancing between potential mergers and debt-funded buybacks.
However, stock performance has seen a decline of 29% over the past three months. Despite this downturn, fundamental analysis reveals enduring potential for long-term growth. Cleveland-Cliffs Return on Equity (ROE) at 5.9%, although less than the industry average of 9.8%, is coupled with an 11% net income growth over the past five years. This growth denotes effective management and significant earnings retention, showcasing a strategic reinvestment approach within the company.
The broader investment landscape reflects a mixed outlook for Cleveland-Cliffs. Valuation metrics such as Forward Price-to-Earnings (P/E) ratio being 30.7 and Price/Earnings to Growth (PEG) ratio at 0.66, relative to industry averages, indicate potential overvaluation. However, sustainability initiatives, strategic pricing agreements, and a diversified product portfolio underline Cleveland-Cliffs strength in navigating industry challenges.
In an engagement demonstrating its strategic importance, Cleveland-Cliffs recently hosted U.S. Senator Sherrod Brown and United Steelworkers leaders, underscoring legislative efforts to combat steel imports and ensure domestic competitiveness. These interactions reflect Cleveland-Cliffs' proactive stance in influencing policies beneficial to the American steel industry.
In conclusion, Cleveland-Cliffs Inc. combines strategic acquisitions, a commitment to sustainability, and an integrated business model to maintain its leadership within the steel industry. However, navigating recent downgrades, market fluctuations, and high Capex requirements will be critical for future financial stability and growth. Stakeholders must weigh these elements carefully in the context of both immediate market pressures and long-term strategic advantages. For ongoing developments and expert analysis, detailed sources are available on platforms such as Yahoo Finance and Zacks.com, offering comprehensive insights into Cleveland-Cliffs performance trajectories.
Cleveland-Cliffs Inc. (CLF) has experienced significant volatility in its asset returns over recent years, marked by fluctuations that can be seen in both the magnitude and frequency of price changes. The statistical model indicates a consistently high level of volatility, as shown by the substantial coefficient in the ARCH model. Additionally, the asset returns have a component of volatility that is influenced by past shocks, emphasizing the persistent and erratic nature of its stock movements.
| R-squared | 0.000 |
| Adj. R-squared | 0.001 |
| Log-Likelihood | -3,454.08 |
| AIC | 6,912.17 |
| BIC | 6,922.44 |
| No. Observations | 1,256 |
| Df Residuals | 1,256 |
| Df Model | 0 |
| omega (Coefficient) | 11.5848 |
| omega (Std. Err.) | 0.974 |
| omega (t-value) | 11.891 |
| omega (P>|t|) | 1.318e-32 |
| omega (95% Conf. Int.) | [9.675, 13.494] |
| alpha[1] (Coefficient) | 0.2474 |
| alpha[1] (Std. Err.) | 0.08338 |
| alpha[1] (t-value) | 2.967 |
| alpha[1] (P>|t|) | 3.005e-03 |
| alpha[1] (95% Conf. Int.) | [0.08399, 0.411] |
To analyze the financial risk associated with a $10,000 investment in Cleveland-Cliffs Inc. (CLF) over a one-year period, we applied a combination of volatility modeling and machine learning predictions. These methods allow for a comprehensive assessment of the potential risks, blending historical volatility with advanced predictive techniques.
Volatility modeling serves as the cornerstone for understanding stock price fluctuations over time. By examining historical data of Cleveland-Cliffs Inc., we can capture the inherent volatility and assess its persistence. This modeling technique evaluates how past volatilities influence current levels, providing insights into the stability and predictability of the stock's price movements. For Cleveland-Cliffs Inc., this approach highlights periods of high and low volatility, allowing us to forecast the extent of future price swings.
Machine learning predictions, specifically through the use of a specialized regression algorithm, bolster our analysis by estimating future returns based on a range of input features. These features can include historical prices, trading volume, market indices, macroeconomic indicators, and more. The model examines these variables to predict future price movements with a high degree of accuracy. By leveraging this predictive power, we can estimate not just the direction but the magnitude of future returns, offering a nuanced view of potential outcomes.
Combining volatility modeling with machine learning predictions provides a robust framework to evaluate financial risks. The machine learning models output is particularly beneficial in understanding how expected returns align with forecasted volatility, painting a complete picture of risk versus reward over the investment horizon.
The model's effectiveness is further illustrated through the calculation of the Value at Risk (VaR) at a 95% confidence level. For a $10,000 investment in Cleveland-Cliffs Inc., the VaR is calculated as $400.96. This means that, with 95% confidence, the maximum potential loss over the one-year period would not exceed $400.96. This low VaR indicates a relatively manageable risk level, framed by the historical volatility and the predictive accuracy of machine learning models. These results provide investors with a clear, actionable understanding of potential downside risks, helping to inform more strategic investment decisions.
Long Call Option Strategy
When analyzing the long call options for Cleveland-Cliffs Inc. (CLF), there's a range of data that can help identify the most profitable options while considering risk and reward. Given the target stock price at 2% over the current stock price, we can focus on various expiration dates and strike prices to find the best candidates for potential profitability.
-
July 5, 2024 Expiration, $13.5 Strike Price: This option demonstrates a high ROI of 67.77%, a delta of 0.7593, and a premium of $1.31. The high delta value indicates the options price will likely increase significantly with the stock's price. With a gamma of 0.0912, the delta will change moderately but still provide strong price sensitivity. The vega of 0.5608 points to substantial volatility sensitivity, making it beneficial if the stock price becomes more volatile. The theta of -0.1072 shows a moderate time decay, which, although negative, is manageable given the short time frame. This option's high delta and ROI, combined with a substantial profit potential of $0.8878, make it a compelling choice in the near term with balanced risk and reward.
-
July 26, 2024 Expiration, $12.5 Strike Price: Next on the list is the $12.5 strike price expiring on July 26, 2024. This option has a delta of 0.8969 and a premium of $2.21. The ROI stands at 44.70%, and the profit potential is $0.9878. The gamma is 0.0649, providing moderate sensitivity to price changes. Vega stands at 0.7358, indicating this option could benefit from increased stock volatility. Theta is -0.0106, showing minimal time decay, an advantage for longer expiration. With a high delta and substantial ROI, combined with minimal time decay, this option provides an excellent balance of risk and reward, making it a strong mid-term candidate.
-
August 2, 2024 Expiration, $13 Strike Price: For another mid-term option, consider the $13 strike expiring on August 2, 2024. This option has a delta of 0.8264 and a premium of $1.83. The ROI is impressive at 47.42%, with a profit potential of $0.8678. Gamma at 0.0810 ensures moderate sensitivity to price changes, while vega of 1.1850 suggests potential gains from volatility. Its theta is -0.0133, indicating mild time decay. The high delta and ROI, combined with significant vega, provide an excellent payoff with a manageable risk profile.
-
January 17, 2025 Expiration, $8 Strike Price: For a longer-term perspective, the option with a $8 strike expiring on January 17, 2025, shows a delta of 0.8958 and a premium of $6.9. With an ROI of 11.56% and a profit potential of $0.7978, this option offers low-risk due to the in-the-money strike price and a high delta value. The gamma is 0.0152, showing low sensitivity to price changes, while vega at 2.0325 indicates significant potential gains if volatility increases. Theta is -0.0057, showing very low time decay for this duration. This option is favorable for longer-term investments with a lower risk due to its deep in-the-money status and potential for volatility gain.
-
December 18, 2026 Expiration, $5 Strike Price: For a very long-term choice, the $5 strike expiring on December 18, 2026, is notable. With a delta of 0.9341 and a premium of $10.65, this option offers an ROI of 0.45% with minimal loss potential. The gamma of 0.0055 shows very low sensitivity to stock price changes, while the high vega of 2.7350 makes this option a candidate for gains through increased volatility. Theta is minimal at -0.0015, indicating negligible time decay risk. This choice is essentially a long-term leveraged play on the stock, suitable for low-risk investors looking for a safe, deep in-the-money option.
Risk and Reward Analysis
- Near-Term (July 5, 2024 - $13.5 Strike):
- Reward:
- High ROI (67.77%)
- Potential Profit: $0.8878
-
Risk:
- Moderate Vega, sensitive to volatility changes.
- Theta implies time decay risk manageable due to high delta.
-
Mid-Term (July 26, 2024 - $12.5 Strike):
- Reward:
- Substantial ROI (44.70%)
- Potential Profit: $0.9878
- High Delta, minimal time decay (Theta)
-
Risk:
- Moderate Gamma, manageable price sensitivity.
-
Mid-Term (August 2, 2024 - $13 Strike):
- Reward:
- Impressive ROI (47.42%)
- Potential Profit: $0.8678
- High Delta, moderate Vega.
-
Risk:
- Mild time decay but manageable.
-
Long-Term (January 17, 2025 - $8 Strike):
- Reward:
- Low-risk due to delta close to 1
- Potential Profit: $0.7978
-
Risk:
- Minimal time decay and price sensitivity.
-
Very Long-Term (December 18, 2026 - $5 Strike):
- Reward:
- Long-term deep in-the-money
- Low volatility risk, potential gains from Vega.
- Risk:
- Very minimal time decay, low Gamma.
Each of these options provides a unique blend of near-term profitability and long-term investment security, allowing traders to select based on their risk tolerance and investment horizon.
Short Call Option Strategy
When analyzing short call options for Cleveland-Cliffs Inc. (CLF) with the goal of maximizing profits while minimizing the risk of having shares assigned, it's essential to consider several factors. These include the strike price, expiration date, and the Greek values such as delta, gamma, theta, and vega. Since the target stock price is 2% below the current stock price, we need to choose options with a lower delta to reduce the likelihood of the stock closing in the money (ITM).
Near-Term Options:
-
Strike Price: $17.5, Expiration Date: 2024-07-12
- Delta: 0.0683010969
- Gamma: 0.1872409817
- Vega: 0.237313311
- Theta: -0.0093815671
- Profit: $0.03
This near-term option has a low delta, indicating a lower probability of the option ending up ITM. Given the target stock price is 2% lower, this option's low delta minimizes the risk of assignment. The profit scenario here is relatively low but with a 100% ROI, making it an attractive small-risk, small-reward trade.
Short-Term Options:
-
Strike Price: $20.0, Expiration Date: 2024-08-16
- Delta: 0.0897142718
- Gamma: 0.0586628472
- Vega: 0.8945810989
- Theta: -0.0048952745
- Profit: $0.06
This short-term option offers a higher profit while still maintaining a low delta, and therefore, a lower risk of assignment. The slightly higher theta decay aids in generating profit as time passes, assuming the stock remains OTM.
Medium-Term Options:
-
Strike Price: $25.0, Expiration Date: 2025-01-17
- Delta: 0.087409988
- Gamma: 0.0312262138
- Vega: 1.8137192296
- Theta: -0.0021333801
- Profit: $0.13
This medium-term option features a low delta and offers a substantial vega value, making it sensitive to changes in volatility. The profit here is moderate, and the lower theta suggests slower time decay, suitable for a medium-term strategy aiming for a balance between risk and reward.
Long-Term Options:
-
Strike Price: $32.0, Expiration Date: 2025-06-20
- Delta: 0.1758776022
- Gamma: 0.0300218338
- Vega: 4.817067224
- Theta: -0.0022815751
- Profit: $0.45
For a long-term option, this choice has a moderate delta and high vega, indicating a potential for profit from volatility shifts. The profit potential here is relatively high, and the low theta indicates less erosion of value over time, making it a solid pick for a longer horizon.
Very Long-Term Options:
-
Strike Price: $27.0, Expiration Date: 2025-12-19
- Delta: 0.3958761277
- Gamma: 0.0447307498
- Vega: 7.1619225361
- Theta: -0.0035082576
- Profit: $1.51
Although the delta here is higher than the other options, suggesting a greater risk of the option ending ITM, the substantial vega means this option could be highly profitable if volatility increases. This trade involves higher risk but comes with the reward of significantly higher profit potential.
Summary:
The presented options span from near-term to very long-term strategies, each with a balance of risk and reward relative to its timeframe. Near-term and short-term options tend to have lower deltas, minimizing assignment risks but yielding smaller profits. Medium-term and long-term options offer higher potential profits, especially if volatility increases, but come with increased risks of the option ending ITM. The chosen options align with the strategy of minimizing assignment risk and capitalizing on the projected price target, providing a diversified approach based on different time horizons.
Long Put Option Strategy
When considering the most profitable long put options for Cleveland-Cliffs Inc. (CLF), its essential to look at the "Greeks," which help assess the risk and potential reward of each option. The target stock price being 2% over the current stock price suggests a slight bullish outlook, meaning these put options could become less valuable if the stock price indeed rises. However, for analysis and potential hedging, here are five notable choices through short-term to long-term options:
- 2024-07-19, Strike Price: $25.0
- Delta: -0.9997970779
- Gamma: 0.0
- Vega: 0.0
- Theta: 0.00280359
- Rho: -0.0129843113
- Premium: $5.3
- ROI: 0.7551320755
- Profit: $4.0022
This option has a high ROI of 75.51%, indicating significant profitability. The delta is very high at -0.999, reflecting almost complete sensitivity to stock price movements. However, as theta is positive, the time decay works in favor of the option's value. With negligible gamma and vega, the price is not significantly impacted by volatility changes, presenting a lower risk in terms of price swings. The potential profit of $4.0022 demonstrates a solid reward for the investment.
- 2024-08-16, Strike Price: $29.0
- Delta: -0.9994981099
- Gamma: 0.0
- Vega: 0.0
- Theta: 0.0032670585
- Rho: -0.0371342162
- Premium: $7.15
- ROI: 0.8604475524
- Profit: $6.1522
This mid-term option boasts an impressive ROI of 86.04% and a potential profit of $6.1522. Similar to the previous option, it has an almost perfect delta, indicating it will very closely track the underlying stock price movements. The negligible gamma suggests the delta won't change significantly, minimizing risk from rapid price changes. The positive theta benefits the option holder as time progresses, and with a moderate premium, this option offers a high reward potential.
- 2024-10-18, Strike Price: $26.0
- Delta: -0.9988257587
- Gamma: 0.0
- Vega: 0.0
- Theta: 0.002889226
- Rho: -0.0773372826
- Premium: $4.35
- ROI: 1.3683218391
- Profit: $5.9522
This longer-term option provides an extremely high ROI of 136.83%, signaling a high profitability. The delta is nearly -1, ensuring it captures almost all downward movements in the stock price. The positive theta indicates that the option's value could increase as time decays, provided other factors remain constant. This option's low premium adds to its attractiveness by enhancing the potential return on investment.
- 2025-01-17, Strike Price: $32.0
- Delta: -0.9978553832
- Gamma: 0.0
- Vega: 0.0
- Theta: 0.0035535483
- Rho: -0.172054675
- Premium: $9.6
- ROI: 0.6981458333
- Profit: $6.7022
Expiring in early 2025, this long-term option features a high delta, ensuring sensitivity to stock price changes. The theta value works positively, mitigating some of the time-related losses. Despite its relatively high premium, the profit potential of $6.7022 and ROI of 69.81% positions this option favorably for those willing to hold for longer durations. The stability offered by zero gamma and vega aids risk management.
- 2025-12-19, Strike Price: $32.0
- Delta: -0.9942806177
- Gamma: 0.0
- Vega: 0.0
- Theta: 0.0034084412
- Rho: -0.4416537013
- Premium: $12.3
- ROI: 0.3253821138
- Profit: $4.0022
This very long-term option offers a respectable ROI of 32.54% and potential profit of $4.0022. The nearly perfect delta of -0.994 highlights the safety net it provides against downward stock movements. With a positive theta and negligible gamma and vega, this option remains less impacted by other market variables, making it a highly reliable choice for long-term investors looking to hedge against significant price drops.
In conclusion, the most profitable options are those with high ROIs and solid potential profits, showcasing significant sensitivity to the price movements of CLF. While these options exhibit varying degrees of expiration dates, they generally reflect low risks due to stable gamma and vega values, and positive thetas indicating favorable time decay impacts.
Short Put Option Strategy
When it comes to trading short put options for Cleveland-Cliffs Inc. (CLF), profitability is crucial, but we must also consider the risk of shares being assigned. Understanding the Greeks alongside the potential profit and loss scenarios helps in making informed decisions. Here, I have identified five short put options across various expiration dates and strike prices that present high profitability while minimizing the risk of assignment.
- Expiration: 2024-07-12, Strike: 15.5
- Delta: -0.5081602582
- Gamma: 0.29036496
- Vega: 1.1128711609
- Theta: -0.0219049374
- Premium: $0.44
- ROI: 5.0454545455%
This short put option shows a relatively balanced delta of -0.508, indicating moderate sensitivity to the underlying stock price movements. The premium is $0.44, leading to a 5.05% ROI. While the delta indicates a fair chance of assignment, the moderate risk is balanced by a decent premium. This position would profit if the stock remains above $15.5, with a loss if the stock falls significantly below the strike price, triggering assignment.
- Expiration: 2024-07-26, Strike: 16.5
- Delta: -0.5778282889
- Gamma: 0.1163749741
- Vega: 1.6068019358
- Theta: -0.0240886801
- Premium: $1.75
- ROI: 18.9828571429%
With a delta of -0.577, this option carries a higher probability of being assigned compared to the first one. The significant premium of $1.75 enhances the ROI to approximately 19.0%. The gamma and vega values indicate higher sensitivity to underlying stock price volatility. This short put option would reward handsomely if the stock price stays above $16.5 but entails higher assignment risk, which must be closely monitored.
- Expiration: 2025-01-17, Strike: 16.0
- Delta: -0.4646550783
- Gamma: 0.0887901175
- Vega: 4.5295430148
- Theta: -0.0034036679
- Premium: $2.01
- ROI: 54.3383084577%
This medium-term option provides a substantial premium of $2.01, generating an impressive ROI of over 54.0%. A delta of -0.464 reduces the immediate risk of assignment compared to the previous selections. The moderate gamma and high vega highlight sensitivity to volatility, which, coupled with the theta value, suggests a strong time decay benefit. This position promises considerable profitability, assuming the stock price remains above $16.0.
- Expiration: 2025-12-19, Strike: 15.0
- Delta: -0.3383654603
- Gamma: 0.0521967584
- Vega: 6.8031223197
- Theta: -0.0015596177
- Premium: $2.45
- ROI: 100.0%
Long-term option due in December 2025, with a delta of -0.338, presents a lower assignment risk. The premium of $2.45 results in a 100% ROI, making this a highly attractive option. The high gamma and vega values suggest significant reinforcement from stock volatility while the very low theta points to minimal erosion from time decay. This options profitability could be substantial, but the stock maintaining levels above $15.0 will be crucial.
- Expiration: 2026-12-18, Strike: 20.0
- Delta: -0.5957597083
- Gamma: 0.0447363566
- Vega: 7.3561060737
- Theta: -0.0010816984
- Premium: $6.44
- ROI: 23.6366459627%
Another long-term option expiring in 2026, this selection has a delta of -0.595, indicating a higher likelihood of assignment than some of the previous options but balanced by significant time until expiration. Its impressive premium of $6.44 delivers an ROI of 23.64%. High values in gamma and vega underscore its sensitivity to volatility, presenting a hedge against market fluctuations. The low theta indicates decreased sensitivity to time decay, supporting a favorable risk-reward tradeoff, provided the stock price stays above $20.0.
In conclusion, these five options are chosen for their potential to yield high returns while accounting for the likelihood of assignment. They reflect different expirations from near-to-long term, providing opportunities suitable for various market conditions and risk tolerances. The different deltas and volatilities indicate tailored risk profiles suited to various strategic preferences.
Vertical Bear Put Spread Option Strategy
A vertical bear put spread involves buying a put option and selling another put option with a lower strike price but the same expiration date. This strategy profits when the stock price decreases, while the maximal loss is limited to the net premium paid. Given the goal of targeting a stock price 2% over or under the current price, we can analyze the most profitable vertical bear put spread strategies for Cleveland-Cliffs Inc. (CLF) with various expiration dates and strike prices.
Short-Term Strategy (Expiring July 5, 2024)
Choice 1:
- Long Put: Strike Price 21.5, Expiration July 5, 2024, Premium: 4.58, Delta: -0.838, Gamma: 0.054
- Short Put: Strike Price 20.0, Expiration July 5, 2024, Premium: 5.05, Delta: -0.731, Gamma: 0.064
Risk and Reward: - Net Premium Paid: 4.58 - 5.05 = -0.47 (net credit) - Maximum Profit: (21.5 - 20.0) - 0.47 = 1.03 - Potential Loss: The worst-case scenario would involve the stock price remaining above $21.5 at expiration, resulting in the assignment of the short put. The cost would be $20/share, offset by the total premiums received. A significant assignment risk is present here due to the short-term nature and both options being close to in the money.
Near to Mid-Term Strategy (Expiring August 16, 2024)
Choice 2:
- Long Put: Strike Price 23.0, Expiration August 16, 2024, Premium: 6.95, Delta: -0.606, Gamma: 0.038
- Short Put: Strike Price 22.0, Expiration August 16, 2024, Premium: 7.5, Delta: -0.819, Gamma: 0.052
Risk and Reward: - Net Premium Paid: 6.95 - 7.5 = -0.55 (net credit) - Maximum Profit: (23.0 - 22.0) - 0.55 = 0.45 - Potential Loss: The net credit in this position suggests limited loss if the strategy does not play out. The delta values indicate both options would respond significantly to a move in the underlying stock, thus the risk of assignment for the short put is noticeable but manageable given the additional time to expiration.
Mid-Term Strategy (Expiring October 18, 2024)
Choice 3:
- Long Put: Strike Price 26.0, Expiration October 18, 2024, Premium: 4.35, Delta:-0.998, Gamma: 0.0
- Short Put: Strike Price 24.0, Expiration October 18, 2024, Premium: 5.45, Delta: -0.998, Gamma: 0.0
Risk and Reward: - Net Premium Paid: 4.35 - 5.45 = -1.10 (net credit) - Maximum Profit: (26.0 - 24.0) - 1.10 = 0.90 - Potential Loss: The maximal loss is incurred if the stock remains above $26 at expiration, limited to the difference between the strike prices minus the credit received. The gamma being zero means there's limited responsiveness to stock price changes, which indicates higher predictability in profit/loss outcomes. However, the high delta value means an in-the-money state with a high risk of assignment.
Long-Term Strategy (Expiring January 17, 2025)
Choice 4:
- Long Put: Strike Price 30.0, Expiration January 17, 2025, Premium: 9.77, Delta: -0.994, Gamma: 0.0
- Short Put: Strike Price 25.0, Expiration January 17, 2025, Premium: 11.7, Delta: -0.998, Gamma: 0.0
Risk and Reward: - Net Premium Paid: 9.77 - 11.7 = -1.93 (net credit) - Maximum Profit: (30.0 - 25.0) - 1.93 = 3.07 - Potential Loss: Again, a high delta suggests in-the-money positions with a high potential for assignment. With long-term strategies, the premium received provides more room for profit, though it comes with the risk of prolonged market movements affecting outcomes unpredictably.
Ultra-Long Term Strategy (Expiring December 18, 2026)
Choice 5:
- Long Put: Strike Price 30.0, Expiration December 18, 2026, Premium: 11.92, Delta: -0.992, Gamma: 0.0
- Short Put: Strike Price 27.0, Expiration December 18, 2026, Premium: 14.95, Delta: -0.713, Gamma: 0.033
Risk and Reward: - Net Premium Paid: 11.92 - 14.95 = -3.03 (net credit) - Maximum Profit: (30.0 - 27.0) - 3.03 = -0.03 - Potential Loss: Considering the very long-term horizon, the credit received leads to limited profit opportunities but offers minimizing assignment risk. Additionally, the hedge provides a significant buffer.
Each of these choices offers a tailored risk-reward profile based on the expiration date and strike price. Near-term options tend to have higher assignment risks and require precise market timing, while long-term options buffer movements with higher premiums but involve patience for the strategy to accrue its benefits. Always ensure these options align with your risk tolerance and market outlook.
Vertical Bull Put Spread Option Strategy
A vertical bull put spread is an options strategy that involves simultaneously selling a put option and buying another put option at a lower strike price within the same expiration date. This strategy is used when the trader is moderately bullish on the underlying stock. The goal is to capture the premium received from selling the higher strike put while reducing risk by buying the lower strike put.
When selecting specific options for this strategy, we must consider the Greeks, especially delta, which indicates the probability of being in the money (ITM) at expiration. We aim to minimize assignment risk while optimizing profitability. The target stock price is projected to be within a 2% range around the current price.
Short-term Strategy: Expiration July 5, 2024
For a short-term vertical bull put spread, consider selling the put with a strike of 16.5 (expiration July 5, 2024) and buying the put with a strike of 14.5 (expiration July 5, 2024). The delta for the 16.5 put is -0.885, indicating a relatively high probability of being ITM, which translates to greater assignment risk. However, the high premium and impressive ROI (35.55%) make it a lucrative but risky option. By buying the 14.5 strike put, with its delta of -0.071, we reduce some of this risk by setting a floor for potential losses.
- Short Put (Strike 16.5): Premium: $2.20, Delta: -0.885, Gamma: 0.224
- Long Put (Strike 14.5): Premium: $0.04, Delta: -0.071, Gamma: 0.213
- Potential Profit: $2.16 (difference in premiums)
- Max Loss: $2.06 (difference in strikes less the net premium received)
- ROI: 35.55%
Medium-term Strategy: Expiration August 16, 2024
For a medium-term approach, a bull put spread with a short put at a strike of 16.0 (expiration August 16, 2024) and a long put at 14.0 (expiration August 16, 2024) is ideal. The delta for the 16.0 strike is -0.563, indicating moderate assignment risk, while the 14.0 strike put has a delta of -0.234, offering lower risk but decent protection.
- Short Put (Strike 16.0): Premium: $1.03, Delta: -0.563, Gamma: 0.116
- Long Put (Strike 14.0): Premium: $0.38, Delta: -0.234, Gamma: 0.144
- Potential Profit: $0.65 (difference in premiums)
- Max Loss: $1.35 (difference in strikes less the net premium received)
- ROI: 28.3%
Longer-term Strategy: Expiration October 18, 2024
Stretching the horizon to October 2024, consider the short put at a strike of 17.0 (expiration October 18, 2024) and a long put at 15.0 (expiration October 18, 2024). The delta for the 17.0 strike is -0.631 (moderate risk), while the 15.0 strike has a delta of -0.387, providing better protection.
- Short Put (Strike 17.0): Premium: $2.24, Delta: -0.631, Gamma: 0.122
- Long Put (Strike 15.0): Premium: $1.05, Delta: -0.387, Gamma: 0.120
- Potential Profit: $1.19
- Max Loss: $0.81
- ROI: 14.38%
Long-term Strategy: Expiration January 17, 2025
For a very long-term strategy, a spread with a short put at a strike of 16.0 (expiration January 17, 2025) and a long put at 14.0 (expiration January 17, 2025) is recommended. The delta for the 16.0 strike is -0.493 & the 14.0 strike delta is -0.292, reducing assignment risk sufficiently over this extended period.
- Short Put (Strike 16.0): Premium: $1.59, Delta: -0.493, Gamma: 0.128
- Long Put (Strike 14.0): Premium: $0.66, Delta: -0.292, Gamma: 0.100
- Potential Profit: $0.93
- Max Loss: $1.07
- ROI: 42.28%
Ultra-long-term Strategy: Expiration December 18, 2026
For the ultra-long-term, an appropriate combination would be selling the put with a strike of 20.0 (expiration December 18, 2026) and buying the put with a strike of 17.0. The delta for the 20.0 strike is -0.621 (indicating moderate ITM probability), while the 17.0 strike put with a delta of -0.393, provides ample protective upside.
- Short Put (Strike 20.0): Premium: $6.13, Delta: -0.621, Gamma: 0.062
- Long Put (Strike 17.0): Premium: $3.36, Delta: -0.393, Gamma: 0.047
- Potential Profit: $2.77
- Max Loss: $0.23
- ROI: 19.77%
In conclusion, the most profitable strategy varies with time horizon and risk appetite. The near-term strategies are more aggressive, while the longer-term plays offer higher safety but potentially lower annualized returns. Consider the risk-reward profile aligning it with your market outlook and trading objectives.
Vertical Bear Call Spread Option Strategy
A vertical bear call spread is an options strategy where a trader sells a call option at a lower strike price and buys another call option with a higher strike price, both with the same expiration date. This strategy is typically used when a trader expects the underlying stock price to decrease or remain below the strike price of the sold call option. For Cleveland-Cliffs Inc. (CLF), we will analyze the options chain to determine the most profitable vertical bear call spread while minimizing the risk of having shares assigned, taking into account the target stock price which is 2% over or under the current stock price.
Strategy Analysis and Choices
1. Near-Term Option (Expiring 2024-07-12)
Short Call: - Strike Price: $15.0 - Premium: $0.78 - Delta: 0.6378321742
Long Call: - Strike Price: $17.0 - Premium: $0.32 - Delta: 0.3557548735
By selling the $15.0 call and buying the $17.0 call, the trader nets a premium of $0.46 ($0.78 - $0.32). The delta for the sold option is 0.64, which implies a moderate risk of assignment if the stock price nears the strike price. However, with a 2% buffer expected over the current stock price, the risk is manageable. The maximum profit here is the net premium of $0.46, and the maximum loss is $1.54 ($2 spread - $0.46 premium).
2. Medium-Term Option (Expiring 2024-08-16)
Short Call: - Strike Price: $17.0 - Premium: $1.40 - Delta: 0.503261646
Long Call: - Strike Price: $20.0 - Premium: $0.3 - Delta: 0.1775807604
Selling the $17.0 call and buying the $20.0 call results in a net premium of $1.1 ($1.40 - $0.3). The delta of the sold call at 0.50 indicates a higher risk compared to the previous position. Nevertheless, the higher premium collected provides a good risk-reward balance. The maximum profit is $1.1, and the maximum loss is $1.9 ($3 spread - $1.1 premium).
3. Longer-Term Option (Expiring 2025-06-20)
Short Call: - Strike Price: $15.0 - Premium: $3.1 - Delta: 0.644057628
Long Call: - Strike Price: $20.0 - Premium: $1.3 - Delta: 0.387072627
Selling the $15.0 call and buying the $20.0 call nets a premium of $1.8 ($3.1 - $1.3). The delta of 0.64 for the short call suggests a higher risk of assignment, but the high premium collected compensates for this risk. The maximum profit is $1.8, while the maximum loss is $3.2 ($5 spread - $1.8 premium).
4. Long-Term Option (Expiring 2026-12-18)
Short Call: - Strike Price: $10.0 - Premium: $6.5 - Delta: 0.8441681186
Long Call: - Strike Price: $15.0 - Premium: $3.82 - Delta: 0.7029283413
Selling the $10.0 call and buying the $15.0 call results in a net premium of $2.68 ($6.5 - $3.82). The delta is very high at 0.84, indicating a significant risk of assignment. However, this is balanced by a substantial premium. The maximum profit is $2.68, and the maximum loss is $2.32 ($5 spread - $2.68 premium).
5. Ultra Long-Term Option (Expiring 2026-12-18)
Short Call: - Strike Price: $27.0 - Premium: $1.4 - Delta: 0.4524495385
Long Call: - Strike Price: $30.0 - Premium: $0.9 - Delta: 0.2407343555
Selling the $27.0 call and buying the $30.0 call nets a premium of $0.5 ($1.4 - $0.9). The delta of 0.45 for the short call indicates moderate assignment risk, which, given the distant expiration, is relatively controlled. The maximum profit is $0.5, while the maximum loss is $2.5 ($3 spread - $0.5 premium).
Quantifying the Risk and Reward
Near-Term Option (Expiring 2024-07-12):
- Maximum Profit: $0.46
- Maximum Loss: $1.54
- Delta Risk is Moderate (0.6378) with high Gamma.
Medium-Term Option (Expiring 2024-08-16):
- Maximum Profit: $1.1
- Maximum Loss: $1.9
- Delta Risk is Moderate (0.5032), and Rho is low, mitigating interest rate risk.
Longer-Term Option (Expiring 2025-06-20):
- Maximum Profit: $1.8
- Maximum Loss: $3.2
- Delta Risk is High (0.6440), yet Gamma and Vega ensure manageability over the long term.
Long-Term Option (Expiring 2026-12-18):
- Maximum Profit: $2.68
- Maximum Loss: $2.32
- Delta Risk is Very High (0.8441), requiring greater monitoring.
Ultra Long-Term Option (Expiring 2026-12-18):
- Maximum Profit: $0.5
- Maximum Loss: $2.5
- Delta Risk is Moderate (0.4524), providing lower immediate risk but longer market exposure.
For the most profitable strategy, based on risk-tolerance and delta considerations, the long-term option expiring in 2026 offers a high premium with balanced risk-reward as long as you can manage the high delta exposure. However, for more moderate risk, the medium-term expiration in 2024-08-16 and longer-term expiration in 2025-06-20 provide good premiums with manageable assignment risks.
Vertical Bull Call Spread Option Strategy
Analyzing the various options spreads available for Cleveland-Cliffs Inc. (CLF), we must consider key factors such as the delta, gamma, vega, theta, and rho of different strike prices and expiration dates. A vertical bull call spread involves buying one call option while simultaneously selling another call option with a higher strike price within the same expiration date. This strategy limits both our maximum profit and potential loss but is extremely effective in a moderately bullish market outlook. Given the target stock price is 2% over or under the current price, its crucial to select options that are just slightly out-of-the-money or nearly at-the-money to capture the upward movement without risking early assignments.
Near-Term Option (Expiration: 2024-07-05; Strike Prices: 15 & 15.5): 1. Long Call (15.0 strike, 2024-07-05 expiry): High delta of 0.73708 indicating a strong correlation to the stock price movement. The gamma of 0.49581 helps measure this sensitivity's rate of change. Premium is $0.52. 2. Short Call (15.5 strike, 2024-07-05 expiry): Moderate delta of 0.43996 with a high gamma of 0.66333. Premium is $0.22.
Risk and Reward: - Max Loss: $0.52 $0.22 = $0.30 per contract. - Max Profit: ($15.5 - $15.0) - $0.30 = $0.20 per contract. - Break-even Point: $15.3.
Profit and Loss Scenarios: - If CLFs price is $15.5 at expiration, the maximum profit is $0.20 per contract. - If CLFs price is $15 at expiration, the entire premium of $0.30 is our maximum loss.
Short-Term Option (Expiration: 2024-07-12; Strike Prices: 15 & 15.5): 1. Long Call (15.0 strike, 2024-07-12 expiry): Delta of 0.62513 with a gamma of 0.24577. Premium is $0.66. 2. Short Call (15.5 strike, 2024-07-12 expiry): Delta of 0.47834 with a gamma of 0.38872. Premium is $0.37.
Risk and Reward: - Max Loss: $0.66 $0.37 = $0.29 per contract. - Max Profit: ($15.5 - $15.0) - $0.29 = $0.21 per contract. - Break-even Point: $15.29.
Profit and Loss Scenarios: - If CLFs price is $15.5 at expiration, the maximum profit is $0.21 per contract. - If CLFs price is $15 at expiration, the entire premium of $0.29 is our maximum loss.
Mid-Term Option (Expiration: 2024-07-26; Strike Prices: 15 & 16): 1. Long Call (15.0 strike, 2024-07-26 expiry): High delta of 0.60694 and a gamma of 0.17614. Premium is $1.07. 2. Short Call (16.0 strike, 2024-07-26 expiry): Delta of 0.43431 and gamma of 0.17028. Premium is $0.55.
Risk and Reward: - Max Loss: $1.07 $0.55 = $0.52 per contract. - Max Profit: ($16.0 - $15.0) - $0.52 = $0.48 per contract. - Break-even Point: $15.52.
Profit and Loss Scenarios: - If CLFs price is $16 at expiration, the maximum profit is $0.48 per contract. - If CLFs price is $15 at expiration, the entire premium of $0.52 is our maximum loss.
Long-Term Option (Expiration: 2024-08-16; Strike Prices: 15 & 16): 1. Long Call (15.0 strike, 2024-08-16 expiry): Delta of 0.60479 with a gamma of 0.14804. Premium is $1.28. 2. Short Call (16.0 strike, 2024-08-16 expiry): Delta of 0.45141 with a gamma of 0.15549. Premium is $0.77.
Risk and Reward: - Max Loss: $1.28 $0.77 = $0.51 per contract. - Max Profit: ($16.0 - $15.0) - $0.51 = $0.49 per contract. - Break-even Point: $15.51.
Profit and Loss Scenarios: - If CLFs price is $16 at expiration, the maximum profit is $0.49 per contract. - If CLFs price is $15 at expiration, the entire premium of $0.51 is our maximum loss.
Very Long-Term Option (Expiration: 2024-09-20; Strike Prices: 15 & 16): 1. Long Call (15.0 strike, 2024-09-20 expiry): Delta of 0.60521 with a gamma of 0.11633. Premium is $1.54. 2. Short Call (16.0 strike, 2024-09-20 expiry): Delta of 0.48413 with a gamma of 0.12369. Premium is $0.98.
Risk and Reward: - Max Loss: $1.54 $0.98 = $0.56 per contract. - Max Profit: ($16.0 - $15.0) - $0.56 = $0.44 per contract. - Break-even Point: $15.56.
Profit and Loss Scenarios: - If CLFs price is $16 at expiration, the maximum profit is $0.44 per contract. - If CLFs price is $15 at expiration, the entire premium of $0.56 is our maximum loss.
Therefore, from the analyzed options, the most profitable strategy seems to be choosing long-term strategies that minimize risk while still allowing for substantial profit potential. Given the consideration of Greeks like delta and gamma, the above-discussed spreads provide a balanced risk-reward ratio that aligns well with our bullish outlook on Cleveland-Cliffs Inc.s stock over a medium to long period.
Spread Option Strategy
To determine the most profitable calendar spread options strategy for Cleveland-Cliffs Inc. (CLF), with the specific goal of minimizing the risk of having shares assigned (given that we will be buying call options and selling put options), we need to analyze various factors including the Greeks, the days to expiration, the strike price, and the premiums. The target stock price is 2% over or under the current stock price, and hence the selection of the expiration dates and the strike prices needs to be purposeful.
Near-Term Strategy (Expire: 2024-07-05)
- Long Call Option:
- Strike Price: 13.5
- Premium: $1.31
- Delta: 0.759
- Gamma: 0.091
- Vega: 0.561
- Theta: -0.107
- Profit: $0.8878
- ROI: 0.6777
Short Put Option: - Strike Price: 14.5 - Premium: $0.04 - Delta: -0.071 - Gamma: 0.213 - Vega: 0.245 - Theta: -0.009 - Profit: $0.04 - ROI: 100.0%
Analysis: This combination minimizes the risk of having the put assigned due to the out-of-the-money nature of the short put, while still leveraging the high delta of the long call. This calendar spread can yield moderate returns with relatively low risk, given the shorter time frame.
Short Mid-Term Strategy (Expire: 2024-07-19)
- Long Call Option:
- Strike Price: 13.0
- Premium: $1.60
- Delta: 0.951
- Gamma: 0.062
- Vega: 0.284
- Theta: -0.008
- Profit: $1.0978
- ROI: 0.6861
Short Put Option: - Strike Price: 13.0 - Premium: $0.03 - Delta: -0.083 - Gamma: 0.077 - Vega: 0.539 - Theta: -0.008 - Profit: $0.03 - ROI: 100.0%
Analysis: By selecting the same strike price of $13 for both the long call and short put, and given that both options have attractive Greeks, this strategy aims to maximize profit while minimizing assignment risk (as the put is relatively safe if the stock remains close to the current price target plus/minus 2%).
Mid-Term Strategy (Expire: 2024-07-26)
- Long Call Option:
- Strike Price: 12.0
- Premium: $2.64
- Delta: 0.851
- Gamma: 0.054
- Vega: 0.954
- Theta: -0.020
- Profit: $1.0578
- ROI: 0.4007
Short Put Option: - Strike Price: 14.0 - Premium: $0.26 - Delta: -0.204 - Gamma: 0.144 - Vega: 1.164 - Theta: -0.010 - Profit: $0.261 - ROI: 100.0%
Analysis: Here, the call option at the strike price of 12 has a higher premium but a lower risk due to favorable Greeks. The short put option at 14 is further out of the money, reducing the risk of assignment, while still yielding a decent premium and ROI.
Longer Mid-Term Strategy (Expire: 2024-11-15)
- Long Call Option:
- Strike Price: 10.0
- Premium: $4.85
- Delta: 0.912
- Gamma: 0.027
- Vega: 1.351
- Theta: -0.004
- Profit: $0.8478
- ROI: 0.1748
Short Put Option: - Strike Price: 13.0 - Premium: $0.64 - Delta: -0.201 - Gamma: 0.070 - Vega: 2.66 - Theta: -0.004 - Profit: $0.64 - ROI: 100.0%
Analysis: The long call here belongs to a much safer delta range which ensures low-risk, stable returns. The short put at 13 is slightly more risky but yields substantial premiums. The time decay is managed well here balancing both options.
Long-Term Strategy (Expire: 2025-12-19)
- Long Call Option:
- Strike Price: 10.0
- Premium: $5.25
- Delta: 0.912
- Gamma: 0.026
- Vega: 1.496
- Theta: -0.004
- Profit: $0.8478
- ROI: 0.1748
Short Put Option: - Strike Price: 13.0 - Premium: $2.51 - Delta: -0.23 - Gamma: 0.029 - Vega: 7.311 - Theta: -0.001 - Profit: $2.51 - ROI: 100.0%
Analysis: A very safe long call option alongside a significantly profitable short put option, making for a high-reward and manageable risk strategy. The short put at 13.0 provides enough buffer to ensure a lucrative spread with minimal risk.
Conclusion
This selection of long call and short put options provides a balanced approach to achieving a profitable calendar spread with minimized risk of shares being assigned. The Greeks favorable characteristics alongside vertical and horizontal spread of expirations protect liquidity while enhancing overall portfolio returns.
Calendar Spread Option Strategy #1
When considering a calendar spread for Cleveland-Cliffs Inc. (CLF), where we buy a put option and simultaneously sell a call option with different expiration dates, the primary goal is to generate a profit from the volatility and the time decay of the options while minimizing the risk of having shares assigned due to deep in-the-money options. Here are five strategies through a range of different expiration dates that consider profitability, risk, and the "Greeks" data.
- Short-Term Strategy
- Buy: Put option with a strike price of $25, expiring on 2024-07-19. Greek values include a delta of -0.9997970779 and a premium of $5.3. This option demonstrates a high delta, suggesting that it is almost certain to move inversely with the underlying stock and is very much in the money.
- Sell: Call option with a strike price of $16.5, expiring on 2024-07-12. Greek values include a delta of 0.1684084631 and a premium of $0.1. This call option has a low delta, indicating it's less likely to be in the money and hence risking assignment is low.
- Profit Scenario: The max profit scenario occurs if the stock price remains relatively stable or moves slightly downward. The potential profit is $4.5978 ($5.3 from the put premium minus $0.1 from the call premium).
-
Risk Scenario: If the stock surges past $16.5 significantly, you risk losses from the call option being in the money; the high delta of the put provides a strong hedge against downside movements.
-
Mid-Term Strategy
- Buy: Put option with a strike price of $24, expiring on 2024-08-16. Greek values include a delta of -0.9994981099 and a premium of $7.05. This put is in the money and has significant delta value making it a strong candidate for substantial moves.
- Sell: Call option with a strike price of $18.0, expiring on 2024-08-16. Greek values include a delta of 0.2068776843 and a premium of $0.27. This call option, though in the money to some extent, shares temporal similarity reducing risk from expiration differences.
- Profit Scenario: With an ROI of approximately 17.76170213%, the combined premiums provide a potential profit margin. The strategy here profits largely if the underlying stock stays below the $18 strike price of the call.
-
Risk Scenario: The risk arises if the stock price exceeds $18 significantly, in which the call becomes costly. However, the deep put mitigates some of this risk.
-
Intermediate-Term Strategy
- Buy: Put option with a strike price of $27, expiring on 2024-08-16. Greek values include a delta of -0.9994981099 and a premium of $5.2. With a very high negative delta and near expiry, this option is a significant hedge.
- Sell: Call option with a strike price of $17.0, expiring on 2024-09-20. Greek values include a delta of 0.2710502831 and a premium of $0.45. This choice focuses on a higher premium collection during increased theta decay closer to expiry.
- Profit Scenario: The profit potential here remains large, hinging on the stock price not over-exceeding $17 as we enjoy premiums worth $4.75 against significant put protection.
-
Risk Scenario: Despite a potentially large return, risk arises if there is a strong bullish phase driving the stock price over $17 significantly before the put expiration.
-
Long-Term Strategy
- Buy: Put option with a strike price of $29, expiring on 2026-01-16. Greek values include a delta of -0.9804224054 and a premium of $9.77. Offering considerable protection far into the future, this option can cover a volatile period.
- Sell: Call option with a strike price of $14.5, expiring on 2025-06-20. Greek values include a delta of 0.7690183288 and a premium of $1.63. This provides an upfront large premium at the expense of potentially being deeply in the money.
- Profit Scenario: Collected premium creates a potential where we amass profits provided the market doesnt shoot past $14.5 by a large margin.
-
Risk Scenario: High delta in this scenario amplifies the potential risk if prices rally towards or beyond $14.5.
-
Ultra Long-Term Strategy
- Buy: Put option with a strike price of $27, expiring on 2026-12-18. Greek values include a delta of -0.5563954496 and a premium of $11.2. This option reflects a deep in the money with robust long-term protection.
- Sell: Call option with a strike price of $20.0, expiring on 2026-12-18. Greek values include a delta of 0.6066702558 and a premium of $2.73, providing a steady long-term horizon holding.
- Profit Scenario: The longest horizon suggests strong collection on premiums up front with a balanced hedge via put against substantial downward movements.
- Risk Scenario: The risk of holding a deeply out-of-the-money call for a prolonged time entails risk depending on the broader market sentiment and volatility.
In conclusion, the calendar spread strategy for Cleveland-Cliffs Inc. (CLF) considers buying deep in-the-money put options to provide downside significant protection and selling calls that slightly out of money to collect premiums. The key is balancing the delta to mitigate risk and leveraging theta decay to maximize profits. Acting on near-term strategies to ultra-long-term strategies provides diversity in approach while aligning with market conditions.
Calendar Spread Option Strategy #2
To formulate a calendar spread options strategy for Cleveland-Cliffs Inc. (CLF) while minimizing risks associated with shares being assigned, we will consider selling put options and buying call options at different expiration dates and strike prices. The goal is to target a stock price that is within 2% of its current value, balancing the most profitable options against those with least risk. Here are five carefully selected choices ranging from near-term to long-term strategies, along with a detailed risk and reward analysis.
Choice 1: Near-Term Strategy
- Sell Put Option: Strike Price: $21.5, Expiration Date: July 05, 2024.
- Delta: -0.8380, Gamma: 0.0541, Vega: 0.4417, Theta: -0.1090, Rho: -0.0026.
- Premium: $4.58, ROI: 26.69%, Profit: $1.2222.
-
Risk: Risk of assignment is moderate due to a delta of -0.8380, indicating it is likely to move with the stock. However, with just 5 days to expiration, the risk is slightly reduced by the short time frame.
-
Buy Call Option: Strike Price: $35, Expiration Date: August 16, 2025.
- Delta: 0.0815, Gamma: 0.0197, Vega: 0.8325, Theta: -0.0124, Rho: 0.0013.
- Premium: $0.02.
- Reward: This call option offers significant upside potential if the stock appreciates, with minimal time decay risk due to the relatively long expiration date and high vega values indicating sensitivity to volatility.
Choice 2: Mid-Term Strategy
- Sell Put Option: Strike Price: $25, Expiration Date: October 18, 2024.
- Delta: -0.9988, Gamma: 0.0, Vega: 0.0, Theta: 0.0027, Rho: -0.0346.
- Premium: $5.05, ROI: 84.20%, Profit: $4.2522.
-
Risk: This option has a very high delta, suggesting near certainty of assignment if the option remains in the money. The absence of vega and gamma indicates no expected sensitivity to volatility or price changes, making the risk more related to underlying stock price movement.
-
Buy Call Option: Strike Price: $14.0, Expiration Date: August 02, 2024.
- Delta: 0.6735, Gamma: 0.1347, Vega: 1.6676, Theta: -0.0155, Rho: 0.0079.
- Premium: $1.63, ROI: 64.28%, Profit: $1.0478.
- Reward: High delta and vega suggest this call will react strongly to price increases and volatility, compensating for the theta decay. The mid-term expiration allows capturing upward movements.
Choice 3: Long-Term Strategy
- Sell Put Option: Strike Price: $20, Expiration Date: October 18, 2024.
- Delta: 0.1524, Gamma: 0.1685, Vega: 0.8317, Theta: -0.0090, Rho: 0.0012.
- Premium: $0.11, ROI: 100.0%, Profit: $0.11.
-
Risk: Low delta indicates a low probability of ending up in the money pre-expiration. High gamma and vega show sensitivity to changes, but the theta decay is manageable.
-
Buy Call Option: Strike Price: $15.0, Expiration Date: June 20, 2025.
- Delta: 0.7415, Gamma: 0.0395, Vega: 4.8621, Theta: -0.0044, Rho: 0.0669.
- Premium: $3.9, ROI: 46.61%, Profit: $1.8178.
- Reward: Powerful response to stock movement with high delta and vega.
Choice 4: Ultra-Long-Term Strategy
- Sell Put Option: Strike Price: $27, Expiration Date: October 18, 2024.
- Delta: -0.999, Gamma: 0.0, Vega: 0.0, Theta: 0.0033, Rho: -0.0371.
- Premium: $5.2, ROI: 1.1735%, Profit: $6.1022.
-
Risk: High delta implies a near-certain in-the-money status if the stock declines, triggering assignment. Lack of other Greeks limits other risks.
-
Buy Call Option: Strike Price: $15, Expiration Date: December 18, 2026.
- Delta: 0.7029, Gamma: 0.0277, Vega: 8.2012, Theta: -0.0028, Rho: 0.1344.
- Premium: $4.6, ROI: 98.21%, Profit: $4.5178.
- Reward: A high vega with long-term decay. Long horizons allow ample time for stock to appreciate, negating theta decay impact and utilizing significant gamma for dynamic delta.
Choice 5: All-Out Strategy
- Sell Put Option: Strike Price: $15.5, Expiration Date: September 20, 2024.
- Delta: 0.4841, Gamma: 0.1237, Vega: 2.9054, Theta: -0.0085, Rho: 0.0143.
- Premium: $0.98, ROI: 100.0%, Profit: $0.98.
-
Risk: Moderate delta limits assignment risk while suitably exposed to stock price variations. High vega enhances volatility responsiveness.
-
Buy Call Option: Strike Price: $10.0, Expiration Date: January 17, 2025.
- Delta: 0.8496, Gamma: 0.0360, Vega: 1.9622, Theta: -0.0076, Rho: 0.0240.
- Premium: $4.1, ROI: 13.14%, Profit: $0.6178.
- Reward: Maximizes leverage due to the significant difference in delta. High vega can make this highly profitable in volatile conditions.
Summary:
Each strategy balances between minimizing the risk of assignment and maximizing potential rewards through careful choice of put and call options, considering their Greeks, ROI, and expiration dates. By selecting suitable strike prices and expiration dates, we ensure the strategy leverages favorable market movements while controlling potential losses/users' portfolio exposure.
Similar Companies in Steel:
Report: Nucor Corporation (NUE), Nucor Corporation (NUE), Report: Steel Dynamics, Inc. (STLD), Steel Dynamics, Inc. (STLD), Report: ArcelorMittal S.A. (MT), ArcelorMittal S.A. (MT), Report: Gerdau S.A. (GGB), Gerdau S.A. (GGB), Report: United States Steel Corporation (X), United States Steel Corporation (X), Report: Reliance Steel & Aluminum Co. (RS), Reliance Steel & Aluminum Co. (RS), Report: Commercial Metals Company (CMC), Commercial Metals Company (CMC), POSCO Holdings Inc. (PKX), Report: Ternium S.A. (TX), Ternium S.A. (TX), Companhia Siderurgica Nacional (SID), Alcoa Corporation (AA)
https://www.youtube.com/watch?v=eUhajEo8gHg
https://finance.yahoo.com/news/cleveland-cliffs-inc-nyse-clf-140159256.html
https://finance.yahoo.com/news/cleveland-cliffs-clf-stock-declines-220019085.html
https://finance.yahoo.com/news/cleveland-cliffs-inc-clf-trending-130009645.html
https://finance.yahoo.com/news/cleveland-cliffs-host-u-senator-200500274.html
https://finance.yahoo.com/news/cleveland-cliffs-clf-suffers-larger-221518684.html
https://finance.yahoo.com/news/cleveland-cliffs-clf-stock-sinks-220019651.html
https://finance.yahoo.com/news/morgan-stanley-trims-price-target-110018029.html
https://finance.yahoo.com/news/cleveland-cliffs-posts-press-conference-190900283.html
https://www.sec.gov/Archives/edgar/data/764065/000076406524000108/clf-20240331.htm
Copyright © 2024 Tiny Computers (email@tinycomputers.io)
Report ID: bnqZ0nw
Cost: $0.55769
https://reports.tinycomputers.io/CLF/CLF-2024-06-29.html Home