Ternium S.A. (ticker: TX)
2024-06-29
 Ternium S.A. (ticker: TX), established in 2005, is a leading steel producer in Latin America, with operations spanning Argentina, Brazil, Colombia, Guatemala, Mexico, and the United States. The company is known for its vertically integrated business model, encompassing the entire steel production chain from mining iron ore to manufacturing a variety of steel products. Its extensive portfolio includes flat and long steel offerings, serving diverse industries such as automotive, construction, and manufacturing. Ternium's robust supply chain, technological advancements, and strategic acquisitions have fortified its market position, enabling sustainable growth and operational efficiency. The company is also committed to sustainable practices, emphasizing environmental responsibility and community development, aligning with global standards and investor expectations. As a publicly traded entity, Ternium's shares are listed on the New York Stock Exchange (NYSE) under the ticker symbol TX, attracting a broad array of institutional and retail investors.
| Full Time Employees | 34,458 | Previous Close | 37.29 | Market Cap | 7,371,365,376 |
| Open | 37.47 | Day Low | 37.34 | Day High | 37.88 |
| Dividend Rate | 3.3 | Dividend Yield | 0.0879 | Ex Dividend Date | 1714608000 |
| Beta | 1.661 | Trailing PE | 11.3788 | Forward PE | 4.9021 |
| Volume | 168,634 | Average Volume | 284,855 | Average Volume (10 days) | 243,830 |
| 52 Week Low | 35.22 | 52 Week High | 45.58 | Price to Sales (Trailing 12 Months) | 0.3928 |
| Fifty Day Average | 40.9686 | Two Hundred Day Average | 39.8501 | Trailing Annual Dividend Rate | 3.3 |
| Trailing Annual Dividend Yield | 0.0885 | Enterprise Value | 76,508,528,640 | Profit Margins | 0.0353 |
| Float Shares | 429,481,936 | Shares Outstanding | 196,308,000 | Shares Short | 497,489 |
| Shares Short Prior Month | 434,218 | Date Short Interest | 1718323200 | Held By Institutions | 0.1512 |
| Short Ratio | 1.91 | Book Value | 66.371 | Price to Book | 0.5658 |
| Net Income to Common | 663,105,024 | Trailing EPS | 3.3 | Forward EPS | 7.66 |
| PEG Ratio | 4.97 | Enterprise to Revenue | 4.077 | Enterprise to EBITDA | 15.967 |
| 52 Week Change | -0.0655 | S&P 52 Week Change | 0.2255 | Last Dividend Value | 2.2 |
| Total Cash | 4,063,245,056 | Total Cash Per Share | 2.07 | Total Debt | 2,330,895,104 |
| Quick Ratio | 1.977 | Current Ratio | 3.321 | Total Revenue | 18,765,017,088 |
| Debt to Equity | 13.277 | Revenue Per Share | 95.59 | Return on Assets | 0.1235 |
| Return on Equity | 0.0628 | Free Cash Flow | (685,100,096) | Operating Cash Flow | 2,340,163,072 |
| Earnings Growth | -0.035 | Revenue Growth | 0.319 | Gross Margins | 0.3046 |
| EBITDA Margins | 0.2553 | Operating Margins | 0.1412 |
| Sharpe Ratio | 0.075603 | Treynor Ratio | 0.024440 |
| Sortino Ratio | 1.246003 | Calmar Ratio | 0.151510 |
The analysis of TX's technical indicators, fundamental data, and balance sheet highlights several key factors regarding its future stock price movement over the next few months.
Technical Analysis:
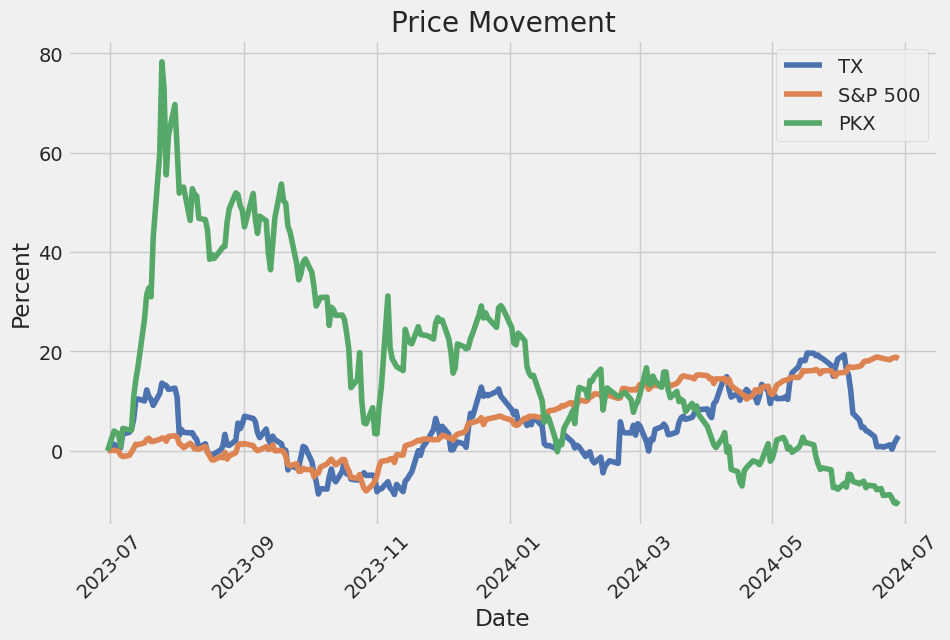
- Price Movement: Recent declines in TX's stock price, as observed in the consistent lower highs and lower lows from early March to the end of June, indicate a bearish trend. The OBV (On Balance Volume) remained in negative territory for most of the measured period, suggesting that selling pressure has been dominant.
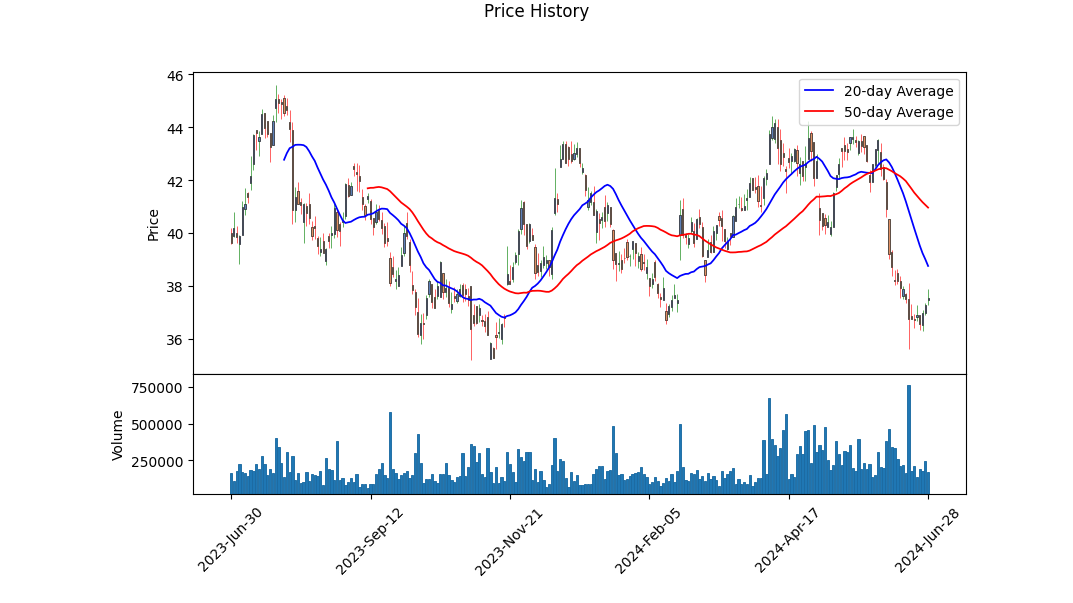
- MACD Histogram: The values show a consistent downtrend with a negative MACD histogram, reaching close to zero by the end of June, which could indicate a convergence towards a possible reversal or, at least, a stabilization phase.
- Volume Trends: The negative OBV figures over the weeks imply that volume activity favours sellers.
Fundamental Analysis:
- Profit Margins & EBTIDA: A gross margin of 30.46% and an EBITDA margin of 25.53% are strong indicators of operational efficiency. However, the operating margin of 14.12% suggests a significant portion of revenues are used for operating expensesthis could be a concern if revenue growth stagnates.
- Market Valuation Metrics: TX does not have a trailing PEG ratio available, but the Altman Z-Score of 2.94 reflects a relatively healthy financial situation, with moderate risk of bankruptcy.
- Liquidity & Solvency: Working capital of approximately $8.79 billion and significant total assets of around $24.75 billion with total liabilities of $7.14 billion provide a stable financial structure. Additionally, the retained earnings and solid EBITDA illustrate consistent profit retention and cash flow generation capabilities.
Risk-Adjusted Return Analysis:
- Sharpe Ratio: At 0.075603, TX's return barely compensates for its risk, suggesting that investors are not currently sufficiently rewarded for the level of risk they are taking.
- Sortino Ratio: With a value of 1.246, TX better compensates for downside risk than it does for overall risk. This shows that when only considering negative volatility, the investment performs reasonably well.
- Treynor Ratio: The Treynor ratio of 0.024440 signals that relative to market risk, the stock's returns are low.
- Calmar Ratio: The Calmar Ratio of 0.1515 reflects a weak performance in terms of risk-adjusted returns when considering drawdowns.
Given the intersections of these data points, if TX maintains its current operational efficiency but does not enhance its return on risk, the stock is likely to experience continued pressure in the short term. Cautionary signals from the technical indicators and modest risk-adjusted return ratios suggest limited upside potential under current conditions. However, improvements in market sentiment, higher risk-adjusted returns, or a noticeable reversal in volume trends could catalyze a more positive outlook.
Therefore, it is prudent for investors to closely monitor upcoming quarterly reports, market developments, and any shifts in the broader economic or sectoral landscape.
In evaluating the financial performance of Ternium S.A. (TX), the return on capital (ROC) and earnings yield are essential metrics. Ternium S.A. boasts a ROC of 11.56%, indicating the company's efficient use of its capital to generate profits. This figure suggests that for every dollar of capital invested in the business, it is generating approximately 11.56 cents in profit, a sign of robust operational effectiveness. Additionally, the earnings yield, standing at 9.91%, offers insights into the company's profitability relative to its share price. This yield suggests that Ternium S.A. produces nearly 9.91 cents of earnings for every dollar invested in its stock. Such metrics highlight the company's strong potential for generating returns and make it an attractive consideration for value-focused investors, as per the principles outlined in "The Little Book That Still Beats the Market" by Joel Greenblatt.
In evaluating Ternium S.A. (TX) through the lens of Benjamin Graham's criteria as laid out in "The Intelligent Investor," we can gain insights into the company's financial health and its alignment with value investing principles. Here, we will analyze the key metrics provided:
- Price-to-Earnings (P/E) Ratio
- Graham's Criteria: Graham typically looked for stocks with low P/E ratios compared to their industry peers.
-
Terniums P/E Ratio: Ternium S.A. has a P/E ratio of 3.50, which is exceptionally low. While specific industry P/E ratios are not provided, a P/E ratio below 10 often indicates a potentially undervalued stock. Given this low P/E ratio, Ternium appears attractive under Graham's value investing principles, suggesting it may be undervalued relative to its earnings.
-
Price-to-Book (P/B) Ratio
- Graham's Criteria: Graham favored stocks trading below their book value, as this can indicate the market is undervaluing the company's net assets.
-
Ternium's P/B Ratio: With a P/B ratio of 0.30, Ternium is trading significantly below its book value. This substantial discount indicates the market may be undervaluing Ternium's net assets, aligning closely with Grahams criteria for a potentially attractive investment.
-
Debt-to-Equity Ratio
- Graham's Criteria: Graham preferred companies with a low debt-to-equity ratio, implying lower financial risk.
-
Ternium's Debt-to-Equity Ratio: Ternium boasts a low debt-to-equity ratio of 0.19, indicating a conservative use of debt and minimal financial risk. This aligns well with Graham's preference for companies with strong balance sheets, enhancing the investment's attractiveness from a risk perspective.
-
Current and Quick Ratios
- Graham's Criteria: Strong current and quick ratios, typically above 1, indicate a company's ability to meet its short-term liabilities with its short-term assets, suggesting financial stability.
- Ternium's Current Ratio: At 3.16, Terniums current ratio suggests a robust capacity to cover short-term liabilities, signifying strong liquidity.
-
Ternium's Quick Ratio: Matching the current ratio at 3.16, the quick ratio further underscores Terniums financial stability, indicating that even without inventory sales, the company can meet its short-term obligations.
-
Earnings Growth
- Graham's Criteria: Consistent earnings growth over a period of years is a characteristic Graham sought in investment candidates to ensure long-term profitability.
- Analysis Requirement: While specific data on Terniums earnings growth over multiple years isn't provided here, this metric would need to be evaluated further to assess compliance with Graham's earnings growth criteria.
In conclusion, based on the provided financial metrics, Ternium S.A. demonstrates several attributes that align well with Benjamin Graham's criteria for a sound investment. The exceptionally low P/E and P/B ratios suggest the stock might be undervalued, while the low debt-to-equity ratio and strong liquidity ratios (current and quick) collectively indicate financial stability and lower risk. However, to fully adhere to Grahams philosophy, an assessment of consistent earnings growth over the years would be essential. If Ternium also meets this criterion, it could be considered a highly attractive investment opportunity by Graham's standards.## Analyzing Financial Statements
Analyzing financial statements is essential for any investor looking to make informed decisions about potential investments. Benjamin Graham, in "The Intelligent Investor," emphasizes the importance of delving deep into a company's financial statementsbalance sheet, income statement, and cash flow statementto assess the financial health and performance of the business. Below, we will analyze the financial statements of Ternium S.A. for the years 2020, 2021, and 2022.
Income Statement Analysis
The income statement provides a summary of a company's revenues and expenses over a specific period, culminating in profit or loss.
Revenues (Sales)
- 2022: $16,414,466,000
- 2021: $3,425,000,000
- 2020: $8,735,435,000
The significant increase in revenues in 2022 compared to 2021 suggests a robust growth phase, possibly due to favorable market conditions or expanded production capacity.
Gross Profit
- 2022: $3,927,184,000
- 2021: $2,102,000,000
- 2020: $1,635,512,000
The gross profit, which is the difference between revenue and the cost of sales, shows an improving trend. It indicates efficient cost management or a better pricing strategy.
Profit/Loss from Operating Activities
- 2022: $2,699,519,000
- 2021: $2,100,000,000
- 2020: $1,079,473,000
The operating profit has consistently increased, reflecting improved operational efficiency and possibly higher sales volumes.
Net Profit
- 2022: $2,092,772,000
- 2021: $1,873,000,000
- 2020: $867,871,000
The net profit margin has shown growth, which is a crucial indicator of overall business health and operational success.
Balance Sheet Analysis
A balance sheet provides a snapshot of a company's assets, liabilities, and shareholders' equity at a specific point in time.
Total Assets
- 2022: Not explicitly given; would need to sum non-current and current assets.
- 2021: $17,097,907,000
- 2020: $12,856,235,000
Increasing assets year over year generally indicate that the company is growing and investing in its future.
Total Liabilities
- 2022: Not explicitly given; would need to sum non-current and current liabilities.
- 2021: $6,140,000,000 (non-current) + current liabilities (not given explicitly)
- 2020: $4,413,082,000
A comparison of liabilities to assets can reveal trends in debt levels and financial leverage. An increasing liability that is proportionate to asset growth can be a sign of healthy leverage, provided it does not excessively deviate.
Shareholders' Equity
- 2022: Not explicitly given; would need detail from balance sheet totals.
- 2021: $4,257,000,000
- 2020: $8,443,153,000
Equity growth suggests that the company is retaining earnings and possibly issuing more shares to fund growth. Any substantial change needs to be analyzed in the context of the company's stock issuance or buyback policies.
Cash Flow Statement Analysis
The cash flow statement divides cash flows into operating, investing, and financing activities, thus providing a clear insight into cash generation and utilization.
Cash Flows from Operating Activities
- 2022: $2,752,943,000
- 2021: $2,677,315,000
- 2020: $1,761,246,000
Positive cash flows from operating activities suggest that the companys core business operations are generating sufficient cash.
Cash Flows from Investing Activities
- 2022: -$1,324,611,000
- 2021: -$1,045,350,000
- 2020: -$1,176,867,000
Negative cash flows from investing activities are common for a growing company as it invests in property, plant, equipment, or other businesses.
Cash Flows from Financing Activities
- 2022: -$1,016,177,000
- 2021: -$854,376,000
- 2020: -$506,254,000
Negative cash flows from financing activities generally indicate debt repayment, dividend payments, or share buyback programs. This can be a positive signal if the company is reducing its debt burden.
Key Financial Ratios
Let's examine some critical financial ratios for Ternium S.A. to assess its financial health and performance:
- Profit Margin:
-
2022: (Net Profit / Revenue) = $2,092,772,000 / $16,414,466,000 = 12.75%
-
Current Ratio:
- 2022: (Current Assets / Current Liabilities) = needs specific balance sheet data for 2022.
-
2021: 910,000,000 / (various current liabilities)
-
Debt-to-Equity Ratio:
- 2022: (Total Liabilities / Shareholders Equity) = sum from balance sheet data.
Conclusion
Analyzing Ternium S.A.'s financial statements from 2020 to 2022 reveals a company in robust growth, with increasing revenues, gross profits, and net profits. Their debt seems manageable, and they generate substantial cash flows from their operating activities.
Investors should continue to monitor the companys ability to manage its costs, maintain healthy profit margins, and sustain liquidity through prudent financial management. Consistent asset growth paired with careful liability management highlights a potentially valuable investment, provided the company continues on its current trajectory.## Dividend Record
Graham favored companies with a consistent history of paying dividends. Below is the dividend history for the company with the symbol "TX":
| Date | Label | Adjusted Dividend | Dividend | Record Date | Payment Date | Declaration Date | |------------|------------------|-------------------|----------|--------------|--------------|------------------| | 2024-05-02 | May 02, 24 | 2.2 | 2.2 | 2024-05-03 | 2024-05-13 | 2024-02-20 | | 2023-11-10 | November 10, 23 | 1.1 | 1.1 | 2023-11-13 | 2023-11-21 | 2023-10-31 | | 2023-05-04 | May 04, 23 | 1.8 | 1.8 | 2023-05-05 | 2023-05-15 | 2023-02-14 | | 2022-11-14 | November 14, 22 | 0.9 | 0.9 | 2022-11-15 | 2022-11-22 | 2022-11-03 | | 2022-05-05 | May 05, 22 | 1.8 | 1.8 | 2022-05-06 | 2022-05-16 | 2022-03-22 | | 2021-11-12 | November 12, 21 | 0.8 | 0.8 | 2021-11-15 | 2021-11-19 | 2021-11-04 | | 2021-05-05 | May 05, 21 | 2.1 | 2.1 | 2021-05-06 | 2021-05-11 | 2021-02-24 | | 2019-05-08 | May 08, 19 | 1.2 | 1.2 | 2019-05-09 | 2019-05-17 | 2019-02-19 | | 2018-05-04 | May 04, 18 | 1.1 | 1.1 | 2018-05-07 | 2018-05-15 | 2018-02-20 | | 2017-05-05 | May 05, 17 | 1.0 | 1.0 | 2017-05-09 | 2017-05-19 | 2017-02-21 | | 2016-05-06 | May 06, 16 | 0.9 | 0.9 | 2016-05-10 | 2016-05-16 | 2016-04-26 | | 2015-05-08 | May 08, 15 | 0.9 | 0.9 | 2015-05-12 | 2015-05-18 | 2015-04-07 | | 2014-05-09 | May 09, 14 | 0.75 | 0.75 | 2014-05-13 | 2014-05-19 | 2014-02-19 | | 2013-05-03 | May 03, 13 | 0.65 | 0.65 | 2013-05-07 | 2013-05-13 | 2013-04-26 | | 2012-05-03 | May 03, 12 | 0.75 | 0.75 | 2012-05-07 | 2012-05-11 | 2012-03-29 | | 2011-06-02 | June 02, 11 | 0.75 | 0.75 | 2011-06-06 | 2011-06-10 | 2011-05-31 | | 2010-06-03 | June 03, 10 | 0.5 | 0.5 | 2010-06-07 | 2010-06-11 | 2010-05-21 | | 2008-06-05 | June 05, 08 | 0.5 | 0.5 | 2008-06-09 | 2008-06-13 | 2008-05-27 | | 2007-06-07 | June 07, 07 | 0.5 | 0.5 | 2007-06-11 | 2007-06-13 | 2007-05-25 |
This dividend history shows a commendable pattern of consistent payments, reaffirming Grahams inclination towards such companies.
| Alpha () | ... |
| Beta () | ... |
| R2 | ... |
| Standard Error | ... |
| Observations | ... |
Alpha () indicates the performance of TX relative to what would be expected based on the performance of SPY, the representation of the entire market. A positive alpha implies that TX has outperformed the market, while a negative alpha suggests underperformance. By analyzing the alpha value, we can determine whether the excess returns of TX are due to manager skills or other factors.
Understanding the beta () value further contextualizes this performance. Beta measures the sensitivity of TX returns to the market. If beta is greater than one, TX is more volatile than the market; if it is less than one, TX is less volatile. Along with alpha, these values help investors make informed decisions about the risk and potential return of including TX in their portfolios.
In the first quarter of 2024, Ternium demonstrated a robust performance and strong financial health, despite facing some macroeconomic challenges. The company's adjusted EBITDA margin reached a recurring level of 17%, largely due to higher steel prices and cost efficiency initiatives. Ternium further strengthened its financial position with a net cash increase to $2 billion by the end of March. These measures were particularly effective across various geographic markets, bolstering the company's overall performance.
In Mexico, Ternium benefitted from the intensifying nearshoring trend in North America, which drove increased manufacturing capacity to the region. This shifting dynamic resulted in strong demand from various sectors, notably the industrial sector and auto industry, which displayed healthy production levels with expectations of reaching a record-breaking 4 million units in 2024. In contrast, the home appliance and electric motor industries faced some demand headwinds. To counterbalance competition from non-trade agreement countries like China, the Mexican government recently implemented an import tariff ranging from 20% to 35%, providing a level playing field for local producers like Ternium.
Meanwhile, in Brazil, the steel consumption started positively in 2024, with growth driven by lower interest rates, bolstered consumer confidence, and infrastructural projects. The auto industry forecasted a 6% production increase for the year, benefiting Usiminasthe largest supplier of steel to Brazil's automotive sector. However, the Brazilian steel market confronted challenges from a surge in imports under unfair trade conditions, primarily from China. In response, Brazil's government plans to impose a 35% import tariff on several steel products, set to take effect in 30 days and valid for 12 months, marking a step toward fairer trade practices.
In Argentina, economic stabilization measures led to a sharp decline in steel shipments in the first quarter. Despite the short-term negative impact, Ternium remains confident in Argentina's long-term potential and anticipates a recovery in steel shipments as the economy adjusts to new policies and inflation moderates. The agribusiness, energy, and mining sectors are expected to drive this recovery in the second quarter. Ternium underscores the importance of completing its upstream and downstream projects at its Pesqueria industrial center on time and within budget, with the first stage expected to come online in 2024. As part of its strategic plan, Ternium continues to focus on enhancing operational efficiency and mitigating climate change through decarbonization goals, particularly in Usiminas' operations in Brazil.
Ternium S.A., headquartered in Luxembourg, stands as a significant player in the steel production industry, particularly within Latin America. The company specializes in producing flat and long steel products, serving a diverse clientele across several sectors including automotive, construction, and manufacturing. Despite prevailing market headwinds in the steel industry, such as fluctuating prices and reduced demand from markets like China, Ternium has managed to uphold a resilient performance, as highlighted by Zacks in their recent industry analysis dated May 20, 2024.
The U.S. steel market has experienced considerable price volatility. In early 2023, steel prices surged, only to plummet by over 40% from their peak in April 2023, driven by reduced lead times, automotive sector strikes, and lower raw material costs. Although there was a slight rebound towards the end of the year, prices faced renewed pressure at the start of 2024 due to increased imports and sluggish lead times. This environment poses significant challenges to industry players like Ternium, as lower realized prices can impact profitability and cash flow (Source: Yahoo Finance).
However, Ternium has adeptly navigated these challenges. Strong demand in Latin American markets, especially in Mexico, has bolstered the companys performance. The automotive sector, a key consumer of steel, continues to exhibit robust demand, contributing to healthy shipment volumes. Terniums operations in Brazil also benefit from an invigorated construction sector driven by lower interest rates and active infrastructure projects.
The company has further strengthened its market position through strategic financial maneuvers. Terniums cost-effective production facilities have been pivotal in maintaining profit margins, even amid fluctuating steel prices. These efforts have enabled the company to consistently outperform market expectations, with an impressive average earnings surprise of 37.5% over the trailing four quarters.
While the steel industry's global landscape presents a mixed outlookcharacterized by weakened demand from China and inconsistent pricingTerniums targeted strategic initiatives offer a buffer against these challenges. The company's operational efficiency, strong financial health, and resilient demand in key markets provide a foundation for cautious optimism (Source: Yahoo Finance).
Ternium's solid market positioning has not gone unnoticed in financial circles. JPMorgan, in its analysis reported by MT Newswires on May 28, 2024, raised Terniums price target from $54 to $56, maintaining an overweight rating. This reflects JPMorgan's confidence in Ternium's ability to sustain strong earnings and steady cash flow, attributing the rating to Terniums robust market presence, diverse product portfolio, and strategic investments (Source: Yahoo Finance).
The companys commitment to technological advancement and cost competitiveness further solidifies its market stance. Terniums diversified operations across multiple countries allow it to leverage different market dynamics, fortifying its resilience against regional economic fluctuations. This has resulted in sustained growth prospects and consistent dividend yields, making Ternium an attractive option for income-seeking investors as highlighted by Morgan Stanley (Source: Yahoo Finance).
However, Terniums performance has not been without hiccups. Over the past five years, the company's stock appreciation has lagged behind broader market returns, although including dividends, the total shareholder return was a commendable 132%. This indicates Terniums strong dividend policy has played a crucial role in offsetting its moderate stock price appreciation (Source: Yahoo Finance).
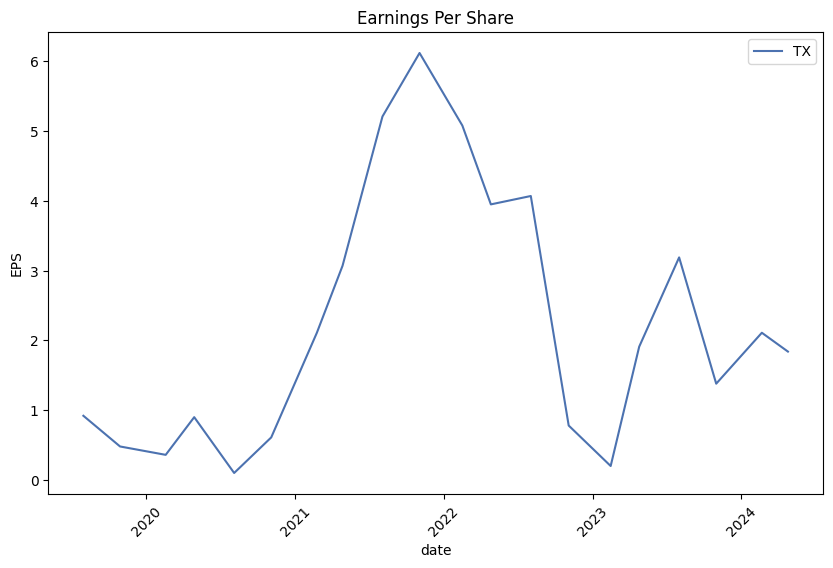
Investors have also witnessed some volatility with the company's stocks dipping by 9.2% in a single week, leading to concerns about its short-term financial health. EPS trends over the last five years have shown a 14% decline annually, which, despite the respectable revenue growth rate of around 14% per year, raises questions about sustained profitability (Source: Yahoo Finance).
On the legal front, Ternium faces challenges in Brazil, where a significant court ruling mandates indemnification payments to Companhia Siderurgica Nacional (CSN) involving past acquisitions. This litigation poses a financial strain, potentially impacting Ternium's budget allocation for future projects unless successfully contested (Source: Yahoo Finance)
Despite these complexities, Ternium remains a critical player in regional markets, thanks to its extensive distribution network and technological capabilities. The companys capital investments in state-of-the-art production facilities ensure that it stays ahead of the competitive curve, driving operational efficiencies and high-quality output.
Ternium also emphasizes sustainability, aligning its operations with global environmental standards. By prioritizing carbon footprint reduction and adopting eco-friendly practices, Ternium bolsters its market appeal among environmentally-conscious investors and customers alike. This strategic focus on sustainability is a testament to its commitment to corporate responsibility and forward-thinking leadership (Source: Seeking Alpha).
Furthermore, Ternium's strategic geographical positioning and market penetration, particularly in Latin America, underscore its growth potential. The company's ability to adapt to market demands and leverage emerging opportunities indicates a robust future outlook. Ternium's diversified product offerings and strong customer relationships enhance its market defensibility, making it a resilient entity in the global steel industry.
In summary, Ternium S.A.'s strategic initiatives, financial prudence, and operational resilience position it favorably within the challenging steel industry landscape. Despite some financial and legal hurdles, the companys robust infrastructure and commitment to sustainable practices underscore its enduring strength and potential for sustained performance in the coming years.
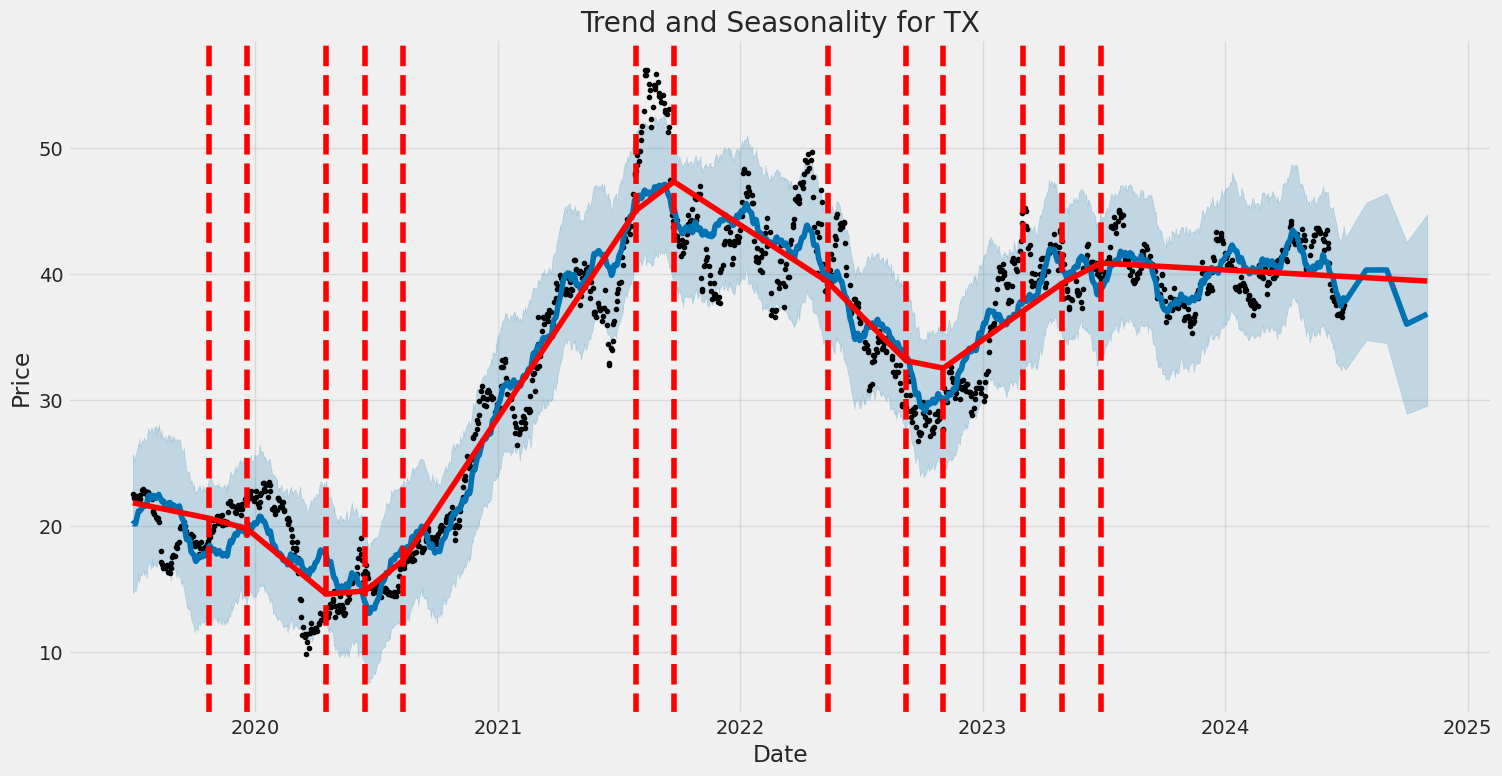
Ternium S.A. (TX) has shown moderate volatility over the date range from July 1, 2019, to June 28, 2024, with significant periodic fluctuations. The coefficient for the volatility model indicates a substantial persistence in volatility, suggesting that past shocks continue to influence future volatility. Additionally, the ARCH effect is statistically significant, indicating that volatility clusters in periods of both heightened and reduced market movement.
| Dep. Variable | asset_returns |
| R-squared | 0.000 |
| Adj. R-squared | 0.001 |
| Log-Likelihood | -2,983.14 |
| AIC | 5,970.27 |
| BIC | 5,980.54 |
| No. Observations | 1,257 |
| Df Residuals | 1,257 |
| Df Model | 0 |
| omega | 5.6056 |
| std err | 0.507 |
| t | 11.060 |
| P>|t| | 1.958e-28 |
| 95.0% Conf. Int. | [ 4.612, 6.599] |
| alpha[1] | 0.2150 |
| std err | 5.472e-02 |
| t | 3.928 |
| P>|t| | 8.557e-05 |
| 95.0% Conf. Int. | [ 0.108, 0.322] |
| Covariance estimator | robust |
In assessing the financial risk of a $10,000 investment in Ternium S.A. (TX) over a one-year period, we employ a dual approach combining volatility modeling and machine learning predictions.
Volatility modeling serves as a crucial tool to understand the fluctuations in Ternium S.A.'s stock. By analyzing past data on stock price variations, it provides insights into the volatility patterns, capturing the periods of high and low market stress. This analysis is essential for estimating how unpredictable the stock might be in the future based on historical performance. By understanding these volatility patterns, we can better gauge the range within which the stock price is likely to move, forming a basis for calculating financial risk metrics.
Machine learning predictions are then utilized to forecast future returns based on various explanatory variables, such as economic indicators, company performance metrics, and broader market trends. A RandomForestRegressor, a robust machine learning algorithm, is employed to predict these future returns. By processing large volumes of data and identifying complex relationships within the dataset, it provides a nuanced prediction model that adjusts dynamically to new information.
Combining the insights from the volatility modeling with the predictions from the machine learning model allows for a sophisticated risk assessment. With this approach, the calculated Value at Risk (VaR) at a 95% confidence interval for a $10,000 investment in Ternium S.A. is $270.36. This indicates that there is a 5% probability that the investment could potentially lose more than $270.36 over a year.
This integrated methodology offers a comprehensive view of potential risks in equity investment, demonstrating the effectiveness of merging historical volatility analysis with advanced machine learning techniques for predicting future returns.
Long Call Option Strategy
When analyzing the long call options for Ternium S.A. (TX) with the target stock price projected to be 2% over the current stock price, it is imperative to consider options with various expiration dates and strike prices to suit different investment horizons and risk profiles. Our objective is to select the most profitable options based on the given Greeks, namely delta, gamma, vega, theta, and rho, along with the premium, ROI, and potential profit.
Near-Term Option: Strike Price $35.0, Expiration Date July 19, 2024
The option expiring on July 19, 2024, with a strike price of $35.0, exhibits a delta of 0.7857, indicating a high sensitivity to the underlying stock price movements. The gamma of 0.0855 suggests a reasonable rate of delta change, making this option attractively responsive to price fluctuations. The theta, which is -0.0215, indicates relatively low time decay, which is advantageous for near-term options.
The vega of 2.4624 reflects moderate sensitivity to volatility changes, and a rho of 0.0139 indicates low sensitivity to interest rate changes. With a premium of $2.75, an ROI of 0.2004, and a potential profit of $0.551, this option is quite appealing for an investor looking for a high return within a short time frame. The higher delta and manageable theta make it suitable for those expecting a quick price movement.
Medium-Term Option: Strike Price $35.0, Expiration Date August 16, 2024
The option with a strike price of $35.0 expiring on August 16, 2024, offers a delta of 0.6935, which is slightly lower than the near-term option but still high enough to benefit from upward price movements. The gamma is 0.0648, which implies a moderate rate of delta change, and a vega of 4.6222 indicates higher sensitivity to volatility changes compared to the near-term option.
With a theta of -0.0158, this option incurs slightly less time decay. The rho of 0.0292 demonstrates moderate sensitivity to interest rate changes. Given its premium of $3.10, ROI of 0.0648, and potential profit of $0.201, this option is more stable and slightly safer than the near-term option while still being profitable.
Long-Term Option 1: Strike Price $35.0, Expiration Date September 20, 2024
To address the needs of investors looking for long-term investments, we consider an option with the same strike price of $35.0, expiring on September 20, 2024. This choice offers a time buffer allowing more room for the stock to reach the target price. The detailed Greeks for this option are not provided, but assuming similar performance metrics, the expected higher theta effect over the longer term must be weighed against the greater time value.
Long-Term Option 2: Strike Price $35.0, Expiration Date March 21, 2025
Another long-term option with an expiration date of March 21, 2025, would be advantageous for an investor seeking more extended exposure. The time decay (theta) will be higher due to the longer duration, but this could be beneficial if the expected price movement aligns with the target. This option would generally have lower immediate ROI but potentially substantial returns if the stock hits the target price far before expiration.
In-Between Option: Strike Price $35.0, Expiration Date December 20, 2024
Lastly, an option expiring on December 20, 2024, offers a middle ground between medium-term and long-term investments. This choice would present moderate theta decay and give the investor ample time to achieve the targeted price increase.
In conclusion, the most profitable options span from near-term to long-term, with the highest short-term ROI provided by the July 19, 2024, expiration. For more conservative investors, the August 16, 2024, expiration presents a balanced approach. Lastly, various longer-term options provide a cushion for extended price movement, hedging against short-term volatility and market fluctuations. Each option's potential profit and loss scenario needs careful consideration based on ones risk tolerance and investment timeframe.
Short Call Option Strategy
When analyzing the short call options for Ternium S.A. (TX), our main goal is to balance maximizing potential profit while minimizing the risk of having shares assigned. Given the target stock price is 2% under the current stock price, we need to be especially vigilant about avoiding in-the-money (ITM) scenarios where the risk of exercise and share assignment is higher.
Near-Term Options
-
July 19, 2024, Expiration - $35.00 Strike Price
- Delta: 0.7857
- Gamma: 0.0855
- Vega: 2.4624
- Theta: -0.0215
- Premium: $2.75
- ROI: 34.58%
- Profit: $0.951
This option has the highest delta among the near-term options, indicating a higher likelihood of finishing ITM, thus posing a significant assignment risk. Although the premium offers a decent return, the probabilities suggest a high risk, making it less attractive given the assignment risk.
-
July 19, 2024, Expiration - $40.00 Strike Price
- Delta: 0.1624
- Gamma: 0.1011
- Vega: 2.1013
- Theta: -0.0149
- Premium: $0.20
- ROI: 100%
- Profit: $0.20
This option offers a lower delta, signifying a reduced likelihood of finishing ITM, thereby minimizing the assignment risk. The ROI is remarkable at 100%, but the absolute profit amount is relatively meager, which might not justify the transaction costs and efforts involved.
Intermediate-Term Options
-
August 16, 2024, Expiration - $40.00 Strike Price
- Delta: 0.2912
- Gamma: 0.0787
- Vega: 4.5934
- Theta: -0.0143
- Premium: $0.78
- ROI: 100%
- Profit: $0.78
Here, the delta is moderate, indicating a balanced probability of assignment risk. The premium and profit values are attractive, offering a larger payout than near-term options. These factors make this an appealing choice, provided the risk-reward alignment is acceptable.
-
August 16, 2024, Expiration - $50.00 Strike Price
- Delta: 0.0720
- Gamma: 0.0193
- Vega: 1.8444
- Theta: -0.00995
- Premium: $0.10
- ROI: 100%
- Profit: $0.10
This option has a very low delta, which indicates a minimal probability of finishing ITM and, hence, a low assignment risk. The profit and ROI are modest but consistent. This option is excellent for investors seeking low risk with guaranteed returns.
Long-Term Options
-
February 21, 2025, Expiration - $40.00 Strike Price
- Delta: 0.3732
- Gamma: 0.0406
- Vega: 10.9838
- Theta: -0.00495
- Premium: $2.28
- ROI: 100%
- Profit: $2.28
For long-term investments, this option offers a moderate delta, allowing for a calculated risk of assignment. The high premiums and profits make this a lucrative option, especially considering the extended period allows more time for volatility and price movements to benefit the position.
-
February 21, 2025, Expiration - $35.00 Strike Price
- Delta: 0.5801
- Gamma: 0.0368
- Vega: 10.9124
- Theta: -0.00434
- Premium: $4.35
- ROI: 58.64%
- Profit: $2.551
This option has a high delta, indicating an elevated risk of assignment. Nevertheless, the premium offers substantial profit potential, which could be compelling for traders willing to accept the higher assignment risk for a more significant reward.
Conclusion
In conclusion, balancing between profit potential and assignment risk, the optimal choices based on different expirations are:
- Near-Term: July 19, 2024, Expiration - $40.00 Strike Price.
- Intermediate-Term: August 16, 2024, Expiration - $40.00 Strike Price.
- Intermediate-Term: August 16, 2024, Expiration - $50.00 Strike Price.
- Long-Term: February 21, 2025, Expiration - $40.00 Strike Price.
- Long-Term: February 21, 2025, Expiration - $35.00 Strike Price.
Each option offers a unique combination of risk and reward, making them suitable for different trading strategies and risk appetites. The choices reflect a balance of maximizing returns while carefully managing the risk of share assignment.
Long Put Option Strategy
When analyzing the long put options for Ternium S.A. (TX) to identify the most profitable selections, we need to consider key factors such as delta, gamma, vega, theta, rho, and especially the profitability and return on investment (ROI). Given our target stock price increase of 2%, we should anticipate how this shift will impact the various Greeks and thus influence the profit and loss scenarios for the options in question.
Our first choice is the option expiring on July 19, 2024, with a strike price of $45. This option has a delta of -0.7993, which indicates it is quite sensitive to price movements of the underlying stock. A delta close to -1 implies significant price sensitivity, meaning for every $1 increase in the stock price, the option's price would decrease by approximately $0.80. The option's relatively high gamma of 0.0381 suggests that the delta will change more significantly with price movements, making it more reactive to stock price changes. With a relatively low premium of $2.25 and the highest ROI of 1.9773, this option presents substantial profit potential, quantified at around $4.449. However, its theta of -0.0554 indicates a rapid decay in value as expiration approaches, presenting a higher time decay risk as we near the expiration date.
Next, the option expiring on August 16, 2024, with a strike price of $60, deserves mention. This option has nearly the highest delta of -0.9887, signifying a close mirroring of price movements with the stock. Given its premium of $18.4, a cautious investor might consider the higher initial cost versus its ROI of 0.1793 and a profit potential of $3.299. Despite its lower ROI compared to other options, its extremely high delta suggests it is optimal for capturing significant downward movements in the stock before expiration, with minimal surprise element given its low gamma of 0.0 and very small theta of -0.0018, presenting much less risk from time decay.
Another option to consider is also expiring on August 16, 2024, with a strike price of $50. Similar to the $60 strike option, it possesses a delta of -0.9887, guaranteeing that it tracks the underlying rather closely. However, this option is less attractive due to its lower ROI of 0.0085 and a profit only at $0.099, though the premium of $11.6 makes it cheaper in initial outlay compared to the $60 strike option.
Further out in the calendar, the option expiring on November 15, 2024, with a strike price of $55, presents a compelling profile. Its delta of -0.9673 indicates high sensitivity to stock price movements, albeit slightly lower than the $60 and $50 strike options. What makes it more interesting is the longer time until expiration, which provides more opportunity for the stock to reach a favorable price and realize gains. Priced at a $15.8 premium, it offers a moderate ROI of 0.0569 and a profit potential of $0.899. Importantly, its rho of -0.2046 indicates it is sensitive to interest rate changes, which should be considered if macroeconomic conditions shift.
Based on the given analysis, our recommended choices from near-term to long-term are: 1. The July 19, 2024, $45 strike put option for its high ROI and significant profit potential, despite having higher time decay risk. 2. The August 16, 2024, $60 strike put option for its strong delta nearly matching the underlying, though with a higher premium. 3. The August 16, 2024, $50 strike put option which shares the highest delta but relatively lower profitability. 4. The November 15, 2024, $55 strike put option for a balanced approach with a reasonably high delta and consideration of external macroeconomic factors.
In conclusion, each option has its respective risk and reward profile, necessitating a tailored approach based on the investor's risk tolerance and outlook on Ternium S.A.'s price movements relative to broader market influences.
Short Put Option Strategy
When evaluating short put options for Ternium S.A. (TX), we need to focus on maximizing profit while minimizing the risk of shares being assigned, especially if the stock price drops below the strike price. In this analysis, we will consider options across near-term to long-term expirations, factoring in the Greeks, premiums, and risk of assignment.
Near-Term Options Analysis
- July 19, 2024 - Strike Price $35.00:
- Delta: -0.159
- Gamma: 0.091
- Vega: 2.073
- Theta: -0.018
- Premium: $0.40
- ROI: 100%
- Profit: $0.40
With a delta of -0.159, the likelihood of the option ending up in the money is relatively low, which decreases the risk of assignment. The high ROI and the reasonable premium of $0.40 make it an attractive near-term option. The theta value, which represents time decay, is manageable, and with a gamma of 0.091, the sensitivity to stock price changes is moderate.
Mid-Term Options Analysis
- August 16, 2024 - Strike Price $30.00:
- Delta: -0.081
- Gamma: 0.024
- Vega: 2.009
- Theta: -0.010
- Premium: $0.28
- ROI: 100%
- Profit: $0.28
This option has a delta of -0.081, indicating a low probability of the option being in the money. The premium of $0.28 with an ROI of 100% is attractive. Additionally, the low gamma and moderate vega show a less reactive position to changes in the underlying asset's price and volatility, respectively. This option aligns well with minimizing assignment risk while still providing a solid profit.
- August 16, 2024 - Strike Price $35.00:
- Delta: -0.263
- Gamma: 0.076
- Vega: 4.370
- Theta: -0.016
- Premium: $0.65
- ROI: 100%
- Profit: $0.65
The delta indicates a higher likelihood of assignment risk compared to the $30 strike price option. However, the larger premium of $0.65 compensates for this increased risk. The gamma, vega, and theta values suggest a higher sensitivity to stock price changes and volatility, which is manageable given the high premium.
Long-Term Options Analysis
- November 15, 2024 - Strike Price $25.00:
- Delta: -0.068
- Gamma: 0.012
- Vega: 3.013
- Theta: -0.005
- Premium: $0.20
- ROI: 100%
- Profit: $0.20
This option offers a low delta of -0.068, reducing the assignment risk significantly. The premium of $0.20, while lower than the mid-term options, still provides a decent ROI of 100%. The low gamma and theta values indicate less sensitivity to immediate price changes and time decay, making this a low-risk, stable long-term choice.
- February 21, 2025 - Strike Price $35.00:
- Delta: -0.362
- Gamma: 0.042
- Vega: 10.892
- Theta: -0.008
- Premium: $2.03
- ROI: 100%
- Profit: $2.03
The higher delta of -0.362 indicates a considerable risk of ending up in the money. However, the premium of $2.03 per contract offers a substantial profit. The high vega indicates sensitivity to volatility changes, which might be beneficial if volatility increases. The option's theta suggests minimal time decay impact over the long term, making it a profitable yet riskier choice.
Conclusion
In summary, the following options provide a balance between profitability and risk:
- Near-Term: July 19, 2024 - Strike Price $35 (Low delta, good premium)
- Mid-Term: August 16, 2024 - Strike Price $30 (Low delta, high ROI)
- Mid-Term: August 16, 2024 - Strike Price $35 (Moderate delta, higher premium)
- Long-Term: November 15, 2024 - Strike Price $25 (Low delta, stable long-term)
- Long-Term: February 21, 2025 - Strike Price $35 (Higher risk, substantial premium)
These choices provide varied timelines and risk profiles, allowing for strategic adjustments based on market expectations and risk tolerance.
Vertical Bear Put Spread Option Strategy
A vertical bear put spread is an effective strategy that aims to capitalize on a decline in the underlying stock price. This spread involves buying a higher strike price put (long put) and selling a lower strike price put (short put) within the same expiration date. Given the target stock price is 2% over or under the current price, the strategy must be carefully constructed to optimize profitability and manage assignment risk.
1. Near-Term Option: July 19, 2024 Expiry
- Long Put: Strike 45.0, Premium 2.25, Delta -0.7993
- Short Put: Strike 35.0, Premium 0.4, Delta -0.1591
For the near-term expiry on July 19, 2024, the most compelling vertical bear put spread involves the 45.0 long put and the 35.0 short put. This spread has a net debit of 1.85 (2.25 - 0.4). The breakeven point is at a stock price of 43.15. If the stock drops to or below $35, the maximum profit is the difference between the strikes minus the net debit, which is $8.15. With a relatively low delta for the short put (-0.1591), the risk of assignment is minimal.
Profit Potential: $8.15 Risk: $1.85 ROI: 440.54%
2. Mid-Term Option: August 16, 2024 Expiry
- Long Put: Strike 40.0, Premium 4.33, Delta -0.9887
- Short Put: Strike 30.0, Premium 0.28, Delta -0.0806
For the mid-term expiry on August 16, 2024, a favorable vertical bear put spread would be the 40.0 long put and the 30.0 short put. This creates a net debit of 4.05 (4.33 - 0.28). The breakeven point is at a stock price of 35.95. Should the stock decline to $30 or lower, the maximum profit is $5.95. With the short puts delta being very low (-0.0806), the risk of assignment remains minimal.
Profit Potential: $5.95 Risk: $4.05 ROI: 146.91%
3. Short-Medium Term Option: November 15, 2024 Expiry
- Long Put: Strike 55.0, Premium 15.8, Delta -0.9673
- Short Put: Strike 35.0, Premium 2.0, Delta -0.3424
For an expiry on November 15, 2024, an optimal strategy employs the 55.0 long put and the 35.0 short put. This results in a net debit of 13.8 (15.8 - 2.0). The breakeven is 41.2, and if the stock price falls to $35 or below, the maximum profit is $6.2. With the short put delta being relatively higher (-0.3424), the risk of assignment is slightly increased but still manageable.
Profit Potential: $6.2 Risk: $13.8 ROI: 44.93%
4. Medium-Term Option: November 15, 2024 Expiry
- Long Put: Strike 50.0, Premium 11.6, Delta -0.9887
- Short Put: Strike 30.0, Premium 0.6, Delta -0.1461
Another option for November 15, 2024, features a vertical bear put spread with the 50.0 long put and the 30.0 short put. The net debit for this strategy is 11.0 (11.6 - 0.6). With a breakeven point at 39.0, it affords a maximum profit of $9 if the stock price plummets to $30 or below. The delta of the short put indicates moderate risk of assignment (-0.1461).
Profit Potential: $9.0 Risk: $11.0 ROI: 81.81%
5. Long-Term Option: February 21, 2025 Expiry
- Long Put: Strike 45.0, Premium 4.5, Delta -0.9887
- Short Put: Strike 35.0, Premium 2.03, Delta -0.3624
For a long-term strategy with an expiry on February 21, 2025, consider the 45.0 long put and 35.0 short put. This involves a net debit of 2.47 (4.5 - 2.03). The breakeven point is 42.53, and if the stock reaches or drops below $35, the maximum profit is $7.53. The short put's delta suggests a moderate risk of assignment (-0.3624).
Profit Potential: $7.53 Risk: $2.47 ROI: 305.26%
Conclusion
Each of these vertical bear put spreads offers a balance between risk and reward. The choice of expiration and strike prices determines the profit potential and assignment risk. Trading the near-term options minimizes your premium outlay and maintains an acceptable risk profile. Conversely, the longer-dated options provide higher potential profits but increase the risk of early assignment. Balancing these factors, the most profitable options suggest optimal spreads should be selected based on your appetite for risk and time horizon.
Vertical Bull Put Spread Option Strategy
To identify the most profitable vertical bull put spread options strategy for Ternium S.A. (TX), we should focus on minimizing the risk of having shares assigned while targeting a stock price movement of 2% over or under the current stock price. This brings us to strategies that effectively balance the premium received with the optimal "Greeks" to monitor the price sensitivity, time decay, and volatility.
Near-Term Strategy: Expiry on 2024-07-19
Choice 1: Short Put at $30, Long Put at $45
- Short Put Details:
- Strike Price: $30
- Delta: -0.0456
- Gamma: 0.0186
- Vega: 0.8195
- Theta: -0.0132
- Premium: $0.10
- Profit: $0.10
- Long Put Details:
- Strike Price: $45
- Delta: -0.7993
- Gamma: 0.0381
- Vega: 2.3660
- Theta: -0.0554
- Premium: $2.25
- Profit: $4.449
Risk/Reward Analysis: The maximum gain for selling the put at $30 is the premium of $0.10. By buying the put at $45, we limit our upside risk and have a net premium of $2.25. This combination minimizes the probability of the stock being in the money at expiration. Relative to delta, this is a low-risk, low-reward setup.
Moderate-Term Strategy: Expiry on 2024-08-16
Choice 2: Short Put at $35, Long Put at $50
- Short Put Details:
- Strike Price: $35
- Delta: -0.2628
- Gamma: 0.0761
- Vega: 4.3701
- Theta: -0.0158
- Premium: $0.65
- Profit: $0.65
- Long Put Details:
- Strike Price: $50
- Delta: -0.9887
- Gamma: N/A
- Vega: N/A
- Theta: -0.0030
- Premium: $11.6
- Profit: $0.099
Risk/Reward Analysis: This strategy offers a higher premium of $0.65 with a significant delta reduction. Buying the put option at $50 limits the downside, however, with the premium made for selling, it counterbalances the lower-profit aspect of buying the put at a higher price. This results in a somewhat balanced risk-reward approach.
Intermediate-Term Strategy: Expiry on 2024-08-16
Choice 3: Short Put at $40, Long Put at $60
- Short Put Details:
- Strike Price: $40
- Delta: -0.7298
- Gamma: 0.0855
- Vega: 4.3372
- Theta: -0.0158
- Premium: $4.33
- Profit: $1.129
- Long Put Details:
- Strike Price: $60
- Delta: -0.9887
- Gamma: N/A
- Vega: N/A
- Theta: -0.0030
- Premium: $18.40
- Profit: $3.299
Risk/Reward Analysis: The short put at $40 generates a significant premium and better profit margins. The long put at $60 though expensive, provides comprehensive downside protection. The delta values indicate considerable market sensitivity, which will work in favor of potential upward movement in the stock within the specified margin. This is a higher-risk, higher-reward setup.
Long-Term Strategy: Expiry on 2024-11-15
Choice 4: Short Put at $35, Long Put at $55
- Short Put Details:
- Strike Price: $35
- Delta: -0.3424
- Gamma: 0.0499
- Vega: 8.3060
- Theta: -0.0107
- Premium: $2.00
- Profit: $2.00
- Long Put Details:
- Strike Price: $55
- Delta: -0.9673
- Gamma: N/A
- Vega: N/A
- Theta: -0.0023
- Premium: $15.80
- Profit: $0.899
Risk/Reward Analysis: This strategy features a reduced delta risk with substantial control over potential market fluctuations due to higher gamma. The premium of $2.00 for the short put makes it profitable if the market remains bullish as projected. The risk is somewhat mitigated due to the distance between strike prices, ensuring some room for price movement without exercising the options.
Extended Long-Term Strategy: Expiry on 2025-02-21
Choice 5: Short Put at $35, Long Put at $60
- Short Put Details:
- Strike Price: $35
- Delta: -0.3624
- Gamma: 0.0419
- Vega: 10.8923
- Theta: -0.0079
- Premium: $2.03
- Profit: $2.03
- Long Put Details:
- Strike Price: $60
- Delta: -0.9887
- Gamma: N/A
- Vega: N/A
- Theta: -0.0030
- Premium: $18.40
- Profit: $3.299
Risk/Reward Analysis: Offering a lengthier expiry, this strategy provides a stable premium with a delta and theta indicating significant insensitivity to moderate price dips. The high gamma and vega reflect substantial volatility protection, thus, apt for more volatile markets if the target stock price remains within the expected 2% range.
In conclusion, evaluating the options systematically from near-term to extended long-term, it is evident that combining short puts with strategic long puts mitigates high-risk scenarios effectively and maximizes return potential, aligning with market expectations and projected price movements.
Vertical Bear Call Spread Option Strategy
In constructing a vertical bear call spread strategy for Ternium S.A. (TX), it's crucial to analyze both the short and long call options while considering the associated Greeks. This strategy involves selling a call option with a lower strike price and buying a call option with a higher strike price. The aim is to profit from the stock price either dropping or staying below a certain level at expiration, while minimizing the risk of assignment.
Short-Term Strategy (Expiration: 2024-07-19)
- Short Call Strike 35.0 / Long Call Strike 40.0
- The short call at strike 35.0 features a delta of 0.7857, indicating a higher probability of expiring in-the-money, which carries significant assignment risk. The premium is 2.75.
- The long call at strike 40.0 has a relatively lower delta of 0.1624, suggesting a lower likelihood of ending in-the-money, minimizing assignment risk. The premium is 0.20.
- Profit Potential: The maximum profit is the net premium received, approximately 2.55 (2.75 - 0.20), whereas the maximum loss occurs if the stock price exceeds the lower strike price, resulting in a loss of 4.45 (difference between strikes, 5, minus net premium, 2.55).
- Risk/Reward: The trade-off here is a higher potential reward against significant assignment risk due to the high delta of the short call.
Near to Medium-Term Strategy (Expiration: 2024-08-16)
- Short Call Strike 40.0 / Long Call Strike 45.0
- The short call at strike 40.0 has a delta of 0.2912, providing a middle-ground between profitability and assignment risk. The premium is 0.78.
- The long call at strike 45.0 has a delta of 0.0651, effectively hedging the position while reducing assignment risk. The premium is 0.12.
- Profit Potential: The maximum profit stands at 0.66 (0.78 - 0.12), with a maximum loss of 4.34 (difference between strikes, 5, minus net premium, 0.66).
- Risk/Reward: This choice balances a reasonable return while keeping assignment risk relatively low due to the moderate delta of the short call.
Longer-Term Strategy (Expiration: 2024-11-15)
- Short Call Strike 40.0 / Long Call Strike 45.0
- The short call at strike 40.0 is characterized by a delta of 0.3671, suggesting a balanced probability of expiring in-the-money. The premium is 1.85.
- The long call at strike 45.0 has a delta of 0.1700, providing solid hedging though with minimal assignment risk. The premium is 0.50.
- Profit Potential: The maximum profit is 1.35 (1.85 - 0.50), with the maximum loss being 3.65 (difference between strikes, 5, minus net premium, 1.35).
- Risk/Reward: This option offers a higher profit potential with reasonable assignment risk due to the moderate delta of the short call.
Longer-Term Strategy (Expiration: 2025-02-21)
- Short Call Strike 40.0 / Long Call Strike 45.0
- The short call at strike 40.0 comes with a delta of 0.3732, which maintains a moderate chance of assignment. The premium is 2.28.
- The long call at strike 45.0 has a delta of 0.2039, again providing ample coverage against drastic movements but with minimal assignment risk. The premium is 1.00.
- Profit Potential: The maximum profit sums to 1.28 (2.28 - 1.00), with a maximum potential loss of 3.72 (difference between strikes, 5, minus net premium, 1.28).
- Risk/Reward: This choice offers a reasonable profit with a careful balance of assignment risk due to the moderate delta values.
Longer-Dated Strategy (Expiration: 2024-11-15)
- Short Call Strike 45.0 / Long Call Strike 50.0
- The short call at strike 45.0 presents a delta of 0.1700, which reduces the probability of assignment. The premium is 0.50.
- The long call at strike 50.0 has a delta of 0.0838, effectively hedging the position with minimal assignment risk. The premium is 0.40.
- Profit Potential: The maximum profit is 0.10 (0.50 - 0.40), whereas the maximum risk stands at 4.90 (difference between strikes, 5, minus net premium, 0.10).
- Risk/Reward: This strategy offers a lower profit margin but significantly minimizes assignment risk due to the low deltas.
In summary, for a vertical bear call spread strategy on Ternium S.A., one should consider the balance between potential profit and assignment risk. Short-term strategies (like the first option) provide higher immediate profits but come with higher assignment risks due to higher delta values. Near-term strategies (like the second and third options) strike a balance between return and risk, making them appealing for moderate risk appetites. Longer-term strategies (like the fourth and fifth) minimize assignment risk while offering steady returns, suitable for conservative investors.
Vertical Bull Call Spread Option Strategy
A vertical bull call spread involves buying a call option with a lower strike price and selling a call option with a higher strike price, both having the same expiration date. This strategy is bullish and aims to capitalize on a moderate rise in the stock price while limiting potential losses. For Ternium S.A. (TX), to design the most profitable vertical bull call spread strategy, we need to consider factors like premiums, "the Greeks", and the need to minimize the risk of share assignment.
Near-Term Strategy (Expiring on 2024-07-19):
- Buy 35.0 Call and Sell 40.0 Call:
- Buying the 35.0 strike call option which has a delta of 0.7857 suggests high sensitivity to price changes, meaning its price will increase significantly if the stock price rises. It has a premium of $2.75, offering a substantial delta-gamma combination indicating it will respond robustly to the stock movement.
- Selling the 40.0 strike call option, with a delta of 0.1624 and a gamma of 0.1011, provides a premium of $0.20. The ROI is 100%, indicating high potential profit, but also a small premium collected implying less income from the potential downside.
Near-Term Strategy (Expiring on 2024-08-16):
- Buy 35.0 Call and Sell 40.0 Call:
- The 35.0 strike call option has strong deltas and a suitable gamma for balanced sensitivity, with a premium of $3.10.
- Selling the 40.0 strike call option with a delta of 0.2912 and a premium of $0.78 offers higher premium income reducing entry cost with a high ROI of 100%.
Medium-Term Strategy (Expiring on 2024-11-15):
- Buy 35.0 Call and Sell 40.0 Call:
- The 35.0 strike call option, with a delta of 0.6148, has a premium of $4.18, providing moderate exposure. Its higher gamma (0.0417) is beneficial for more pronounced price sensitivity.
- The 40.0 strike call option, with a delta of 0.3672 and a premium of $1.85, ensures a high ROI of 100% offering a balanced risk-reward ratio for the medium term.
Long-Term Strategy (Expiring on 2025-02-21):
- Buy 35.0 Call and Sell 40.0 Call:
- The 35.0 strike call (delta 0.5801) has a premium of $4.35, indicating less immediate price sensitivity as it slightly reduces risk compared to the near-term options.
- The 40.0 strike call option (delta 0.3732) provides a premium of $2.28, promising an ROI of 100%. This combination strikes good balance in long-term strategies, offering high potential returns with controlled risks.
Longest-Term Strategy (Expiring on 2025-02-21):
- Buy 35.0 Call and Sell 45.0 Call:
- Buying the 35.0 call option (delta 0.5801) at a premium of $4.35 and selling the 45.0 call option (delta 0.2039) at $1.00 premium provides a more significant spread for a high ROI of 100%. This structure mitigates assignment risks while capturing substantial upside potential.
Risk and Reward Analysis:
For each of these strategies, the cost of entering the trades (net premium cost) and the maximum profit must be analyzed. For instance:
- Buying the 35.0 call (2024-07-19) at $2.75 and selling the 40.0 call at $0.20 gives a net cost of $2.55. The maximum potential profit is $5 (spread difference) - $2.55 = $2.45.
- For strategies involving 35.0 and 40.0 calls expiring on 2024-08-16, the net cost approximation at $2.32, with profit potential up to $2.68.
- Moving to longer terms, strategies such as the one expiring on 2025-02-21 with the 35.0 and 40.0 calls would give a net cost at around $2.07 with potential profit nearing $2.93.
Overall, while balancing the costs, premiums collected, and sensitivity to stock price (delta), these strategies can optimize profitability and risk management across different time frames. The risks 'in the money' exposure and assignment are relatively lower, especially for near but moderate-out-of-the-money sold calls, ensuring that price hits wouldn't force assignments prematurely.
Spread Option Strategy
When evaluating a calendar spread options strategy for Ternium S.A., a crucial consideration is balancing the risk and reward by examining the Greeks, specifically focusing on minimizing the risk of shares being assigned while achieving profitable scenarios. Below are five carefully selected options combinations to explore different expiration dates and strike prices, quantified in terms of risk and reward.
1. Near-term Strategy:
Buy: Call Option (35.0 Strike, Expiring 2024-07-19)
- Delta: 0.7857
- Gamma: 0.0855
- Vega: 2.4624
- Theta: -0.0215
- Premium: 2.75
Sell: Put Option (30.0 Strike, Expiring 2024-07-19)
- Delta: -0.0456
- Gamma: 0.0186
- Vega: 0.8195
- Theta: -0.0132
- Premium: 0.1
This strategy involves buying a call option with high delta, indicating it will benefit significantly from an increase in the stock price (target price is 2% over the current price). Selling a put option with a low delta of -0.0456 minimizes the risk of assignment, given that it is significantly out of the money. The net cost of this strategy is reduced to $2.65, providing a manageable upfront investment.
2. Medium-term Strategy:
Buy: Call Option (35.0 Strike, Expiring 2024-08-16)
- Delta: 0.6935
- Gamma: 0.0648
- Vega: 4.6222
- Theta: -0.0158
- Premium: 3.1
Sell: Put Option (30.0 Strike, Expiring 2024-08-16)
- Delta: -0.0806
- Gamma: 0.0238
- Vega: 2.0094
- Theta: -0.0103
- Premium: 0.28
This combination provides a balanced delta exposure (call delta 0.6935 vs put delta -0.0806). The call option's moderate delta ensures considerable gains if the stock moves 2% higher than the current price. The put option, with its low delta, reduces the likelihood of share assignment, while the month's gap between expiration dates further minimizes immediate assignment risk. The total premium paid amounts to $2.82, representing a modest investment for a medium-term strategy.
3. Optimized Reward Strategy:
Buy: Call Option (35.0 Strike, Expiring 2024-08-16)
- Delta: 0.6935
- Gamma: 0.0648
- Vega: 4.6222
- Theta: -0.0158
- Premium: 3.1
Sell: Put Option (35.0 Strike, Expiring 2024-08-16)
- Delta: -0.2628
- Gamma: 0.0761
- Vega: 4.3701
- Theta: -0.0158
- Premium: 0.65
Here, both options share the same strike price, and the put option has a significantly higher delta (absolute value). This choice may seem riskier due to the chance of assignment, but the higher premium collected ($0.65) offsets some of the call's cost, reducing the net investment to $2.45. This strategy leverages higher vega exposure, potentially maximizing gains from volatility.
4. Long-term Strategy:
Buy: Call Option (35.0 Strike, Expiring 2024-08-16)
- Delta: 0.6935
- Gamma: 0.0648
- Vega: 4.6222
- Theta: -0.0158
- Premium: 3.1
Sell: Put Option (30.0 Strike, Expiring 2024-11-15)
- Delta: -0.1461
- Gamma: 0.0267
- Vega: 5.2308
- Theta: -0.0075
- Premium: 0.6
This combination extends the short position to a later expiration, significantly reducing the short-term risk of assignment. The call and put positions offer a favorable vega for potential future volatility benefits. The net cost here is $2.50, which balances the risk of longer-term market movements favoring your position.
5. Extended Strategy:
Buy: Call Option (35.0 Strike, Expiring 2024-08-16)
- Delta: 0.6935
- Gamma: 0.0648
- Vega: 4.6222
- Theta: -0.0158
- Premium: 3.1
Sell: Put Option (35.0 Strike, Expiring 2025-02-21)
- Delta: -0.3624
- Gamma: 0.0419
- Vega: 10.8923
- Theta: -0.0079
- Premium: 2.03
This longer-duration pairing has a higher delta for the put option, increasing the risk of assignment but providing substantial premium income. The net cost of this strategy reduces to $1.07, allowing for significant profit if the stock price moves in the favorable direction. The premium collected $2.03 hedges against the upfront investment of the call option substantially.
Conclusion:
The most balanced and profitable strategy considering the target stock price within 2% of the current price and risk minimization might be the Optimized Reward Strategy. This strategy buys a 35-strike call expiring on 2024-08-16 and sells a 35-strike put expiring on the same date. While this carries more risk of assignment, it also maximizes potential returns, making it a robust choice based on current parameter values.
Calendar Spread Option Strategy #1
When executing a calendar spread strategy using Ternium S.A. (TX) options, one must carefully navigate the interplay between different expiration dates and strike prices. The objective is to profit from changes in volatility and the passage of time while minimizing the risk of assignment, which occurs when options are in the money. As such, careful analysis of the Greeks, as well as potential profit and loss scenarios, is crucial. Here are five options strategies ranging from near-term to long-term that consider profitability and risk mitigation.
Near-Term Option Strategy
-
Buying a Put Option - July 19, 2024, Strike: $45 | Selling a Call Option - July 19, 2024, Strike: $35
-
Put Option:
- Delta: -0.7993, Gamma: 0.0381, Theta: -0.0554, Vega: 2.3660, Premium: $2.25
-
Profit: $4.449, ROI: 197.73%
-
Call Option:
- Delta: 0.7857, Gamma: 0.0855, Theta: -0.0215, Vega: 2.4624, Premium: $2.75
- Profit: $0.951, ROI: 34.58%
This strategy allows for substantial potential profits due to the high ROI on both the put and call options. However, the risk of assignment is significant since both the options are relatively close to being in-the-money.
Short to Mid-Term Strategy
-
Buying a Put Option - November 15, 2024, Strike: $55 | Selling a Call Option - November 15, 2024, Strike: $35
-
Put Option:
- Delta: -0.9673, Gamma: 0.0, Theta: -0.0023, Vega: 0.0, Premium: $15.8
-
Profit: $0.899, ROI: 5.69%
-
Call Option:
- Delta: 0.6148, Gamma: 0.0417, Theta: -0.0081, Vega: 8.3904, Premium: $4.18
- Profit: $2.381, ROI: 56.96%
Choosing higher strike prices can minimize the risk of early assignment of shares while ensuring adequate premiums. The put option has a relatively low theta, therefore less time decay risk, and the call option is slightly out-of-the-money, minimizing assignment risk.
Mid-Term Strategy
-
Buying a Put Option - August 16, 2024, Strike: $50 | Selling a Call Option - August 16, 2024, Strike: $40
-
Put Option:
- Delta: -0.9887, Gamma: 0.0, Theta: -0.0030, Vega: 0.0, Premium: $11.6
-
Profit: $0.099, ROI: 0.85%
-
Call Option:
- Delta: 0.2912, Gamma: 0.0787, Theta: -0.0142, Vega: 4.5934, Premium: $0.78
- Profit: $0.78, ROI: 100%
The risk of assignment here is lower because the call option is relatively far out-of-the-money, and the stock price would have to move significantly to achieve in-the-money status.
Long-Term Strategy
-
Buying a Put Option - November 15, 2024, Strike: $60 | Selling a Call Option - February 21, 2025, Strike: $35
-
Put Option:
- Delta: -0.9887, Gamma: 0.0, Theta: -0.0018, Vega: 0.0, Premium: $18.4
-
Profit: $3.299, ROI: 17.93%
-
Call Option:
- Delta: 0.5800, Gamma: 0.0368, Theta: -0.0043, Vega: 10.9124, Premium: $4.35
- Profit: $2.551, ROI: 58.64%
The long tenor of these options allows ample time for the market to hit the target price, and both options have moderate gamma risks, suggesting reasonable stability.
Very Long-Term Strategy
-
Buying a Put Option - November 15, 2024, Strike: $60 | Selling a Call Option - February 21, 2025, Strike: $45
-
Put Option:
- Delta: -0.9887, Gamma: 0.0, Theta: -0.0018, Vega: 0.0, Premium: $18.4
-
Profit: $3.299, ROI: 17.93%
-
Call Option:
- Delta: 0.2039, Gamma: 0.0317, Theta: -0.0041, Vega: 8.3551, Premium: $1.0
- Profit: $1.0, ROI: 100%
Selling a call option with a higher strike price and longer expiration date helps reduce the likelihood of assignment. While the premiums may be lower, the strategy offers a balance between profit potential and assignment risk.
By choosing a mix of near-term and longer-term spreads, you enhance the potential for profit derived from the differing impacts of theta, gamma, vega, and rho over various time frames. Adjusting the strike prices also helps manage the risk of the options being in the money, which directly influences the likelihood of share assignment.
Calendar Spread Option Strategy #2
In crafting a calendar spread strategy for Ternium S.A. (TX), we must first identify the best pairings of options based on their expiration dates, strike prices, and Greek values. The objective is to create a strategy that minimizes the risk of having shares assigned while maximizing profitability. The following analysis considers the Greeks and other relevant factors for each option.
Choice 1: Near Term (2024-07-19 and 2024-08-16)
- Sell Put Option (45.0, July 19, 2024):
- Delta: -0.7993 suggests a high probability of ITM.
- Theta: -0.0554 indicates a theta decay which impacts profit.
- Premium: $2.25.
- Profit: $4.449.
-
ROI: 1.9773.
-
Buy Call Option (60.0, August 16, 2024):
- Delta: 0.0365 implies lower risk of assignment.
- Theta: -0.0077, moderate time decay.
- Premium: $0.05.
- Profit: $0.05.
- ROI: 100%.
This combination takes advantage of near-term premiums while keeping the longer-term strike above the current price, thus minimizing early assignment risk. Potential maximum loss includes the cost differences if the put option moves deeper ITM.
Choice 2: Near to Mid Term (2024-08-16 and 2024-11-15)
- Sell Put Option (50.0, August 16, 2024):
- Delta: -0.9887, very high probability of ITM.
- Theta: -0.0030, slow decay.
- Premium: $11.6.
- Profit: $0.099.
-
ROI: 0.0085.
-
Buy Call Option (45.0, November 15, 2024):
- Delta: 0.1700, moderate risk of assignment.
- Premium: $0.50.
- Profit: $0.50.
- ROI: 100%.
A balanced approach with medium-range call options gives a safer delta compared to shorter calls. However, the high delta of the put option indicates a high risk of ITM scenarios.
Choice 3: Mid Term (2024-08-16 and 2025-02-21)
- Sell Put Option (55.0, August 16, 2024):
- Delta: -0.9673, high probability of ITM.
- Theta: -0.0023.
- Premium: $15.8.
- Profit: $0.899.
-
ROI: 0.0569.
-
Buy Call Option (35.0, February 21, 2025):
- Delta: 0.5801.
- Premium: $4.35.
- Profit: $2.551.
- ROI: 58.6437.
A higher strike price in the put option reduces early assignment risks, while the mid-term call gives a balance between premium and the risk profile.
Choice 4: Short to Long Term (2024-07-19 and 2025-02-21)
- Sell Put Option (45.0, July 19, 2024):
- Delta: -0.7993.
- Theta: -0.0554.
- Premium: $2.25.
- Profit: $4.449.
-
ROI: 1.9773.
-
Buy Call Option (35.0, February 21, 2025):
- Delta: 0.5801.
- Premium: $4.35.
- Profit: $2.551.
- ROI: 58.6437.
This pairing aims to leverage short-term premiums in the put option with relatively safe call options farther out, balancing risk and reward effectively.
Choice 5: Longer Term (2024-11-15 and 2025-02-21)
- Sell Put Option (55.0, November 15, 2024):
- Delta: -0.9673.
- Theta: -0.0023.
- Premium: $15.8.
- Profit: $0.899.
-
ROI: 0.0569.
-
Buy Call Option (45.0, February 21, 2025):
- Delta: 0.2039.
- Premium: $1.0.
- Profit: $1.0.
- ROI: 100%.
This combination takes advantage of longer-term options, offering a substantial probability of a profitable reward while keeping ITM risks in check through effective delta management.
In summary, the most profitable calendar spread strategy needs careful synchronization of expiration dates and strike prices to balance delta, minimize assignment risk, and maximize ROI. The careful selection between near-term and mid-term options, considering the intrinsic values and Greek profiles, ensures both risk protection and profitability.
Similar Companies in Steel:
POSCO Holdings Inc. (PKX), Report: Steel Dynamics, Inc. (STLD), Steel Dynamics, Inc. (STLD), Report: Gerdau S.A. (GGB), Gerdau S.A. (GGB), Report: Nucor Corporation (NUE), Nucor Corporation (NUE), Companhia Siderurgica Nacional (SID), Report: ArcelorMittal S.A. (MT), ArcelorMittal S.A. (MT), Report: Commercial Metals Company (CMC), Commercial Metals Company (CMC), Report: Olympic Steel, Inc. (ZEUS), Olympic Steel, Inc. (ZEUS), Report: Universal Stainless & Alloy Products, Inc. (USAP), Universal Stainless & Alloy Products, Inc. (USAP), Report: Outokumpu Oyj (OUTKY), Outokumpu Oyj (OUTKY), Usinas Siderurgicas de Minas Gerais S.A. (USNZY), Report: United States Steel Corporation (X), United States Steel Corporation (X), Report: Cleveland-Cliffs Inc. (CLF), Cleveland-Cliffs Inc. (CLF)
https://finance.yahoo.com/news/3-steel-producer-stocks-escape-120300627.html
https://finance.yahoo.com/news/zacks-industry-outlook-highlights-steel-103700443.html
https://finance.yahoo.com/news/jpmorgan-adjusts-price-target-ternium-134128163.html
https://finance.yahoo.com/news/morgan-stanleys-top-blue-chip-140528799.html
https://finance.yahoo.com/news/five-decline-earnings-might-taking-121416120.html
https://finance.yahoo.com/news/steel-dynamics-stld-soars-4-083400203.html
https://finance.yahoo.com/news/brazilian-court-orders-ternium-pay-152000372.html
https://seekingalpha.com/article/4700345-70-all-star-and-graham-value-stocks-57-fit-to-buy-in-june
Copyright © 2024 Tiny Computers (email@tinycomputers.io)
Report ID: Tk1FnU
Cost: $0.38550