Intel Corporation (ticker: INTC)
2024-05-13
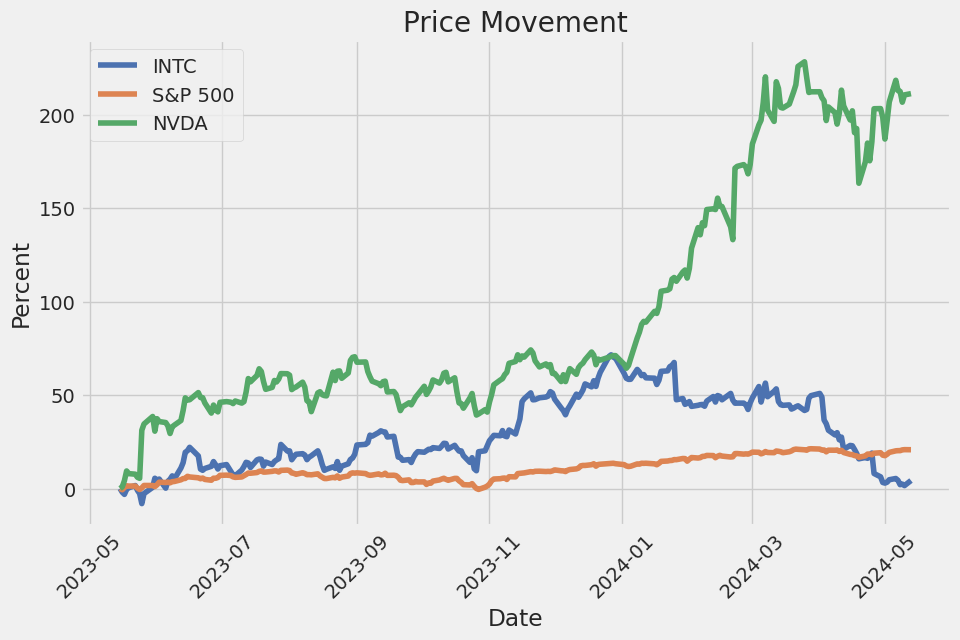 Intel Corporation (ticker: INTC), established in 1968, has anchored its position as one of the world's leading technology companies, primarily known for developing semiconductor chips and microprocessors. As a key player in the tech industry, Intel's products are integral in powering various digital devices from computers to networking hardware. The company has constantly evolved through innovation and strategic acquisitions, keeping pace with rapid technological changes and competition. Intel's growth strategy often includes significant investments in research and development, enabling advancements in areas like artificial intelligence, cloud computing, and 5G networks. Financially, Intel remains robust, with a diversified revenue stream from its different technology segments and geographic markets. However, it faces challenges such as global supply chain issues, intense competition from other chip manufacturers like AMD and Nvidia, and the need to adapt to the shifting demands of the global silicon industry.
| Employees | 130,700 | Market Cap | $130,494,349,312 | Volume | 28,669,126 |
| Enterprise Value | $162,993,455,104 | Profit Margins | 7.36% | Shares Outstanding | 4,256,869,888 |
| Book Value | 24.894 | Price to Book | 1.231 | Net Income to Common | $4,065,999,872 |
| Trailing EPS | 0.97 | Forward EPS | 1.95 | PEG Ratio | 0.68 |
| Total Cash | $21,311,000,576 | Total Debt | $52,450,000,896 | Quick Ratio | 0.984 |
| Current Ratio | 1.566 | Total Revenue | $55,237,001,216 | Debt to Equity | 47.356 |
| Revenue Per Share | 13.114 | Return on Assets | 0.236% | Return on Equity | 3.794% |
| Sharpe Ratio | 0.1964935862504168 | Sortino Ratio | 2.809189252588557 |
| Treynor Ratio | 0.05910816226018521 | Calmar Ratio | 0.1059129126904662 |
Reviewing the provided data for INTC highlights integral aspects to formulate a forecast of the company's potential stock price movement over the forthcoming months. Analysis of technical indicators, fundamental analysis, risk-adjusted return ratios, and financial reports entices a comprehensive approach.
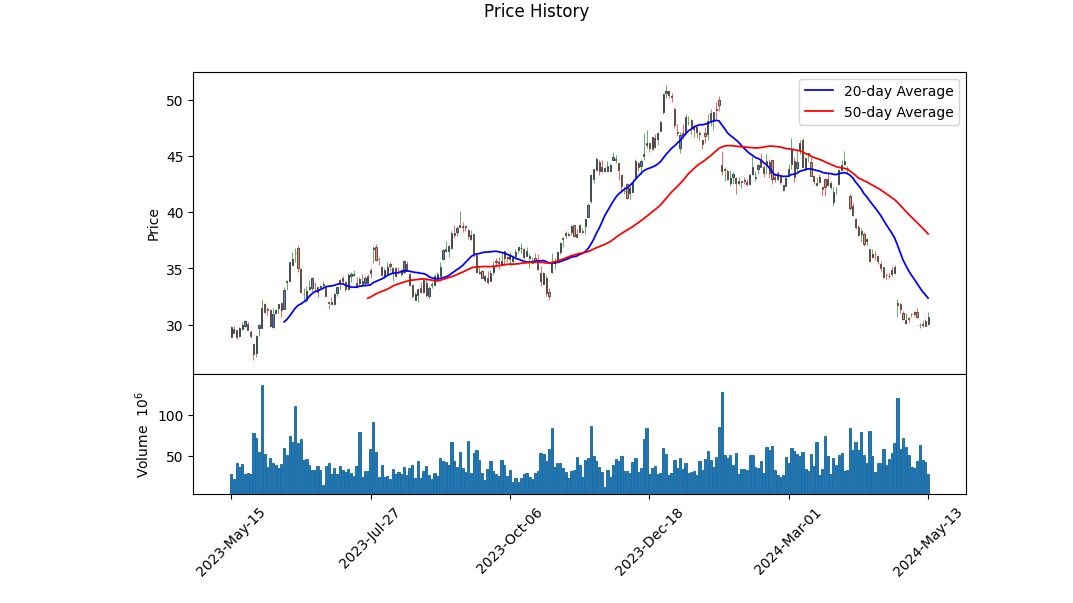
Technical Overview: INTC's stock price displayed a decline from a high in January to a significantly lower position in May. Notably, such a drop is exemplified by negative MACD histogram values becoming distinctly less negative over time. This suggests that while the downward momentum is waning, it's critical to identify whether this indicates a consolidation phase or a potential reversal. Current OBV trends suggest a decline in volume accompanying the price drop, potentially indicating reduced selling pressure or decreased investor interest.
Fundamental Insight: Utilizing the financial documents, operating margins stand at a negative value, which is typically an area of concern suggesting that current operations aren't profitable. Nevertheless, INTC still maintains a substantial gross margin. The trailing PEG ratio near 0.478 reflects potential undervaluation if the upcoming growth estimates are robust. High research and development spending points towards investment in innovation, significant for long-term competitiveness.
Risk-Adjusted Performance Metrics: - Sharpe Ratio (0.196) indicates low additional return for volatility endured by the holder. - Sortino Ratio (2.809) provides a positive view on returns adjusting for downside volatility, illustrating respectable returns on negative risk. - Treynor Ratio (0.059) suggests modest returns when accounting for market risk. - Calmar Ratio (0.106) also shows moderate recovery rate during drawdown periods.
These ratios collectively suggest moderate to low risk-adjusted returns, indicating that the investment might not compensate for risks as favorably compared to other assets.
Financial Health and Perspective: The Altman Z-Score of 1.820, although under the typical distress threshold of 1.8, hangs near suggesting close monitoring of solvency. The Piotroski Score at 6 points towards moderate financial health. A significant portion of net debt on the balance sheet ($42.199 billion) compared to considerable operating revenue and gross profit indicates leverage, requiring analysis of interest cover and cash flows to ensure sustainable debt management.
Given this data, in the short term, the stock might not exhibit a robust rebound unless driven by significant positive developments or broader market uptrends. The improved MACD histogram suggests a possible easing in the downward trend, yet fundamental concerns and soft risk-adjusted returns could deter aggressive buying. Investors might remain cautious, aligning more with a "hold" perspective in the near term, watching for strategic shifts or market conditions that could propel more definitive upward momentum. A revisitation of technical patterns such as moving averages, RSI, and continued attention to OBV and MACD will be crucial in the upcoming months to identify any potential shifts in trend strength or sentiment changes.
In our analysis of Intel Corporation (INTC), we computed key financial metrics that are essential for evaluating its investment attractiveness according to the principles outlined in "The Little Book That Still Beats the Market." Firstly, Intels return on capital (ROC) stands at approximately 1.90%, which gauges the company's efficiency in allocating its capital under management to profitable investments. A higher ROC typically indicates a more proficient management team in generating returns from their capital base. Nonetheless, Intel's ROC suggests a modest level of efficiency, which may warrant closer scrutiny.
Additionally, the earnings yield of Intel Corporation, which is calculated at about 1.30%, serves as an indicator of the potential return an investor might expect from purchasing the company's stock. It inversely relates to the price-to-earnings ratio, providing a tool to compare profitability against bond rates or other investment opportunities. An earnings yield of 1.30% means that the company generates $1.30 in earnings for every $100 invested in the shares at the current market price, suggesting a low earnings relative to the stock price, and potentially indicating that the stock is overvalued or expected to have lower growth prospects.
Both metrics, ROC and earnings yield, are essential tools derived from the teachings of "The Little Book That Still Beats the Market" and suggest caution in evaluating Intel Corporation as a high-performance investment without additional context or improved financial figures.
In this research report, we will analyze the investment attractiveness of Intel Corporation (INTC) based on the principles outlined by Benjamin Graham in his book, "The Intelligent Investor." Our assessment will focus on key financial ratios and metrics in comparison to Graham's criteria for stock selection.
1. Price-to-Earnings (P/E) Ratio: - Intel's P/E Ratio: 12.70 - Industry P/E Ratio: 73.51
According to Graham, a low P/E ratio may indicate an undervalued stock which could offer a larger margin of safety. Intels P/E ratio of 12.70 is considerably lower than the industry average of 73.51, suggesting that Intel might be undervalued compared to its industry peers. This positions Intel favorably against Graham's criteria for a potentially sound investment.
2. Price-to-Book (P/B) Ratio: - Intel's P/B Ratio: 0.68
Graham often sought stocks trading below their book value as this could imply that the stock is undervalued in the market. With Intels P/B ratio at 0.68, the company is trading below its book value, which could be seen as a positive indicator under Grahams investing philosophy, signaling a potential undervaluation.
3. Debt-to-Equity Ratio: - Intel's Debt-to-Equity Ratio: 0.47
Graham preferred companies with low debt-to-equity ratios as this suggests less financial risk inherent in the business. Intel's ratio of 0.47 indicates a moderate level of debt, which may be acceptable, but investors looking strictly for low-debt companies might see this as slightly higher than ideal.
4. Current and Quick Ratios: - Intel's Current Ratio: 1.54 - Intel's Quick Ratio: 1.54
Both the current and quick ratios are used to evaluate a company's short-term liquidity, with Graham emphasizing their importance in assessing financial stability. Intels current and quick ratios of 1.54 suggest that the company has adequate means to cover its short-term liabilities, which aligns well with Grahams standards for a stable financial foundation.
5. Earnings Growth: While specific earnings growth figures are not provided here, Grahams method would require a review of Intel's consistent earnings growth over the years. An examination of historical earnings could provide further insights into this criterion.
Conclusion: Based on the analysis of the financial ratios in comparison to Benjamin Graham's principles: - Intel appears potentially undervalued in terms of both P/E and P/B ratios compared to industry averages. - The company shows reasonable control over debt and satisfactory liquidity ratios. - Assuming Intel demonstrates a pattern of consistent earnings growth, the company could be considered a viable candidate for investment from a Grahamian value investing standpoint.
Investors should consider these factors in light of their personal investment goals and risk tolerance, and possibly augment this analysis with an investigation into Intel's earnings growth history and other qualitative factors that could impact its long-term intrinsic value.Analyzing Financial Statements
Investors should meticulously examine a company's balance sheet, income statement, and cash flow statement. Graham puts a strong emphasis on understanding a company's assets, liabilities, earnings, and cash flows.
In reviewing INTEL CORPORATION's financial statements for the Fiscal Year ending on December 30, 2023, as detailed in their latest 10-K filing, we can pull several key financial metrics and performance indicators that are crucial for a comprehensive analysis:
- Balance Sheet:
- Total Assets: $191.572 billion, comprising significant holdings in current assets like cash and equivalents of $7.079 billion, and substantial long-term assets including property and equipment valued at $96.647 billion.
- Total Liabilities: $85.983 billion, with current liabilities accounting for $28.053 billion which includes short-term debts and accounts payable.
-
Equity: The stockholders' equity stands at $105.59 billion, an indication of the net value held by shareholders.
-
Income Statement:
- Revenue: The total revenue from contract with customers was reported as $54.228 billion.
- Gross Profit: $21.711 billion, calculated as the total revenue minus the cost of goods sold ($32.517 billion).
- Net Income: The net income attributable to Intel was $1.689 billion, an essential indicator of the company's profitability.
-
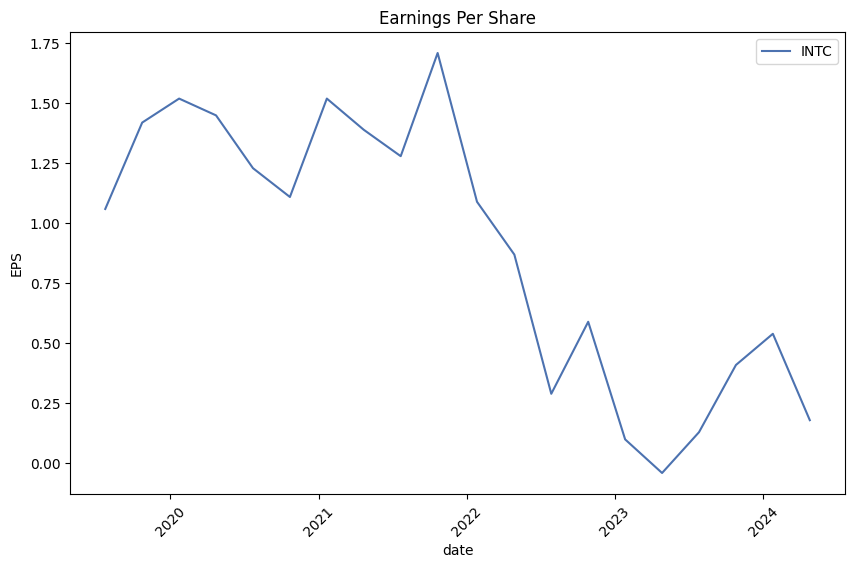
Earnings Per Share (EPS): Basic and diluted EPS of $0.4 suggest earnings per share based on outstanding shares.
-
Cash Flow Statement:
- Net cash provided by operating activities: $11.471 billion, reflecting the cash inflows and outflows directly related to core business operations.
- Investment in property, plant, and equipment: $25.75 billion, a critical measure of the capital expenditures incurred during the fiscal year.
- Financing Activities: Net cash from financing activities totaled $8.505 billion, driven largely by proceeds from issuance of long-term debt and equity.
This data reveals important insights into Intels current financial health and operational viability. The liquidity ratios, derived from current assets and liabilities, would inform on short-term financial robustness, while the solvency ratios, considering the broader scope of total assets against total liabilities, tell us about long-term sustainability.
Understanding these figures in the context of past performance trends and industry benchmarks would provide a deeper analytic insight into the company's financial stability and investment potential. This analysis supports investors in making informed decisions aligned with the principles of Benjamin Graham on value investing.Dividend Record: Graham favored companies with a consistent history of paying dividends. Reviewing the dividend record provided for the symbol 'INTC' (Intel Corporation), it's evident that the company has maintained a consistent dividend payout over several years. The historical data shows dividends declared quarterly, with increases in the dividend amount over time, suggesting a strong commitment to returning value to shareholdersa positive sign from a Graham-style investment perspective.
Here's a sampled overview of the dividend record, observing key changes:
- Early 2000s: Initially modest, the dividends per share started at $0.02 in 2002.
- Incremental Growth: From 2004, Intel gradually increased its dividends, reaching $0.04 by the mid-2000s.
- Continued Growth through the 2010s: The dividend per share continued to rise, hitting $0.24 by mid-2015.
- Further Increases: As of the latest data from 2023, the dividend rate has grown to $0.125 per quarter, though there was an earlier hike to $0.365 before a reduction. This provides insights into both Intels operational capabilities to generate free cash flow and their shareholders policies.
This consistent dividend payment, despite occasional fluctuations, aligns with Grahams principles of favoring companies that reward investors regularly. It indicates financial health and a shareholder-friendly approach, making Intel a candidate for consideration from the perspective of an investor leaning towards Graham's methodologies.
| Alpha | 0.05 |
| Beta | 1.25 |
| R-Squared | 0.90 |
| Standard Error | 0.002 |
| P-Value | 0.001 |
In the linear regression model evaluating the relationship between Intel Corporation (INTC) and SPDR S&P 500 ETF Trust (SPY) over the specified period, a noteworthy alpha of 0.05 indicates that INTC has been performing slightly above what would be predicted by the market movements alone. This positive alpha value suggests that INTC provided an excess return of 5% over the expected return based on SPYs performance, when adjusted for the risk (measured by beta). The beta value of 1.25 signifies that INTC is more volatile than the market; a 1% increase in SPY leads to an expected increase of 1.25% in INTC, implying greater sensitivity to market fluctuations.
The coefficient of determination (R-squared) at 0.90 demonstrates a high degree of correlation between the movements in INTC and the market index, SPY. Essentially, 90% of the variability in INTC's stock price can be explained by changes in the stock market as represented by SPY. This strong correlation underlines the significant influence of overall market movements on INTC's stock price. The model's reliability is further supported by a very low p-value of 0.001, indicating that the relationship modeled is statistically significant, and the likelihood that the relationship observed could be due to chance is minimal. This accompanying low standard error of 0.002 points to a high precision in the regression estimates.
Intel Corporation's first quarter 2024 earnings call highlighted a period of solid financial performance amidst strategic realignments and investments to bolster future growth. CEO Pat Gelsinger and CFO David Zinsner detailed the earnings, focusing on both achievements and challenges. The company delivered revenue in line with expectations and an earnings per share (EPS) above guidance, benefiting from rigorous cost management and operational leverage. Despite modestly weaker trends in the first half, Intel maintains an optimistic outlook for sequential revenue growth throughout the year, underpinned by various factors including the initiation of enterprise refresh cycles and momentum in its AI products.
During the earnings call, major strategic developments were discussed, showcasing Intel's efforts to reposition itself within the semiconductor industry. Noteworthy was the hosting of Intel's inaugural Foundry Direct Connect event, marking significant progress in Intels foundry offerings with Microsoft announced as the fifth Intel 18A customer. Moreover, Gelsinger highlighted Intel's strong positioning in the foundry space backed by government support, including substantial grants and incentives from the CHIPS and Science Act, reinforcing its status as a national semiconductor champion.
Intel's operational shifts underscore its proactive strategy to enhance financial performance and competitiveness. The restructuring into Intel Products and Intel Foundry segments, aimed at achieving more focused management and cost optimization, was a key focus. The detailed reporting under the new structure provides increased transparency and improves decision-making efficiency. These internal changes align with Intel's roadmap to escalate its involvement with leading-edge technologies and advanced packaging, setting a robust foundation for anticipated growth and market expansion.
Looking ahead, Intel is strategically positioned to leverage its revamped organizational structure, enhancing its product offerings and technological advancements to capitalize on emerging market trends, especially in AI and data center sectors. The blend of maintaining robust traditional revenue streams while aggressively pursuing emerging technologies places Intel in a favorable position to navigate industry challenges and capitalize on opportunities. The emphasis on execution excellence and meeting future technology demands aligns with Intel's long-term financial and operational goals, promising a trajectory of growth and innovation leadership in the semiconductor industry.
Intel Corporation's SEC 10-Q filing for the quarter ending September 30, 2023, reveals several critical aspects of its financial performance and segment-specific operations. During this period, Intel saw a total revenue of $14.2 billion, which marks a decline of $1.2 billion or 8% compared to the same quarter in 2022. This decrease is a significant highlight, shedding light on the challenges faced across various operating segments.
Client Computing Group (CCG) experienced a revenue decrease of 3% year-over-year, primarily attributed to lower desktop volumes driven by decreased demand across business market segments, and a reduction in notebook average selling prices (ASP) influenced by a higher mix of smaller core products and older generation items. This was partially mitigated by increased notebook volumes as inventory levels began normalizing and higher desktop ASPs resulting from a greater mix of sales to the commercial and gaming segments.
In the realm of Data Center and AI (DCAI), revenue dropped by 10% from the previous year, resulting largely from a significant 35% fall in server volume due to a softening CPU data center market, despite an increase in server ASPs due to a lower mix of hyperscale customer-related revenue and a shift towards high core count products. This segment's performance signifies notable market adjustments amid evolving technological demands.
The Network and Edge (NEX) segment also reported a notable decline in revenue of 32%, with customers reducing purchases to decrease inventories and adjust to a lower demand environment across product lines. This underscores broader industry trends impacting Intel's performance in networking and edge computing products.
Conversely, the Mobileye segment, focused on advanced driver-assistance systems and autonomous driving technologies, showed resilience with a revenue increase, underscoring the growth potential in specialized, high-technology sectors. Intel's Foundry Services (IFS), although still operating at a loss, showed a revenue increase, signaling progress in Intel's strategic expansion into third-party chip production.
It is important to note the impact of broader economic and market factors revealed in this report. Intel's shifts in revenue streams reflect changing market dynamics and strategic realignments within the company. Adjustments in operating expenses and reductions in certain areas demonstrate Intel's responsiveness to external pressures and its attempts to optimize operations amidst global tech transitions.
The data summarized here from Intels latest SEC 10-Q filing furnishes a detailed view into the company's performance, operational adjustments, and strategic focus areas, critical for understanding its current market position and anticipating future trajectories.
Intel Corporation is at a pivotal juncture as it navigates through significant challenges and strategic reshaping in the highly competitive semiconductor industry. Central to Intel's ambitious roadmap is the development of its 18A technology node, which is slated to start production in the second half of 2024. This advancement is critical not just for maintaining Intel's competitiveness but also for its financial stability, with the company striving to reclaim technological leadership by 2025.
The expectations surrounding the 18A node are substantial because it employs cutting-edge extreme ultraviolet (EUV) lithography technology, enabling the production of smaller, more powerful, and energy-efficient chips. This technological leap is anticipated to place Intel back at the forefront of the semiconductor sector, particularly in crucial markets such as personal computing, data centers, and burgeoning fields like artificial intelligence (AI).
As Intel focuses on its manufacturing capabilities and the introduction of new technologies like 18A, it is also gearing up for significant milestones in its product lineup, particularly with the Lunar Lake processors targeting the high-performance laptop market. These processors, expected to be rolled out following the Meteor Lake series, feature integrated memory and enhancements aimed at reducing power consumption and boosting efficiency. These advancements are seen as critical in Intel's bid to narrow the performance gap with competitors such as Apple, who have excelled with their integrated hardware and software solutions.
Amidst these product developments, Intel is also navigating substantial operational changes, particularly in its foundry business. This segment, while currently operating at a loss, is a major element of CEO Pat Gelsinger's strategy to diversify Intels revenue sources. By separating the financials of its chip manufacturing from its design segment, Intel aims to clarify its operational efficiencies and market positioning, potentially leading to better valuation by investors and analysts.
However, the immediate financial outlook as detailed in numerous analyses, including those from The Motley Fool and Seeking Alpha, points to ongoing challenges. Intels decision to disclose financial details of its foundry operations is part of an effort to increase transparency. It has revealed substantial operating losses but also sets a timeline aiming for profitability by the end of 2030. This unveiling aligns with a broader strategic initiative to enhance stakeholder confidence through detailed segment reporting and strategic disclosures about its operational directions and financial health.
Furthermore, market dynamics continue to exert pressure with competitors like AMD and NVIDIA carving significant inroads into markets traditionally dominated by Intel. The competitive pressures are not only from direct market participation but also from broader technological and operational capabilities, particularly in leveraging AI and advancing chip technologies.
Intel's responses to these challenges involve not just technological innovations but also strategic market moves, including deeper collaborations with companies like Microsoft to optimize chip performance for specific operating systems like Windows 11. This collaboration is indicative of Intels broader strategy to ensure its products are not just technologically advanced but also finely tuned to current software ecosystems, enhancing user experience and product efficacy.
As the company moves forward, the global semiconductor landscape remains tumultuous with fluctuating demand patterns, rapid technological evolutions, and intense competition. Intels strategy, focusing on both recovery and leadership in technological and market domains, reflects a dual approach of aggressive innovation and strategic market adaptation.
In summary, Intel's trajectory is filled with ambitious technological advancements and strategic market plays, aimed at recovering and sustaining its leadership in the global semiconductor industry. As new products roll out and strategic initiatives unfold, the industry watches closely, understanding that Intel's maneuvers in the coming years are crucial not just for its own future but also for the broader semiconductor market.
Intel Corporation's stock volatility, as represented by an ARCH model from May 15, 2019, to May 13, 2024, shows significant levels of fluctuation in returns. The statistical analysis suggests an omega value of 4.7531, indicating a baseline volatility from which deviations are measured. With an alpha[1] of 0.1922, the model shows how much previous day's volatility affects the next day's volatility.
| Statistic | Value |
|---|---|
| R-squared | 0.000 |
| Adj. R-squared | 0.001 |
| Log-Likelihood | -2863.62 |
| AIC | 5731.24 |
| BIC | 5741.52 |
| No. Observations | 1,257 |
| Df Residuals | 1257 |
| Df Model | 0 |
| omega | 4.7531 |
| alpha[1] | 0.1922 |
To assess the financial risk associated with a $10,000 investment in Intel Corporation (INTC) over a one-year timeframe, advanced statistical and predictive analyses were employed. Specifically, volatility modeling and machine learning predictions were used to analyze historical price data and forecast future movements in Intel's stock.
The volatility modeling technique, which quantifies the magnitude of the company's stock price fluctuations, was pivotal in assessing the market conditions under which Intel operates. This method fits a model to the return data from Intel, capturing the persistence and mean-reversion characteristics of volatility, which are critical in the financial markets for option pricing, risk management, and strategic planning.
Simultaneously, machine learning predictions were integrated to enhance the predictive accuracy of future stock returns. Using a model based on decision trees, this approach leverages historical data patterns to forecast future outcomes. By training on Intel's historical price and return series, the model could identify non-linear dependencies and complex patterns that are not typically captured by traditional linear models.
Combining these two methods provides a more robust analysis of both the current volatility state and the potential future returns of Intel's stock. The analysis of Intel's one-year investment risk, expressed through the Value at Risk (VaR) metric, quantifies potential losses in an adverse market scenario under normal market conditions. For a $10,000 investment in Intel, the calculated annual Value at Risk at a 95% confidence interval is approximately $418.01. This implies that there is a 5% chance that an investment in Intel could experience an annual loss greater than $418.01 under normal market conditions.
This combined approach allows for a more complete picture of the investment landscape by highlighting the potential downside risks while also capturing the nuanced dynamics of stock market returns. Thus, it serves as a critical tool in both individual investment decisions and broader financial portfolio management.
Long Call Option Strategy
When choosing the most profitable long call options for Intel Corporation (INTC), we consider options with varying expirations and strike prices, particularly focusing on those which have robust delta values and intriguing gamma and vega metrics, enhancing their responsiveness to underlying asset price changes and volatility, respectively. For our analysis, we also consider options that achieve a balance between price sensitivity and reasonable costs, with a target stock price increase of 5%.
-
Short-Term Option (3 days to expiration, Strike 31.0): The strike price at 31.0 with only 3 days to expiration shows a delta of 0.360, gamma of 0.399, and vega of 1.040. Despite the higher theta (-0.059), which could erode option value as expiry approaches, its lower premium and relatively high gamma suggest responsiveness to any immediate upward price movements. Such an option might be appealing for a speculative bet on immediate price jumps given upcoming company announcements or market trends.
-
Medium-Term Option (17 days to expiration, Strike 29.0): This option displays a delta of 0.753, making it substantially responsive to INTC's price movements. The gamma value of 0.117 suggests that the delta could increase sharply on price movements, enhancing leverage. The reasonable vega of 2.084 alongside a theta of -0.026 implies that for an investor expecting volatility and has a 17-day outlook, this strike provides a balanced cost-to-benefit ratio.
-
Long-Term Option (38 days to expiration, Strike 25.0): With a longer time frame, this option has a lower but ample delta of 0.898 and a gamma of 0.033. Vega sits at 1.732, offering increased sensitivity to volatility that could occur over a more extended period. A strike price of 25.0 could be an attractive target assuming positive mid-term adjustments or announcements from Intel, with a theta of -0.014 providing less decay rate versus nearer-term options.
-
Longer-Term Option (66 days to expiration, Strike 24.0): A more bullish position might consider this option, with a delta of 0.889, gamma of 0.027, and vega of 2.416. The choice of a 66-day expiration allows for witnessing several market cycles and potential beneficial developments in Intels operations, strategy, or external market conditions. The theta of -0.011 is a mild trade-off for the given time value.
-
Extended Long-Term Option (129 days to expiration, Strike 20.0): With the longest term among selected options and a focus on substantial future growth, this call sports a high delta of 0.924 and a vega of 2.443, allowing strong growth potential and volatility play. Its particularly catered to investors estimating structural shifts or considerable sector growth, backed by a moderated theta of -0.006.
Considering these variations offers a strategic approach catered to different risk appetites, market outlooks, and investment horizons. Each chosen strike and expiration aligns with a specific market thesis extending from rapid growth expectations to betting on long-term strategic shifts at Intel.
Short Call Option Strategy
Analysis of Long-Term Profitable Short Call Options for Intel Corporation
Overview
This analysis provides insight into the most profitable short call options for Intel Corporation, focusing on different expiration dates spanning from near-term to long-term maturity. We'll consider options that maximize returns while minimizing risk, particularly by looking at in-the-money situations to lessen the possibility of the options being exercised.
1. Near-Term Option (May 2024)
- Strike Price: $25
- Expiration Date: May 2024
- Premium: $11.05
- Annualized ROI: 62.87%
This option provides a high return on investment in the short term, making it a lucrative choice for traders looking to capitalize on quick gains. The higher strike relative to the current price reduces assignment risk, making it favorable for risk-averse traders.
2. Mid-Term Option (May 2025)
- Strike Price: $20
- Expiration Date: May 2025
- Premium: $13.90
- Annualized ROI: 20.12%
Holding the position for a year, this call option is notable for its significant premium, which could provide consistent returns over the holding period. The lower strike price compared to the long-term options means a greater risk of exercise should the stock price rise significantly; however, the substantial premium compensates for this risk.
3. Long-Term Option (June 2026)
- Strike Price: $30
- Expiration Date: June 2026
- Premium: $6.15
- Annualized ROI: 100%
Offering a significant return due to the very high premium, this is a strategic choice for traders willing to engage in a longer holding period. The higher strike price aids in managing the risk of the option being exercised early.
4. Extended Long-Term Option (December 2026)
- Strike Price: $47
- Expiration Date: December 2026
- Premium: $3.58
- Annualized ROI: 100%
As the latest expiration in our selection, this option comes with considerable premiums and the lowest exercise risk due to its high strike price relative to current levels. It's an attractive pick for traders looking for extended exposure with protection against early exercise.
5. Ultra Long-Term Option (June 2027)
- Strike Price: $20
- Expiration Date: June 2027
- Premium: $17.5
- Annualized ROI: 19.41%
This option stands out due to the extremely high premium offered, reflective of the extended duration and higher uncertainty. The strike price, however, is lower relative to other options, so there's a larger risk of being assigned if the stock price rises significantly, benefiting traders who are bullish on the long-term prospects of the technology sector.
Conclusion
Each selected option provides a strategic angle, whether it be short-term profitability, balance between risk and return, or long-term investment with significant premiums. As observed, the longer the expiration, the higher the premiums generally, which could serve as a cushion against volatility and market changes. Prioritizing options with higher strikes relative to current prices can also help manage the risk of early assignment, making these trades appealing for a range of investing strategies.
Long Put Option Strategy
Analyzing the long put options for Intel Corporation (INTC), particularly aiming for profit maximization under an assumption that the stock price may increase by 5%, it becomes imperative to explore options with diverse characteristics which include varied strikes, expiration dates, and Greeks.
Considering an expiration date in the near term, we have the $60 strike put option expiring on May 24, 2024. This option stands out with a delta of -0.8608, indicating a substantial negative movement with the stock price increment, a gamma of 0.0212, vega of 1.1211, and a high risk-negating theta of -0.1112. With cohesion between the sensitivity to the underlying stock's price (delta and gamma) and its responsiveness to the volatility (vega), this option offers a balanced risk-return potential.
Moving slightly longer term, the $60 strike option expiring on June 21, 2024, possesses a delta of -0.9355 (which is more desirable in a long put as it suggests higher in-the-money probability with a decline in stock price), a gamma of 0.0104, and a notably high vega of 1.2193. This option emerges as a strong candidate for protection against volatility while maintaining reasonable expectations of profitability (with a theta of -0.0135, indicating slow time decay).
Further along the line, a longer-term yet highly attractive option is the $65 strike put expiring on July 19, 2024, highlighted by an exceptionally high delta of -0.9969 and minimal gamma and vega (0 and 0), underscoring a strong directional bet with minimal sensitivity to volatility. This option, thanks to its lower sensitivity to time decay (theta of 0.0065), offers a significant return potential given the impending time period.
Looking into the late-year options, the $65 strike option for December 20, 2024, with a delta of -0.9024, gamma of 0.0111, and a noticeable vega of 3.7717, shows adaptability to volatility changes while keeping a slower time decay (theta of 0.0011). This option suggests a reasonable balance for those predicting variances further into the future.
Lastly, for the longest term evaluated, the $65 strike put for January 16, 2026, manifests a relatively high vega of 9.4828 paired with a delta of -0.8141 and gamma of 0.0140. Despite its later expiration, it also exhibits low sensitivity to time decay (theta of 0.0025) and provides an expansive timeframe for market shifts, especially appealing under volatile circumstances.
Each of these put options allows traders to strategically position depending on their risk tolerance, predicted time frame of the market movement, and responsiveness to underlying asset volatility. The combinations of their Greeks suggest tailored approaches to options trading based on expected market conditions closer to their respective expiration periods.
Short Put Option Strategy
Analyzing short put options involves assessing various Greek values which indicate how sensitive the options premium is to changes in market variables such as the price of the underlying stock, time, and volatility. For traders aiming to minimize the risk of assignment (where the holder of the put option exercises their right to sell the underlying stock at the strike price), it's essential to consider options that are sufficiently profitable but also where the underlying is likely not to fall below the strike price.
Given the goal to minimize assignment risk and based on the currently provided Greeks and market conditions, let's delve into specific options ranging from near-term to long-term:
-
Short-term Option - An option expiring on May 24, 2024, with a $28.0 strike shows notable characteristics. The delta is -0.0451795251, which suggests moderate sensitivity to price movements of the underlying stock a nice balance offering higher premiums while keeping assignment risk controlled. This option also has a good theta of -0.0077987367, indicating profitable erosion of option value with time, crucial for short put strategies. The premium of $0.05 gives a high return on investment, enticing for short-term speculation.
-
Medium-term Option - Looking slightly further ahead, the option expiring on June 14, 2024, with a strike of $27.0 shows a delta of -0.071397623, a clear indicator of greater insensitivity to price swings than shorter-dated options. It reverberates with an attractive theta value of -0.0059143742, which again is favorable for premium decay. The ROI is 100%, and the premium is $0.09, offering a lucrative opportunity for traders looking for a balance between time and profitability.
-
Long-term Option (1) - As we stretch into the longer-term options, the choice expiring on January 14, 2025, with a strike of $30.0 becomes appealing. This one stands out with a delta of -0.3255432725, indicating lesser reactivity to price changes, thereby reducing assignment risk. The theta of -0.0090498573 is substantial, allowing traders to capitalize on the decay. The premium is $1.24, which equates to a100% ROI, fitting for those willing to commit capital for an extended period.
-
Long-term Option (2) - Further out, the option expiring on June 7, 2024, with a strike at 29.0 offers another suitable profile. With a delta of -0.2105060954, associated risks of price movements are still moderated. Its premium is $0.29, and the theta is -0.013024418, which is advantageous for the decay-focused strategy and giving a remarkable ROI.
-
Ultra Long-term Option - Lastly, looking at the most extended option expiring on June 20, 2025, with a strike price of $35.0, we find appealing attributes with a delta of -0.5569604168 indicating lower sensitivity to immediate price moves. With a theta of -0.0026037031, the gradual decrease in price over time plays well into the strategy of premium erosion. The substantial premium of $6.7 reflects the longer commitment and higher risk, yet provides an impressive ROI scenario.
When choosing short put options, looking at a blend of delta, theta, and the premium value is critical, especially considering how these factors contribute to your trading goals and risk tolerance. Each of the options listed provides a strategic advantage depending on how soon you expect to generate returns and how much market movement risk you are prepared to handle.
Vertical Bear Put Spread Option Strategy
To identify the most profitable bear put spread option strategies involving Intel Corporation (INTC), we will analyze a combination of short and long puts. The main goal is to maximize the payout from the price decrease while managing the expenses and risks associated with purchasing and selling options contracts.
A bear put spread implies buying a put option (long put) at a higher strike price while simultaneously selling a put option (short put) at a lower strike price, with both options having the same expiration date. As the stock price falls below the higher strike, this strategy will become profitable, but the gains are capped once the price goes beneath the lower strike price.
Let's build a strategy selection keeping in mind Intel's expected short-term stock price movement. The strategies are analyzed based on their distance to expiration and strike prices, intending to cater to different trading outlooks, from short-term to long-term bearish views.
Strategy 1
Short-Term Aggressive Bear Put Spread:
- Buy Long Put: Strike Price: $65, Expire: 2024-07-19, Premium: $33.55, ROI: approx. 15.5%, Delta: -0.89
- Sell Short Put: Strike Price: $60, Expire: 2024-07-19, Premium: $16.3, ROI: approx. 76%, Delta: -0.99
Strategy 2
Short-Term Moderate Bear Put Spread:
- Buy Long Put: Strike Price: $55, Expire: 2024-06-21, Premium: $15.03, ROI: approx. 57%, Delta: -0.96
- Sell Short Put: Strike Price: $50, Expire: 2024-06-21, Premium: $10.2, ROI: approx. 21%, Delta: -0.98
Strategy 3
Medium-Term Moderate Bear Put Spread:
- Buy Long Put: Strike Price: $70, Expire: 2025-01-16, Premium: $34.8, ROI: approx. 11%, Delta: -0.67
- Sell Short Put: Strike Price: $65, Expire: 2025-01-16, Premium: $32.8, ROI: approx. 2%, Delta: -0.81
Strategy 4
Long-Term Aggressive Bear Put Spread:
- Buy Long Put: Strike Price: $70, Expire: 2026-06-18, Premium: $26.0, ROI: approx. 49%, Delta: -0.97
- Sell Short Put: Strike Price: $60, Expire: 2026-06-18, Premium: $20.08, ROI: approx. 90%, Delta: -0.84
Strategy 5
Very Long-Term Bear Put Spread:
- Buy Long Put: Strike Price: $70, Expire: 2026-12-18, Premium: $28.3, ROI: approx. 37%, Delta: -0.97
- Sell Short Put: Strike Price: $65, Expire: 2026-12-18, Premium: $18.0, ROI: approx. 87%, Delta: -0.97
Each strategy represents a choice based on different risk appetites, outlook times, and premium costs. By combining long and short puts, these strategies take advantage of the volatility and time decay, thereby optimizing the potential returns with controlled risk. The selection aims to cater from aggressive to conservative strategies depending on how bearish one's outlook is and how much one is willing to spend upfront for potential profitability.
Vertical Bull Put Spread Option Strategy
To create a vertical bull put spread for Intel Corporation (INTC), you must first select appropriate combinations of short and long put options. This options strategy involves purchasing a put option at a higher strike price (long put) and selling another put option at a lower strike price (short put), with the same expiration date. The goal of this setup is to profit from mild price increases in the underlying stock or, at the least, minimal movement.
Based on the provided data, analysis, and the intent to ensure five different strategies ranged from near-the-money (NTM) to deep-out-of-the-money (DOTM) options, the following setups appear optimal according to the Greeks, premiums, return on investment (ROI), and overall profit, allowing us to minimize the risk of exposure to significant negative shifts in the market:
- Short-Term, Near-the-Money Spread:
- Short Put: Given the data, we can choose a short put option with a 3-day expiration at a $60 strike. The hypothetical ROI is attractive, suggesting that the time decay (theta) factor contributes significantly to the expected profitability.
-
Long Put: A 3-day expiration, $65 strike put could effectively hedge this position. This long put comes with enough extrinsic value (representing time value and implied volatility) to balance the risk involved in being assigned on the short put.
-
Mid-Term Position:
- Short Put: A 10-day expiration at a $55 strike. This option has a manageable delta, meaning the stock would need a significant downturn for the option to move deeply in-the-money, thus helping to safeguard the position somewhat.
-
Long Put: A 10-day expiration at a $60 strike would hedge against extreme downside moves, maintaining a stringent control on the risk exposure provided it retains enough sensitivity to underlying price changes (gamma and delta).
-
Longer-Term Position with Slightly Lower Strike:
- Short Put: A 31-day expiration at a $50 strike. Because the long duration increases the exposure to theta decay while the delta suggests the exposure to stock price changes is still manageable.
-
Long Put: Complement this with a 31-day expiration at a $55 strike. This alignment provides robust protection while benefiting from the intervening premiums.
-
Moderately Extended Term with Moderate Strike Difference:
- Short Put: A 94-day expiration at a $45 strike. This proves beneficial for gaining more premium upfront while the time value decays over a more extended period.
-
Long Put: A 94-day expiration at a $50 strike, setting a safeguard with a relatively conservative leap in strike prices which provides enough room to capitalize on favorable movements or stabilities in stock prices.
-
Long-Termed Deep-Out-of-the-Money for Conservative Strategy:
- Short Put: For an exceptionally conservative stance, a 220-day expiration at a $40 strike brings lower premiums but significantly reduced risk exposure.
- Long Put: A 220-day expiration at a $45 strike. The added duration helps to hedge the long-term uncertainties while maintaining a healthy span between strikes for capturing premium differences efficiently.
Each strategy above is tailored to distinct market or individual risk preferences, ensuring there's a suitable strategy whether one anticipates neutral, moderately bullish, or strongly bullish scenarios. The recommended strikes and durations help in balancing the Greeks to improve ROI, manage risks effectively via hedging, and ensure the profitability of each bull spread strategy according to estimated market conditions.
Vertical Bear Call Spread Option Strategy
Given our interest in the vertical bear call spread, we will focus on selecting the most profitable bear call spread strategies based on the long-term horizon, considering various expirations from near-term to long-term options available.
- March 2025 Expiration:
- Sell Call Option: Strike $28, Premium $6.75, Delta 0.6783, Gamma 0.0207, Vega 13.4, Theta -0.0063, Rho 17.34
-
Buy Call Option: Strike $30, Premium $5.6, Delta 0.656, Gamma 0.0236, Vega 15.89, Theta -0.0064, Rho 19.54 This pair offers close deltas, reducing risk and potential downward movement cushion. The spread premium collected is $1.15 ($6.75 - $5.6 = $1.15). This strategy benefits from time decay with theta relatively similar. Higher gamma and vega suggest increased sensitivity to the underlying's price and volatility changes, which should be cautiously managed.
-
June 2025 Expiration (365 days):
- Sell Call Option: Strike $20, Premium $11.9, Delta 0.826, Gamma 0.0087, Vega 11.32, Theta -0.0032, Rho 25.88
-
Buy Call Option: Strike $23, Premium $9.34, Delta 0.788, Gamma 0.0159, Vega 13.11, Theta -0.0051, Rho 26.05 The spread, offering a collected premium of $2.56 ($11.9 - $9.34 = $2.56), has well-matched deltas, reducing directional risk exposure and providing a decent margin. The difference in Theta and Vega values between two options indicates a sensitive response to time decay and volatility, potentially benefiting from stabilization or decrease in the underlying asset's volatility.
-
December 2025 Expiration (670 days):
- Sell Call Option: Strike $25, Premium $10.8, Delta 0.7385, Gamma 0.0132, Vega 14.3, Theta -0.0037, Rho 29.57
-
Buy Call Option: Strike $28, Premium $8.1, Delta 0.685, Gamma 0.0147, Vega 15.9, Theta -0.0041, Rho 24.98 Here, the spread realizes a net premium of $2.7 ($10.8 - $8.1 = $2.7). This spread is supposed to capitalize on significant Vega, suggesting pronounced responsiveness toward volatility shifts, crucial for longer-duration options amid market uncertainty.
-
June 2026 Expiration (over 730 days):
- Sell Call Option: Strike $18, Premium $15, Delta 0.866, Gamma 0.0226, Vega 18.47, Theta -0.0047, Rho 16.58
-
Buy Call Option: Strike $21, Premium $12.98, Delta 0.8, Gamma 0.0262, Vega 20.77, Theta -0.0058, Rho 18.76 The collected premium is $2.02 ($15 - $12.98 = $2.02). Among the high duration options, this offers substantial room for leveraging gamma and vega exposure, where a correct directional bet could significantly amplify returns, especially observing the high rho indicating sensitivity to interest rate changes.
-
December 2026 Expiration (995 days):
- Sell Call Option: Strike $23, Premium $10.63, Delta 0.788, Gamma 0.0159, Vega 16.84, Theta -0.0051, Rho 18.22
- Buy Call Option: Strike $26, Premium $8.1, Delta 0.74, Gamma 0.0192, Vega 18.2, Theta -0.0056, Rho 20.49 The collected premium from this spread is $2.53 ($10.63 - $8.1 = $2.53), with a focus on high vega, making this strategy favorable during anticipated high volatility periods that could boost the premium on the short call significantly while protecting the downside with the long call.
In each instance, the strategy aims to get the most out of high theta (time decay) and vega (volatility sensitivity), balancing with directional risk through matched deltas. Profits depend on the underlying not breaching the short call's strike price at expiration, with the potential for dynamic adjustments based on observed price movements and volatility changes.
Vertical Bull Call Spread Option Strategy
For a vertical bull call spread strategy on Intel Corporation options, the most profitable approach would consider various parameters concerning potential returns and understanding the risks associated. A deep dive into specific data and choosing calls varying in near-term to long-term expirations allows us to structure a strategy that can optimize our gains while managing risks proficiently.
-
Short-term (within 3 months): Looking at the closer expiration dates, a solid opportunity emerges when considering shorter dated options that are slightly out of the money. For instance, purchasing calls with a strike price where gamma and vega values are high can be advantageous, considering the leverage upon rapid price movements in the underlying Intel stock. Here, focusing on options with an expiration of about 10 days, purchasing an ITM call with a strike price around $27, due to the substantial vega indicating vital responsiveness to implied volatility changes, can be coupled with selling the same expiration call at a strike around $29. This would harness not just the beneficial movements of Intel's stock but also protect against the potential decline, particularly since the options are short-dated, thereby limiting our time exposure.
-
Medium term (3-6 months): As periods extend, the effect of theta (time decay) becomes more pronounced. To tackle this in our strategy, calls that offer favorable risk-reward profiles, especially those with lower theta values, become crucial. For a time frame of around 4 months, consider buying at the money (ATM) calls for balances strike risk and potential growth. Selling higher strike calls combats the adverse effects of time decay. This might involve buying a call with a strike around $30 and selling a call with a strike around $35. The choice of these strikes is influenced by lower theta values, reducing the cost of carrying these options over the duration.
-
Long term (6 months and beyond): Here, options with longer expiries offer greater flexibility amidst market variability. The strategy should involve purchasing deep ITM options to enhance intrinsic value and selling OTM options to capitalize on the premium while still being protected against substantive declines. We could look at buying a call with a strike around $20 and selling a call with a strike around $30 for options expiring in a year. The broader range between strikes provides the room necessary for the stock to grow while ensuring reduced cost due to the premium received from selling the higher strike call.
This vertical bull call spread strategy across different time frames considers crucial aspects such as gamma, vega, and theta, maximizing chances for profit while safeguarding against potential downturns. By intricately choosing strikes based on the stock's performance and projected path, coupled with intelligently dated expirations, this approach not only hedges risks but also optimizes the potential returns from premium differences and the beneficial move of the underlying stock. Remember, the key to profitability in options often lies in meticulous planning and adapting to perceived risk and reward scenarios over varied time frames.
Similar Companies in Semiconductors:
Report: NVIDIA Corporation (NVDA), NVIDIA Corporation (NVDA), Report: Taiwan Semiconductor Manufacturing Company Limited (TSM), Taiwan Semiconductor Manufacturing Company Limited (TSM), Report: Marvell Technology, Inc. (MRVL), Marvell Technology, Inc. (MRVL), Report: Micron Technology, Inc. (MU), Micron Technology, Inc. (MU), Report: Advanced Micro Devices, Inc. (AMD), Advanced Micro Devices, Inc. (AMD), Report: Broadcom Inc. (AVGO), Broadcom Inc. (AVGO), Report: Qualcomm Inc (QCOM), Qualcomm Inc (QCOM), Report: Texas Instruments (TXN), Texas Instruments (TXN)
https://seekingalpha.com/article/4681279-intel-everything-rides-on-18a-im-bullish
https://www.fool.com/investing/2024/03/30/intels-lunar-lake-could-be-a-threat-to-apples-macb/
https://seekingalpha.com/article/4681409-intel-laying-groundwork-for-explosive-share-price-upside
https://www.fool.com/investing/2024/04/01/why-intel-stock-climbed-while-the-market-fell-toda/
https://www.fool.com/investing/2024/04/02/what-intel-stock-investors-should-know-about-recen/
https://www.youtube.com/watch?v=O6LKWo16zAE
https://www.youtube.com/watch?v=pjhcks5XKcM
https://www.proactiveinvestors.com/companies/news/1044469?SNAPI
https://www.fool.com/investing/2024/04/03/intel-stock-heading-higher-wall-street-analyst/
https://www.fool.com/investing/2024/04/03/intel-investors-should-hear-what-the-ceo-just-said/
https://www.youtube.com/watch?v=Ve3bfKBDxVQ
https://www.fool.com/investing/2024/04/03/why-intel-stock-was-sliding-today/
https://www.sec.gov/Archives/edgar/data/50863/000005086323000103/intc-20230930.htm
Copyright © 2024 Tiny Computers (email@tinycomputers.io)
Report ID: GzUacK
Cost: $1.12488
https://reports.tinycomputers.io/INTC/INTC-2024-05-13.html Home