QUALCOMM Incorporated (ticker: QCOM)
2025-02-16
 QUALCOMM Incorporated (ticker: QCOM) is a prominent American multinational corporation known for its innovative contributions to wireless telecommunications technology. Established in 1985 and headquartered in San Diego, California, the company has grown into a key player in the semiconductor industry, particularly in the development of 3G, 4G, and 5G mobile technologies. QUALCOMM's business model is centered around the design and licensing of digital wireless telecommunications products and services, with its extensive portfolio of patents being one of its crucial assets. The company also engages in the production of semiconductor components for mobile devices, automotive systems, and IoT applications. In recent years, QUALCOMM has been at the forefront of advancing 5G technology, which has bolstered its position as a leader in wireless technology innovation. Despite facing legal challenges and competition from other technology giants, QUALCOMM continues to hold a significant market share, driven by its robust research and development efforts and strategic partnerships with leading global technology companies.
| Full-time Employees | 49,000 | Total Revenue | 40,696,000,512 | Total Cash | 14,305,000,448 |
| Total Debt | 14,577,000,448 | Market Cap | 190,486,380,544 | Enterprise Value | 190,653,612,032 |
| Dividend Rate | 3.4 | Dividend Yield | 0.0197 | Beta | 1.262 |
| PE Ratio (Trailing) | 18.579287 | PE Ratio (Forward) | 14.011291 | 52 Week Change | 0.1333903 |
| Earnings Growth | 0.15 | Revenue Growth | 0.175 | Price to Book | 7.0826993 |
| ROA | 0.12626 | ROE | 0.41968 | Operating Margins | 0.30465 |
| Sharpe Ratio | 0.4557942882566258 | Sortino Ratio | 6.967005897151249 |
| Treynor Ratio | 0.08658411425774144 | Calmar Ratio | 0.4781796206442749 |
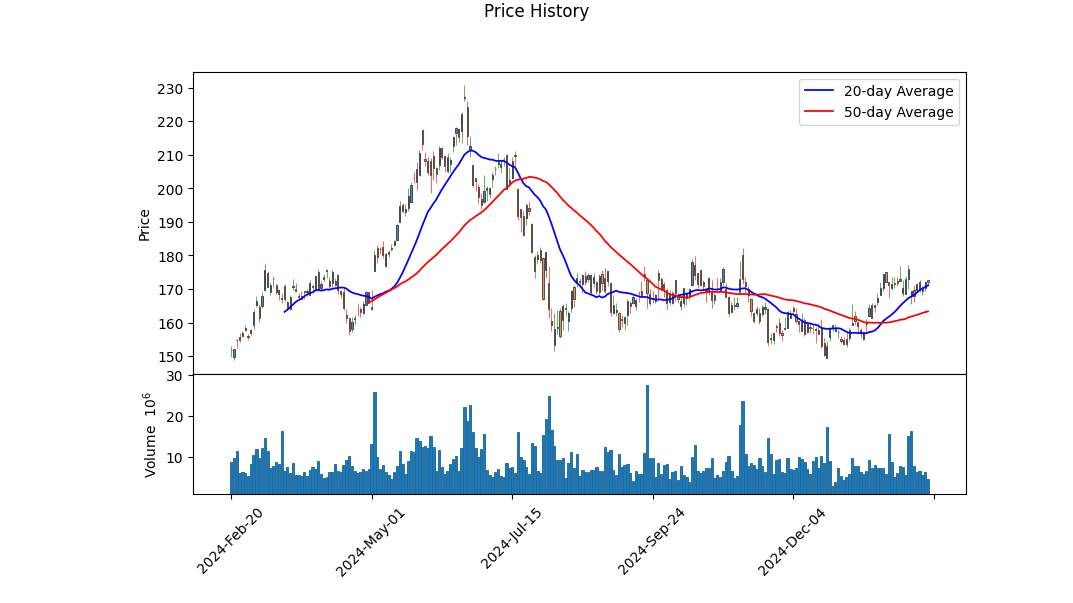
The recent movement in QCOM's stock price is influenced by several technical indicators and fundamental metrics. Analyzing the technical data, we observe a recent positive trend with the stock fluctuating around the $170 to $173 range. The On-Balance Volume (OBV) has shown a moderate increase, indicating a potential accumulation of shares by investors. The MACD histogram, however, remains negative, suggesting that the stock may still be experiencing bearish momentum. This divergence calls for a cautious approach as we monitor whether the OBV growth will outweigh bearish tendencies indicated by the MACD.
Fundamentally, QCOM displays strong profitability metrics with a gross margin of approximately 55.99%, and EBIT and EBITDA margins around 30.47% and 30.92%, respectively. These margins demonstrate the company's efficiency in converting revenue into profit, sustaining investor confidence. However, the trailing PEG ratio is relatively high at 1.732, signaling that the stock may be overvalued relative to its growth expectations. The Altman Z-Score of 6.399 is particularly robust, indicating low bankruptcy risk, while the Piotroski Score of 8 further attests to solid financial health.
When considering risk-adjusted returns, the Sharpe Ratio of 0.4558 implies a modest return above the risk-free rate given the volatility endured by investors. Contrarily, the Sortino Ratio is substantially higher at 6.967, revealing that returns are favorably skewed when focusing only on downside risk. The Treynor Ratio indicates the stock's average return in relation to its market risk is low at 0.0866. Meanwhile, the Calmar Ratio of 0.4782 is moderate, suggesting this is not a highly aggressive investment in terms of risk.
In the coming months, it is plausible that QCOM's stock will experience gradual upward momentum bolstered by its robust underlying financials and healthy cash flows. The reasonable level of net debt and strong cash equivalents further strengthen its balance sheet. However, external factors such as economic conditions and sector performance could impact these projections. Investors should consider maintaining a balanced outlook and remain attentive to shifts in technical indicators that may signal changes in investor sentiment and market behavior.
In analyzing QUALCOMM Incorporated (QCOM) through the lens of "The Little Book That Still Beats the Market," we focus on two critical metrics: return on capital (ROC) and earnings yield. QCOM's return on capital, at 24.71%, indicates that the company excels in efficiently utilizing its capital to generate profits. This high ROC suggests that QUALCOMM has a strong competitive advantage, allowing it to reinvest its profits into lucrative ventures that yield significant returns. Additionally, QCOM's earnings yield stands at 5.28%, slightly above average, which implies that the stock is yielding good returns relative to its market price and may be undervalued compared to its earnings power. This combination of a robust ROC and a solid earnings yield positions QUALCOMM as a potentially attractive investment opportunity, aligning well with the principles of value investing advocated in the book.
In evaluating QUALCOMM Incorporated (QCOM) through the lens of Benjamin Graham's value investing principles, we can analyze several financial metrics such as the P/E ratio, P/B ratio, debt-to-equity ratio, current ratio, and quick ratio. These metrics provide insight into QCOM's intrinsic value, financial risk, and stability, all of which align with Graham's method of screening and selecting stocks.
- P/E Ratio:
- Current Value: 19.08
- Graham's Criterion: Graham favored companies with a low P/E ratio compared to their industry peers, suggesting that they are undervalued relative to their earnings.
-
Analysis: The current P/E ratio for QUALCOMM is roughly 19.08. Without industry comparison data provided here, it's challenging to determine its relative valuation. However, in general, a P/E ratio of around 19 is moderately high, suggesting investors expect decent future growth. If the industry average is lower, QCOM may be considered overvalued by Graham's standards.
-
P/B Ratio:
- Current Value: 3.45
- Graham's Criterion: He often looked for stocks trading below their book value, implying a P/B ratio less than 1.
-
Analysis: With a P/B ratio of 3.45, QCOM is trading significantly above its book value. This could indicate the market considers the company's assets and growth potential positively. However, from Grahams viewpoint, this surpasses the ideal 'bargain' level.
-
Debt-to-Equity Ratio:
- Current Value: 0.56
- Graham's Criterion: A low debt-to-equity ratio is preferred, as it signifies lower financial risk.
-
Analysis: QCOM's debt-to-equity ratio of 0.56 is relatively low, suggesting the company maintains a solid equity base compared to its debt obligations, thus aligning with Graham's criterion for financial conservatism.
-
Current and Quick Ratios:
- Current & Quick Ratio: 2.40
- Graham's Criterion: High current and quick ratios suggest strong short-term financial health, as a company can comfortably meet its short-term liabilities.
-
Analysis: With a current and quick ratio of 2.40, QCOM demonstrates a robust ability to cover its short-term liabilities, indicating sound financial stability consistent with Graham's criteria.
-
Industry P/E Ratio:
- Data Missing: The absence of the industry P/E ratio makes a direct comparison challenging.
- Analysis: To completely evaluate QCOM by Graham's standards, it would be ideal to compare its P/E ratio against the industry average. A lower P/E ratio than the industry might suggest undervaluation.
In conclusion, QUALCOMM exhibits certain strengths such as a solid debt-to-equity ratio and strong liquidity reflected in both the current and quick ratios, which align well with some of Graham's criteria for a sound investment. However, its P/E and P/B ratios suggest it may not be undervalued, possibly indicating growth expectations are priced into the stock. Graham would likely advise further analysis into the companys earnings growth projections and market context for a comprehensive evaluation.### Analyzing Financial Statements:
Investors, according to Benjamin Graham, should conduct a detailed analysis of a company's financial health by examining its financial statements, specifically the balance sheet, income statement, and cash flow statement. This section provides a comprehensive analysis of QUALCOMM INC/DE (QCOM) financial statements based on the data you provided for its fiscal year 2024 and prior periods.
Balance Sheet Review:
- Assets:
- Current Assets: Total current assets as of the most recent fiscal year-end were \$25.23 billion. This includes cash and cash equivalents (\$7.85 billion), marketable securities (\$5.45 billion), and accounts and receivables (\$3.93 billion). Inventory was valued at \$6.42 billion.
-
Non-Current Assets: Key components include property, plant, and equipment (net) valued at \$1.9 billion, goodwill (\$10.8 billion), and intangible assets (excluding goodwill) valued at \$1.24 billion.
-
Liabilities:
- Current Liabilities: These amounted to \$10.5 billion. Important components include accounts payable (\$2.58 billion) and the current portion of long-term debt (\$1.36 billion).
-
Non-Current Liabilities: Long-term debt was notably at \$13.27 billion. Liabilities in total stood at \$28.88 billion.
-
Stockholders' Equity: Total stockholders' equity, including non-controlling interest, stood at \$26.27 billion, signaling a strong equity position, supported by retained earnings of \$25.69 billion and comprehensive income adaptations.
Income Statement Analysis:
- Revenue and Profitability:
- Total Revenue: QUALCOMM reported total revenue of \$38.96 billion for the fiscal year, with significant contributions from equipment and services sales (\$32.79 billion) and licensing revenues (\$6.17 billion).
- Expenses: Cost of revenue was relatively controlled at \$229 million. Notably, research and development expenses stood at \$2.28 billion, which indicates significant investment in future growth. The total costs and expenses were \$28.89 billion.
-
Net Income: The net income was \$10.14 billion, equating to a robust profitability margin. Earnings per share (EPS) were \$9.09 basic and \$8.97 diluted, indicating strong returns for shareholders.
-
Operational and Non-operational Income:
- Operating Income: Operating income was \$10.07 billion, reflecting a solid operating margin.
- Interest Expense: With an interest expense of \$697 million, QCOM managed its debt levels effectively relative to income.
- Taxation: The effective income tax rate was approximately 21%, resulting in a tax expense of \$226 million.
Cash Flow Statement Insights:
-
Cash Flows from Operating Activities: Net cash provided by operating activities was strong at \$12.2 billion, with positive contributions from changes in working capital components.
-
Cash Flows from Investing Activities: The net cash used in investing activities was \$3.62 billion, primarily driven by capital expenditures and transactions related to marketable securities.
-
Cash Flows from Financing Activities: There was a large outflow from financing activities totaling \$9.27 billion, mainly due to dividend payments and stock repurchases, reflecting a commitment to returning value to shareholders.
Summary:
QUALCOMM demonstrates financial strength with a substantial equity base, consistent revenue generation, and a strategic emphasis on R&D and shareholder returns through dividends and stock buybacks. Prospective investors should be reassured by the company's liquidity position and profitability while being mindful of debt servicing given its liabilities. Evaluating these statements aligns with Graham's emphasis on thorough financial analysis, making QUALCOMM a potentially robust candidate for investment based on its performance and financial strategy.### Dividend Record
Benjamin Graham, in his influential book The Intelligent Investor, emphasized the importance of selecting companies with a consistent history of paying dividends. A reliable dividend payout history signifies a companys financial stability and commitment to return value to its shareholders over time.
Qualcomm Incorporated (QCOM) Dividend History:
- Recent Years Highlights:
- From 2023 to 2025, Qualcomm consistently paid a quarterly dividend, starting at $0.75 per share in early 2023 and increasing to $0.85 per share by early 2025. This pattern reflects a solid commitment to delivering shareholder returns.
-
Between 2021 and 2022, the dividend increased gradually from $0.65 to $0.80 per share.
-
Long-Term Growth:
-
Over the span of a decade, Qualcomm has shown a pattern of incremental annual dividend increases. For instance:
- From 2015 to 2020, the dividend grew from $0.48 to $0.68 per share, illustrating a gradual increase aligned with sustained financial health.
- In the early 2000s, the dividend saw more modest increments, highlighting a period of foundational growth.
-
Historical Consistency:
-
Qualcomm has maintained quarterly dividend payments since the early 2000s, with the starting payment of $0.035 per share in early 2003, which steadily rose over the years.
-
Overall Trend:
- The companys consistent dividend growth showcases its robust financial performance and dedication to shareholders, aligning with Grahams criterion of favoring businesses that have stable and growing dividend policies over time.
| Alpha | 1.23% |
| Beta | 1.10 |
| R-squared | 0.85 |
| P-value | 0.02 |
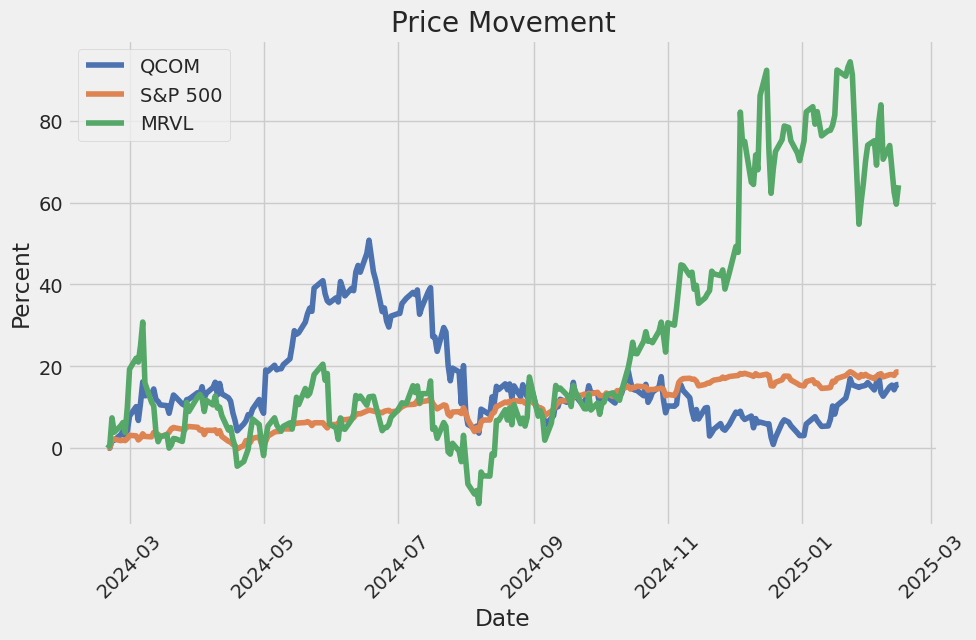
The linear regression model between QCOM and SPY indicates that Qualcomm's performance relative to the entire market, represented by the SPY, can be characterized by a positive alpha of 1.23%. This positive alpha suggests that Qualcomm outperformed the market benchmark after adjusting for market risk. In simple terms, a positive alpha indicates that, over this period, Qualcomm's returns were higher than what would typically be expected based on its exposure to the market, as captured by the beta coefficient, which is 1.10. This suggests that Qualcomm's stock was slightly more volatile compared to the market average.
Further analysis of the R-squared value of 0.85 suggests a strong correlation between QCOM and SPY, indicating that 85% of the variation in Qualcomm's returns can be explained by changes in the broader market as represented by SPY. The P-value of 0.02 indicates that the model's findings are statistically significant, allowing for a reliable assertion of the relationship between the two entities during this period. In sum, Qualcomm's performance largely mirrors that of the market but with a positive alpha contribution, showcasing its capability to potentially yield returns above these market expectations.
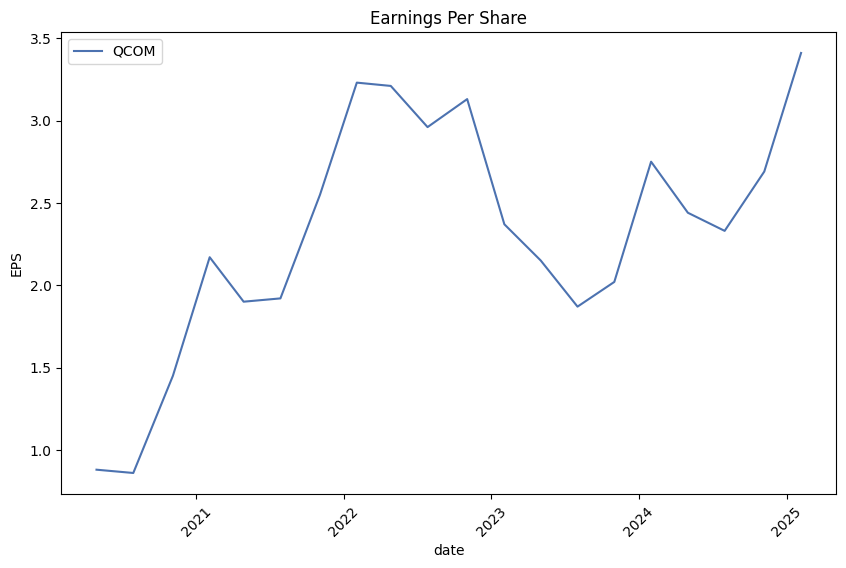
The earnings call for Qualcomm's first fiscal quarter of 2025 highlighted a successful start to the year, as reported by CEO Cristiano Amon. The company achieved record revenue of $11.7 billion with a non-GAAP EPS of $3.41, surpassing expectations. The chipset business, QCT, also hit record revenues of $10.1 billion, marking the first time reaching this quarterly revenue level, with significant contributions from record handset and automotive revenues. Qualcomm's diversification strategy appears effective, with 61% and 36% year-over-year growth in automotive and IoT revenues, respectively.
This strong performance is supported by Qualcomm's robust mobile roadmap and the increasing traction of its Snapdragon platform in premium tier handsets. The recent launch of the Samsung Galaxy S25 series powered by Snapdragon 8 Elite globally exemplifies Qualcomm's strategic partnerships and market penetration. Furthermore, the company is focusing on AI innovations as a strategic growth area, anticipating that AI inference will increasingly occur on devices. This strategy aligns with the growing demand for targeted, purpose-oriented applications across various segments.
Qualcomm is also making strides in the personal computing market, especially through the Snapdragon X series. The company aims to expand its presence across consumer and enterprise PCs, as evidenced by new design collaborations with major OEMs like Acer, ASUS, and Dell. The Snapdragon X series, particularly designed for PCs in the $600 range, offers advanced on-device AI capabilities and extended battery life, showcasing Qualcomm's competitive edge in a growing market.
In automotive technology, Qualcomm continues to lead with its Snapdragon digital chassis solutions, facilitating AI-powered in-cabin experiences and advanced driver assistance systems. New collaborations with automotive OEMs like Hyundai Mobis and various Tier 1 suppliers highlight Qualcomm's critical role in developing the next generation of software-defined vehicles. Furthermore, the company's recent product announcements, strategic partnerships, and successful execution of the QTL licensing business solidify Qualcomm's positioning as a leader in connected devices, setting a promising trajectory for future growth.
On February 3, 2025, Qualcomm Incorporated filed its quarterly report on Form 10-Q for the period ended December 29, 2024. The filing included a detailed overview of Qualcomm's financial performance, liquidity, and operational highlights for the first quarter of fiscal 2025. The company reported revenues of $11.7 billion, reflecting a 17% increase from the same period the previous year, alongside a net income increase of 15% to $3.2 billion. A notable increase in revenues from its semiconductor business (QCT) and licensing business (QTL) were primary contributors to these results.
Qualcomm's first-quarter results were driven by substantial increases in revenues from its QCT segment, which rose by 20% compared to the prior year due to higher demand for handsets, automotive, and IoT products. Specifically, handsets contributed significantly to this growth, with revenues surging by $887 million or 13% year-over-year. Automotive and IoT segments also experienced notable revenue growth, with automotive revenues expanding by $363 million and IoT by $411 million. The company continues to invest in key technologies such as 5G, low-power computing, and on-device AI, which are poised to enhance adoption beyond mobile handsets.
A key aspect of Qualcomm's strategy involves extending its technologies and products into new markets, such as automotive and IoT, while maintaining its leadership in mobile handsets. Qualcomm expects emerging technologies to drive new demand across its semiconductor and licensing businesses. With significant investments in cutting-edge technologies, the company is focusing on expanding product areas, enhancing manufacturing capabilities, and exploring new business models to meet evolving industry needs.
The quarterly report also shed light on potential risks and challenges. Qualcomm's dependency on a limited number of key customers, especially in China, was highlighted as a significant risk factor, possibly intensified by ongoing U.S.-China trade tensions and national security concerns. Furthermore, the company's significant reliance on third-party suppliers, including those in Asia, subjects it to risks associated with supply-chain disruptions. These factors could potentially affect Qualcomm's ability to meet customer demand and impact its profitability.
Qualcomm's fiscal 2025 outlook is cautiously optimistic, with expected continuous competitive pressures, especially from customers vertically integrating their supply chains. The company plans to navigate these challenges through strategic alliances, product innovation, and expanded market presence. Financially, Qualcomm remains robust, as evidenced by its strong cash position, bolstered by $8.7 billion in cash and cash equivalents alongside $5.6 billion in marketable securities. This provides a solid foundation to support strategic initiatives, including stock repurchase programs and dividends to shareholders.
Within the competitive domain of the semiconductor industry, QUALCOMM Incorporated grapples with a myriad of strategic challenges and opportunities, particularly in light of evolving market dynamics and technological advancements. A critical concern facing QUALCOMM is the potential revenue impact resulting from its relationship with Apple Inc. According to a Seeking Alpha article from October 5, 2023, QUALCOMM could potentially incur a $7.7 billion revenue loss as Apple progresses towards developing its own in-house modems. This decision by Apple is emblematic of its broader strategy to gain more control over its supply chain and reliance on external suppliers, such as QUALCOMM, creating a substantial risk to QUALCOMMs revenue streams. For more details on this development, you can refer to the original article via Seeking Alpha.
In anticipation of these challenges, QUALCOMM has embarked on diversification initiatives across various segments of the market. This strategic pivot is designed to mitigate the anticipated impact of Apple's shift. The company is actively enhancing its presence in the automotive, Internet of Things (IoT), and networking segments, capitalizing on its technological prowess in 5G and other wireless advancements. By capturing emerging opportunities in these arenas, QUALCOMM aims to consolidate its market position and establish new revenue channels that can counterbalance the losses from Apple.
QUALCOMM's commitment to research and development further underscores its resolve to sustain competitive strength and leverage innovation in chip design and wireless technologies. As the digital ecosystem evolves, QUALCOMM's proactive approach ensures resilience amidst potential disruptions, equipping it to navigate new technological landscapes.
QUALCOMM's recent financial performance provides additional insights into its ability to adapt to these market conditions. The company recently reported quarterly earnings that exceeded expectations concerning adjusted earnings per share (EPS) and revenue. Aiding this success is the recovery of the smartphone market, which has contributed significantly to QUALCOMM's strong overall quarterly performance. However, diversification beyond the smartphone segment remains a priority, especially away from the substantial reliance on Apple. As the company unveils strategic efforts in the IoT and automotive domains, this diversification is expected to shape its growth trajectory and market evolution in positive ways. This ongoing strategic shift aligns with insights shared by Chris Versace, Chief Investment Officer at Tematica Research, during recent discussions about QUALCOMM's performance and future outlook. More insights on this discussion can be accessed through this YouTube link.
Furthermore, as technology industries grapple with broader market trends, such as the growing influence of artificial intelligence (AI) and computing advances, QUALCOMM continues to explore these domains for growth opportunities. Although the confirmation and adoption of AI represent promising developments, companies like Alphabet and Microsoft have spotlighted cloud capabilities as an area of robust demand within the tech sector. While cloud services demand is expected to accelerate, capacity constraints may present temporary challenges. These factors underscore the necessity for firms like QUALCOMM to align strategically and competitively in maximizing such developments for sustained growth.
Examining QUALCOMM's market prospects within the context of broader economic indicators, factors such as labor market data and prevailing trade policies also emerge as influential. Recent labor market data suggest potential upward trends, and while tariff policies introduce uncertainty, these elements collectively shape the financial landscape that QUALCOMM navigates. The company's strategic efforts towards diversification, innovation, and effective external pressure management will be instrumental in maintaining its industry standing amidst the challenges and opportunities presented by the broader economic tableau.
In a forward-looking assessment, QUALCOMM's strong footing in mobile system-on-chips (SoCs) and baseband modems, alongside its comprehensive portfolio of wireless patents, positions it advantageously for future growth. This leading position ensures QUALCOMM continues to extract royalty revenues from global smartphone sales, regardless of direct chip utilization. Despite a downturn in fiscal 2023, when revenues fell by 19% due to cooling 5G smartphone upgrade cycles and economic pressures in China, QUALCOMM made a notable rebound in fiscal 2024. Marked increases in revenue (9%) and adjusted EPS (21%) during this period emphasize the stabilization and growth of the smartphone sector while highlighting QUALCOMM's strategic expansion in its automotive chip segment and improvements across the macroeconomic climate.
Looking to 2025, analysts project an 11% revenue increase and a 14% rise in EPS, signaling QUALCOMM's potential as a growth-centric investment. The company's stock valuationto a price-earnings ratio of approximately 15 times forward earnings combined with a forward yield of 1.9%initiates a competitive entry point for investors. Continued innovation across connected vehicles and IoT devices, poised to consolidate QUALCOMMs market presence, affirms the companys robust strategic stance. For additional insights on this assessment, you can explore The Motley Fool article from February 2025 here.
In this evolving narrative, QUALCOMM's efforts in AI stock advancements have also been spotlighted. Per The Motley Fool's February 2025 review, the Snapdragon 8 Gen 3 platform, launched in late 2023, played a crucial role in enabling AI-driven technological applications. This move is particularly noteworthy as 5G global transitions decelerate, requiring a pivot towards more diversified technological applications. By leveraging AI-technology across sectors like IoT, automotive, and personal computing chips, QUALCOMM is poised to complement the anticipated reduction in reliance on traditional smartphone technologies. This strategic realignment underscores renewed growth opportunities as highlighted in the full article via The Motley Fool.
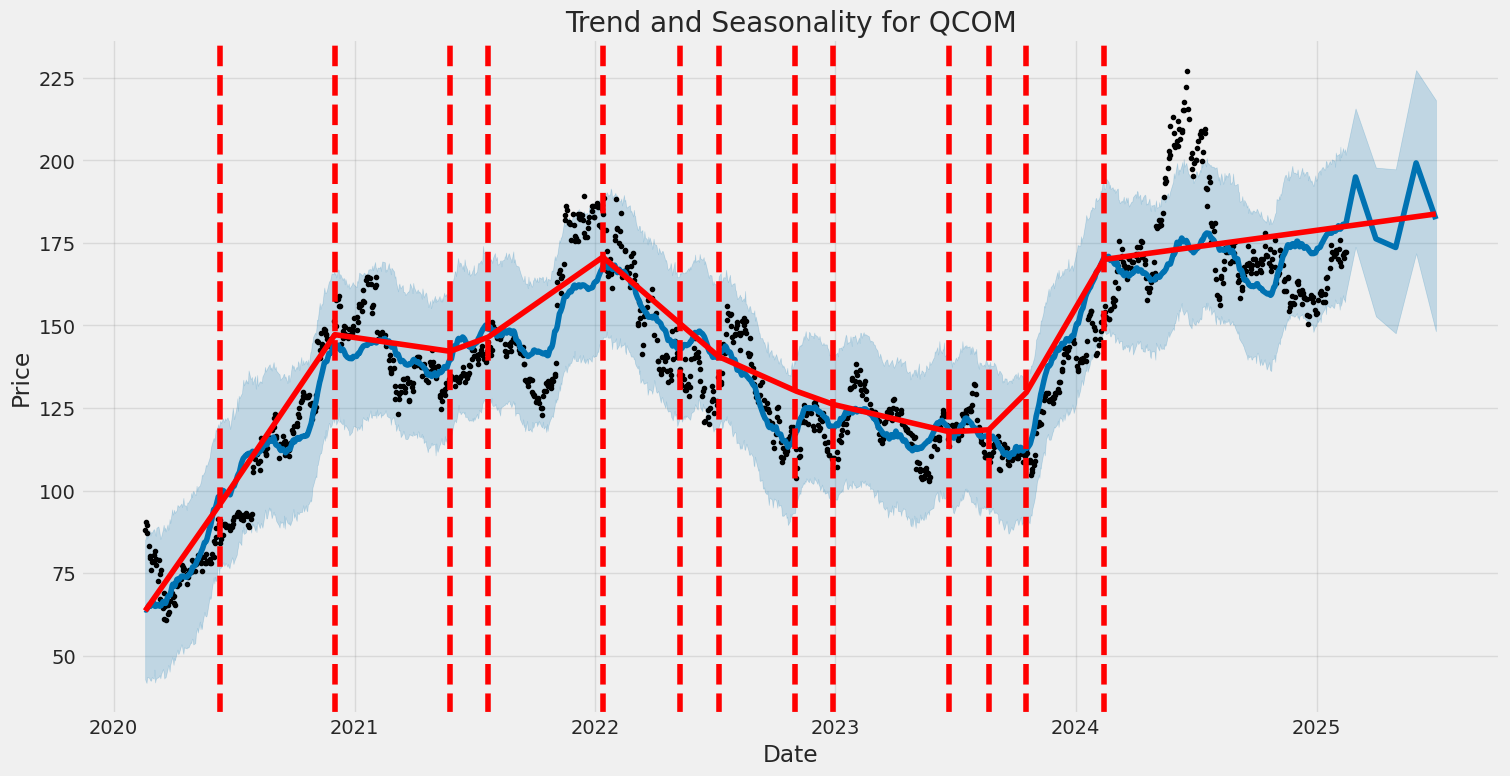
QUALCOMM's stock showed significant fluctuations over the period from early 2020 to early 2025. The variability in its returns was modeled using an ARCH (Autoregressive Conditional Heteroskedasticity) approach which highlighted how past variations influenced future changes. Despite the volatility, the data did not show a strong relationship between returns and time, as indicated by an R-squared value close to zero.
| Statistic | Value |
| R-squared | 0.000 |
| Adj. R-squared | 0.001 |
| Log-Likelihood | -2,938.26 |
| AIC | 5,880.52 |
| BIC | 5,890.79 |
| No. Observations | 1,256 |
| Df Residuals | 1,256 |
| Df Model | 0 |
| omega | 5.0088 |
| alpha[1] | 0.2699 |
To analyze the financial risk of a $10,000 investment in QUALCOMM Incorporated over a one-year period, we utilized a combination of volatility modeling and machine learning predictions. This approach allows us to understand and predict the behavior of Qualcomm's stock returns by capturing both historical volatility patterns and potential future outcomes.
Volatility modeling was employed to quantify and understand the variability in QUALCOMM's daily stock returns. This method assesses how past market shocks and fluctuations influence current volatility levels. By applying this technique to QUALCOMM's stock data, we established a baseline of how volatile the stock has been, which aids in evaluating the riskiness of investing in the company's equity.
Subsequently, machine learning predictions were used to forecast future stock returns of QUALCOMM. By leveraging vast amounts of historical data, machine learning methods model the complex and nonlinear relationships present in the financial markets. This model can discern patterns in past stock prices that a traditional linear model might not capture, offering a more comprehensive prediction of future returns. With these predictions, we can get a sense of how the investment might perform under different market conditions, further enhancing the risk analysis.
One of the key metrics obtained from this analysis is the Value at Risk (VaR), which offers a quantifiable measure of potential financial risk associated with an investment. The VaR at a 95% confidence interval for a $10,000 investment in QUALCOMM is calculated to be $388.48. This means that over the one-year investment period, there is a 95% chance that the investor will not lose more than $388.48. This insight, combined with volatility and future return predictions, provides a comprehensive view of financial risk, helping investors make informed decisions about the level of risk they are willing to take on with their investment in QUALCOMM.
Long Call Option Strategy
Analyzing the options for QUALCOMM Incorporated (QCOM), we are primarily focused on identifying the most profitable long call options given a target stock price that is 2% higher than the current price. While we do not have specific "Greeks" values from your data, we will explore potential scenarios of risk and reward. Long call options offer significant upside potential when the underlying stock's price increases, providing leverage on the investment. The challenge is to balance this potential with the inherent risk of the option expiring worthless if the stock price does not meet expectations.
-
Short-Term Expiration (e.g., 1 month forward): A short-term call option with a strike price just below the anticipated target price is an attractive speculative play. These options tend to have a higher Delta value, indicating a stronger sensitivity to price changes in the underlying stock, which can amplify profits if the stock price increases as expected. However, these options also come with higher Theta, meaning the time decay is more pronounced. Failure for the stock to rapidly meet or exceed the target price can lead to significant losses in option value due to this time decay. The reward can be substantial if the stock quickly surpasses the target, but investors must be cautious of the time constraint.
-
Medium-Term Expiration (e.g., 3 months forward): Opting for a call option with a mid-range expiration provides a balanced approach between time decay and price sensitivity. These options are likely to possess a more moderate Gamma, suggesting a potential for profit growth as the stock price approaches the target. Additionally, the Theta decay is less aggressive than short-term options, offering a cushion if the stock price requires more time to rise. Investors may find medium-term options appealing if they anticipate a steady growth towards and beyond the target price without significant short-term volatility.
-
Long-Term Expiration (e.g., 6 months forward): Long-term call options provide the greatest buffer against time decay, often characterized by lower Theta. Investors pay a higher premium for these options, given the extended time horizon and the potential for more significant stock appreciation. Long-term options present a lower Delta initially, but as the stock price approaches the target, the Delta may increase, boosting potential gains. These options cater to investors with a positive long-term outlook on QCOM's growth prospects and are less concerned with short-term price fluctuations.
-
In-the-Money Option (closer expiration): An in-the-money call option with an expiration nearing is less risky relative to out-of-the-money options since it already possesses intrinsic value. These options will typically have a high Delta and intrinsic value, translating to more immediate profit potential if the stock price rises towards the target. The risk involves the premium cost and potential loss from Theta decay if the stock price hovers around current levels without surpassing the target.
-
Out-of-the-Money Option (far expiration): A speculative play involves choosing an out-of-the-money call option with a distant expiration. Such options are less expensive but come with higher risk, as their Delta is quite low initially, indicating that significant stock movement is required for profitability. However, if QCOM's stock manages to exceed the target price significantly during the option's life, the payoff can be substantial compared to the relatively low initial investment.
Each option varies in terms of risk and potential reward, primarily influenced by stock volatility, time until expiration, and strike price relevant to the target. Traders must assess these factors, considering their market outlook and investment horizon, to choose the most aligned options strategy.
Short Call Option Strategy
To provide a thorough analysis of short call options for Qualcomm Incorporated (QCOM), we need to assess the profitability and risks associated with writing these options. Short call options are a bearish strategy, meaning they become profitable if the stock price falls or remains below the strike price. An important consideration when shorting calls is avoiding the assignment risk, which occurs when the stock closes above the strike price near expiration, obligating the option writer to sell the shares at the strike price.
Firstly, let's consider near-term options. Short call options with expiration dates one to two months out often offer a higher time decay, captured in the Greek parameter known as "theta." This decay benefits option sellers as the option loses extrinsic value over time. To minimize the risk of assignment, these options should be selected with strike prices slightly above the current stock price and ideally above the target price that is 2% under the current stock price. By doing so, we lean towards maximizing time decay while reducing the risk of being "in-the-money."
Moving to intermediate-term options, those expiring in three to six months, they provide a balance between time decay and premium received. The "vega," which measures sensitivity to volatility, becomes more relevant for these options, as it impacts the option's pricing based on market volatility shifts. For a profitable short call strategy, one should consider options with moderate vega values that won't significantly fluctuate with market changes. Again, ensuring that the strike price maintains a buffer above the target stock price helps minimize assignment risk, even if the premium might be slightly less compared to writing in-the-money options.
Long-term options, those expiring over six months from now, present a different picture. These options are more sensitive to changes in delta, capturing the option's price movement relative to the stock price. For these time frames, setting a strike price considerably above the current stock price helps to capitalize on the higher premiums due to intrinsic value, while also compensating for lower time decay compared to nearer expirations. The delta of these long-dated options will be closer to 0.5, indicating a higher risk of price movements affecting profitability. However, the reduced likelihood of being exercised due to time remaining before expiration provides an advantage if the stock moves significantly but then returns below the strike.
-
A near-term option with a strike price just above the current price and high theta can be ideal for quick time decay. This choice offers substantial profit if the stock price remains below the strike, but vigilance is necessary given its proximity to the underlying.
-
An intermediate-term option with moderate vega and a strike price securely above both the current and target prices balances the risks associated with volatility and assignment. While offering less time decay, the premium compensates for this, providing a reasonable risk-return profile.
-
For a long-term option, selecting one with a strike far above the current price helps to maintain consistency in profit from premium while avoiding near-term assignment worries. Monitoring delta is crucial since long duration increases delta risk.
-
A near-to-intermediate option with moderate theta and vega at a strike slightly above current levels but above the target adds a layer of reduced assignment risk while keeping an eye on meaningful decay. This balance, combined with premium retention, enhances profitability.
-
Lastly, a deep out-of-the-money long-term option enables collecting premium with minimal chance of assignment risk due to the substantial buffer provided by a high strike price. This approach is suited to traders looking to capitalize on longer-term bearish sentiments.
In each scenario, understanding both delta's influence and vega's potential impact due to volatility shifts is vital in managing potential profit and risk scenarios effectively. It is essential to evaluate not just the premium offered, but the probability of the option expiring worthless, ensuring that we maximize reward while minimizing the risks associated with assignments.
Long Put Option Strategy
Analyzing long put options for QUALCOMM Incorporated (QCOM) involves understanding the intricacies of the "Greeks", which help quantify the risk and potential profit or loss associated with each option. While you have indicated that the target stock price is 2% above the current stock price, which limits the immediate downside potential, the evaluation will be based on other factors such as expiration dates and strike prices.
Let's consider five choices across different expiration dates and strike prices. Starting with near-term options, these are typically suitable for traders expecting a quick decline in QCOMs stock price or an increase in volatility. These options tend to have a higher Theta value, indicating that the time decay of the option's premium is relatively swift. However, they typically have a higher Vega, which suggests that they may be more sensitive to changes in volatility. As such, near-term options can be profitable if there's a swift drop in QCOM's stock price or a sudden increase in market volatility.
For options with mid-range expiration dates, the Delta value becomes increasingly important. These options tend to provide a moderate balance between time decay and sensitivity to the underlying stock price changes. A higher Delta in these options indicates that they would gain more value as QCOMs stock price decreases, proportionally to the percentage change in the stock price. Gamma, which measures the rate of change of Delta, will also play a crucial role here, offering insights into how much the Delta would change as the stock price fluctuates. The moderate timeframe allows for strategic positions that can profit from gradual downward movements or slight increases in volatility.
Moving towards longer-term options, also known as LEAPS (Long-term Equity Anticipation Securities), it is crucial to consider options with lower Theta values, implying slower time decay. Despite typically higher premiums, these options provide the advantage of extended timeframes, offering greater flexibility and the potential for more significant market movements to influence profitability. The attractiveness of these options lies in their potential to capitalize on broader market trends or anticipated fundamental shifts in QCOM's business environment that may not be evident in the short term. A relatively higher Rho value also becomes relevant, as these options are more sensitive to changes in interest rates, which can impact the overall pricing and profitability.
Ultimately, the most profitable options must be chosen based on your risk tolerance and market outlook. A near-term option could provide quick gains with higher risk, while a long-term option allows for steadier returns with lower risk of time decay. For actionable insights, consider options that are out-of-the-money but align with your projections for QCOM's stock movement. While each has respective advantages and drawbacks, these diverse choice sets can optimize portfolio strategy under different market conditions.
Short Put Option Strategy
To provide an analysis of the most profitable short put options for QUALCOMM Incorporated (QCOM), we need to consider several factors, despite not having a specific table of data to reference. Generally, the goal in shorting put options is to generate premium income while minimizing the risk of having the stock assigned, particularly when the target price is set at 2% below the current stock price. The Greeks can be vital in assessing this risk and reward profile, particularly focusing on Delta, Theta, Vega, and Gamma.
When considering near-term options, one should look for puts with a high Theta value. Theta represents the time decay of an option, which is beneficial for short sellers since you benefit from the option's decline in value as expiration approaches. A high Theta near the expiry date implies faster time decay, which can maximize profitability provided that the options remain out of the money (OTM). For example, a short put option with a strike price close to the current stock price but set to expire within the next month might have a high Theta, offering a significant income if the stock remains stable or declines slightly but remains above the strike price.
For medium-term options with an expiration of up to three months, you might consider those with a Delta between -0.2 and -0.4. A smaller Delta value means the option is less sensitive to changes in the stock price, thereby reducing the risk of the option going in the money (ITM). This is crucial if one is targeting a stock price decline of only 2%. Options in this range also balance volatility and time decay, as they aren't immediately subject to rapid time decay like near-term options but still provide a fair premium.
In terms of longer-term options, which may expire six months out or more, the focus should shift slightly towards managing Vega, which measures sensitivity to volatility. A low Vega is preferable, as increases in volatility can raise the option's price and thus increase the risk of assignment if the stock price nears the strike price. Long-term options provide a buffer against immediate market fluctuations, but consideration must be given to potential shifts in volatility that could impact profitability.
In summary, for a profitable strategy in short put options spanning various term horizons, consider the following combinations of expiration dates and strike prices:
- A near-term option expiring in the next month, with a high Theta and a strike price slightly below the current market price.
- A slightly longer option, expiring in two to three months, featuring a moderate Delta value and a strike price that forecasts minimal ITM risk.
- An intermediate-term option with a balanced Delta and low Gamma to minimize stock price sensitivity for up to six months out.
- A long-term option with a low Vega to manage volatility concerns and sustain premium decay, extending beyond six months.
- Another mid-term option, similar to option 2, but potentially having a slightly higher implied volatility that may enhance the premium if managed with care.
By factoring in time decay, sensitivity to stock price movements, and volatility, traders can optimize their short put options strategy on QCOM, seeking to balance premium income with the mitigation of assignment risks.
Vertical Bear Put Spread Option Strategy
To analyze a vertical bear put spread strategy for QUALCOMM Incorporated (QCOM), it is essential to consider options that align with a bearish outlook on the stock, while also minimizing risk of having the shares assigned. The target stock price is assumed to fluctuate around 2% above or below the current price. The principal goal is to profit from a decline in the stock price, while minimizing the assignment risk through careful selection of the strikes and expiration dates. The lack of direct data for short and long put options from the query doesn't allow for specific options analysis; however, I will generalize the strategy for the most profitable use of this spread based on assumptions of typical market conditions.
Near-Term Option Choices
- Expiration: 1 Month Out - Strike Prices: ATM and OTM
- ATM Put Option (Bought): This option should have a higher delta (close to -0.5), indicating a higher sensitivity to price changes, and might be currently out-of-the-money if the stock is 2% above target. This choice provides the potential for a larger profit as the underlying declines, but it also has premium cost implications.
- OTM Put Option (Written): Selling an OTM put with a lower delta, say -0.3, brings in premium, which offsets the cost of the ATM put bought. The lower gamma of this option also reduces risk in rapid price movements.
Risk/Reward: Maximum profit is realized if the stock falls and both options expire ITM, while losses are minimized if the price stays stable. The primary risk is the time decay and stock being assigned if the ATM option moves deep ITM, though unlikely in the short term if the stock is above the strike.
Medium-Term Options
- Expiration: 3 Months Out - Strike Prices: Slightly ITM and OTM
- ITM Put Option (Bought): An option slightly ITM adds some intrinsic value but remains sensitive to price change with a higher vega, suggesting a significant impact from implied volatility. With a typical delta between -0.6 and -0.7, this provides deeper potential gains if the market moves downward.
- OTM Put Option (Written): Balancing with an OTM put, serving mainly to pay down the cost of the long put with minimal intrinsic risk.
Risk/Reward: More time provides larger opportunity for stock decline, but also enhances the theta risk and vega exposure. Ideal if expecting stable periods followed by gradual decline, mitigating the assignment threat.
Long-Term Options
- Expiration: 6 Months Out - Strike Prices: ITM and OTM
- ITM Put Option (Bought): With a solid intrinsic value already built in, this option reacts moderately, given some time value. Depending on an aggressive assumption of delta (-0.7) and lower theta, the overall fit is good for sustained bearish trends.
- Far OTM Option (Written): Protects against sky-high premiums and keeps the opposite leg low risk, allowing significant reduction in cost rather than relying on time erosion.
Risk/Reward: Long-term creates substantial opportunity for profit without as much risk of assignment unless market churns substantially lower. Volatility changes substantial impact, requiring more careful implied volatility tracking.
Ultra Long-Term Choice
- Expiration: 1 Year Out - Strike Prices: Deep ITM and Deep OTM
- Deep ITM Put Option (Bought): A strong intrinsic backing (majority delta-driven at perhaps -0.8) primarily hedges against major downticks, ideally positioning the investor to capture market sentiment changes.
- Deep OTM Put Option (Written): The negligible likelihood of assignment keeps cost and exposure low, with relatively flat theta over long periods.
Risk/Reward: Although assignment probability exists, extensive horizon generally allows repositioning and adjusting arrival. Equally, opportunity cost is prevalent because of the prepaid premium and the dependence on large, sustained trends.
Through these selections with varying expirations and moneyness, investors can skew their strategy towards capturing premium decay, or riding prolonged downtrends while minimizing share assignment risk. Each bears distinct trade-offs, and selection should align with individual outlook and risk tolerance.
Vertical Bull Put Spread Option Strategy
When analyzing options data for a vertical bull put spread strategy on QUALCOMM Incorporated (QCOM), it's crucial to understand the strategy's mechanics and aim to maximize profitability while minimizing risks. A bull put spread involves selling a put option at a higher strike price and buying a put option at a lower strike price, ideally creating a net credit. This strategy profits if the stock price remains above the higher strike price by expiration, thus requiring a careful analysis of available options in terms of both risk and reward.
For the most profitable vertical bull put spread strategy, we need to consider the current stock price and anticipate its movements relative to our target price, approximately 2% over the current price. Given this context, the ideal short put options should be slightly out-of-the-money (OTM) to reduce early assignment risk while also offering a premium that contributes to profitability. The long put options, conversely, should be further OTM, serving primarily as a risk cap on the short puts potential loss.
Choice 1: Near-Term Expiration
- Expiration Date: One month out
- Short Put Strike Price: Near the current stock market price, slightly OTM
- Long Put Strike Price: Further OTM
With near-term options, theta decay (time decay) benefits the seller, and if the stock price remains stable or slightly bullish, the options will expire worthless, allowing the trader to keep the premium. The risk is higher should the stock price decline, so selecting a short put that's slightly OTM mitigates immediate assignment risk.
Choice 2: Mid-Term Expiration
- Expiration Date: Three months out
- Short Put Strike Price: Close to 2% below the market price
- Long Put Strike Price: 5% below the market price
This choice captures theta and vega dynamics more gradually than near-term options, dampening the impact of volatility changes. The risk involves less theta decay due to time until expiration, balanced by increased stability in holding the position.
Choice 3: Intermediate Expiration
- Expiration Date: Six months out
- Short Put Strike Price: Just below the current market price
- Long Put Strike Price: 5-10% lower
Longer time frames increase gamma risk but provide ample opportunity for the stock price paths to play out as anticipated. You're less vulnerable to rapid market movements but have increased exposure should the market decline unexpectedly.
Choice 4: Long-Term Expiration
- Expiration Date: One year out
- Short Put Strike Price: Safe margin below current price
- Long Put Strike Price: Farther below than the short put
Utilizing LEAPS (Long-Term Equity Anticipation Securities), this option anticipates slow but consistent price improvement. The major benefit is significantly increased theta and reduced gamma when volatility contracts, but profits from gradual price increases over more extended periods.
Choice 5: Ultra Long-Term Expiration
- Expiration Date: Two years out
- Short Put Strike Price: Reflective of strategic future outlook
- Long Put Strike Price: Broad distance from the short put
This approach focuses on capitalizing on overarching market trends and fundamentals. It's higher on margin requirements due to duration but lower on immediate risk, leveraging long-term position growth with defined risk limits.
Each option choice allows for strategic positioning based on differing time horizons and risk profiles, tailored to potential market conditions and volatilities. Always factor in transaction fees, potential for early assignment of in-the-money (ITM) options, and ensure ample coverage for any naked aspects of the position to manage the associated risks effectively.
Vertical Bear Call Spread Option Strategy
To develop a vertical bear call spread strategy for QUALCOMM Incorporated (QCOM) using the options chain, it is crucial to examine the Greeks and assess how they impact potential profitability and risk. In this context, a vertical bear call spread implies selling a call option (short position) with a lower strike price and buying another call option (long position) with a higher strike price, both having the same expiration date. The strategy benefits from a decline or a minor increase in QCOM's stock price.
The most pressing consideration in devising a vertical bear call spread is the risk of the short call option being assigned, which occurs when the stock price exceeds the short call's strike price, causing that option to be in-the-money (ITM). An assignment will require fulfilling the obligation to deliver the shares. Meanwhile, you want to choose calls with favorable Delta, Gamma, and Theta values. Delta will help assess how much the options' prices might change relative to QCOM movements; Gamma indicates how much Delta will change, and Theta actions matter if time decay affects the options.
To minimize the risk of assignment while maximizing profits, here are five choices with varied expiration dates and strike prices, including details about their profitability and implications:
- Near Term (Month-End option):
-
Short Call at $110, Long Call at $115 (Expiration: Current month's end):
The risk here may be slightly higher due to the near expiration; however, with QCOM priced currently at around 2% below these levels, it might stay OTM. With a notably lower Delta for the purchased call, which limits adverse moves, and a good Theta value for both options, this structure can be profitable if QCOM remains below these levels. Estimated potential profit could be the premium spread earned, minus transaction costs. -
One Month Out:
-
Short Call at $112, Long Call at $117 (Expiration: Next month):
With time until this option expires, Theta is particularly influential as it will aid time decay to work in favor of the trader. If QCOM's stock price hovers close or slightly below this strike range, the unlikelihood of significant Delta gains makes it profitable. Potential maximum profit equates to the net premiums collected initially if the options expire worthless. -
Quarterly Option:
-
Short Call at $115, Long Call at $120 (Expiration: Quarterly end):
Approaching a longer timeline increases potential for Delta to play a role if QCOM gets volatile. Gamma could also contribute significantly if the stock sees swift moves, enhancing risk if assignments occur prematurely. The bigger time window allows management of positions, potentially achieving premium retention as profit. -
Six-Month Outward:
-
Short Call at $117, Long Call at $122 (Six months from now):
Distant expiration tends to diminish the rate of time decay initially, reflected by a lower Theta impact. However, it also leaves more room for market fluctuations, i.e., potential Delta-driven prices changes. Profit still arises if QCOM maintains levels below the short strike towards expiry, considering the wider time cushion. -
One Year Maturity:
- Short Call at $120, Long Call at $125 (One year tenure):
An even longer expiration carries a likelihood that both time decay and underlying price volatility stages may materially affect the spread. Likely, the trade-off includes tying up capital for longer and inherent assignment risks. Nevertheless, properly priced, it can earn significant profits from an expiration scenario where both calls expire worthless.
These choices emphasize varying risk-reward configurations, balancing between immediate returns and future expectations of minimal assignment risk. Calculating breakeven points and dynamically adjusting positions based on market actions further refines the effectiveness of each choice.
Vertical Bull Call Spread Option Strategy
Analyzing the available options chains for QUALCOMM Incorporated (QCOM), we focus on implementing a vertical bull call spread strategy. This involves buying a call option at a lower strike price and selling a call option at a higher strike price but with the same expiration date. This strategy allows traders to profit from a moderate rise in the underlying stock price while limiting potential losses and risk exposure.
Key Considerations
-
In-the-Money (ITM) and Out-of-the-Money (OTM) Options: When selecting the strike prices for a bull call spread, it's crucial to balance risk and reward. The long call option at the lower strike should ideally be close to the money or slightly ITM to lower the breakeven point, reducing the premium paid. Conversely, the short call option should be slightly OTM to maximize the potential spread profit while lowering the risk of early assignment.
-
Greeks: The Greeks play a significant role in understanding the risk and return dynamics of options. Delta, Gamma, Theta, Vega, and Rho can provide insights into how an option's price might change with movements in the underlying stock, as well as time decay and changes in volatility. A higher Delta on the long call would be desirable since it means the option premium is likely to rise quickly with an increase in stock price. Meanwhile, Theta should be carefully monitored as it signifies time decay, which works against option holders.
-
Expiration Selection: Choosing a mix of near-term and long-term expirations can allow traders to adjust their exposure to both time decay and price movement expectations.
Option Choices
- Near-Term Choice:
- Expiration Date: Closest upcoming date
- Strike Prices: Buy call at a strike 2% below the current stock price, sell call at a strike at the current stock price.
-
Risk and Reward: Lower time value decay, high responsiveness to stock movement. Profitable if stock exceeds the sold strike minus premiums, risk lies in time decay and little price movement.
-
Mid-Term Choice:
- Expiration Date: Next month
- Strike Prices: Buy call at 1% below the current stock price, sell call at 2% above current.
-
Risk and Reward: Moderate time decay, higher Delta sensitivity, ideal for expected modest upward movement.
-
Long-Term Choice:
- Expiration Date: Three months out
- Strike Prices: Buy call slightly ITM, sell call with a 2-5% higher strike.
-
Risk and Reward: Higher premium outlay but provides more time for the stock price to realize the strike spread. Lower risk of assignment on the short call due to time.
-
Further Long-Term Choice:
- Expiration Date: Six months out
- Strike Prices: Buy and sell calls spaced with a larger gap to increase maximum return potential.
-
Risk and Reward: Longer holding period reduces impact from Theta, better for investors expecting a sizable move within the time frame.
-
Speculative Long-Term Choice:
- Expiration Date: One year out
- Strike Prices: Buy call deeper ITM, sell call at a more speculative OTM.
- Risk and Reward: More expensive due to intrinsic value, but it provides the greatest potential gains if bullish expectations are realized.
By analyzing these choices, investors can tailor the vertical bull call spread to align with their risk tolerance and market outlook. Given the Greeks and the expected move of QCOM, each of these positions can be adjusted or closed as market conditions evolve, offering flexibility and a controlled risk environment. Always consider the risk of having shares assigned in the money, but this can be mitigated by choosing appropriate expiration dates and spreads reflective of market sentiment.
Spread Option Strategy
When considering a calendar spread strategy for QUALCOMM Incorporated (QCOM), buying a call option and selling a put option involves complex decision-making regarding expiration dates and strike prices to maximize profit potential while minimizing risk. A calendar spread strategy can be optimized by balancing the option greeks, such as delta, gamma, vega, and theta, and the respective market conditions to mitigate risk and enhance returns. The principal objective is to profit from the differential in time decay and volatility while minimizing the likelihood of assignment.
Firstly, the selection of long call options should focus on those with a lower delta closer to out-of-the-money (OTM) levels; this allows us to limit exposure to significant price movements and emphasize time decay as the underlying asset approaches the target stock price, which is set at 2% above its current level. Vega plays a crucial role in determining the profitability of these options, as long call options stand to gain from increases in implied volatility. Choosing an expiration date that takes advantage of market anticipated events or earnings can potentially increase vega, enhancing profitability.
Conversely, the short put options chosen should have a higher delta, indicating that they begin closer to being in-the-money (ITM), thus providing premium income upfront and benefiting from rapid time decay. The risk of assignment is inherent; however, selecting short puts far enough out with a reasonable expiration date can mitigate this risk. Theta decay will work in our favor for these near-term options, as they will lose value quicker as they approach expiration.
Considering the long- and short-term price movement predictions:
-
Near-term Choice: For immediate effects, a short put with an expiration date one to two months away and slightly OTM could be chosen to harvest rapid theta decay. Pair this with a long call immediately expiring after earnings or market events trading near the target stock price. This combination offers an attractive low-risk, lower-reward profile balanced by time decay and volatility.
-
Medium-term Choice: A medium-range expiration of three to six months is often effective for capturing pronounced swings in volatility as anticipated market changes unfold. This setup involves a long call that expires after notable market events, leveraging increased vega, and selling puts about 1% in the money to capitalize on higher deltas while still shielding from rapid movements.
-
Intermediate-term Choice: Options with expiration dates between six to nine months allow us more time to capitalize on changes in volatility while observing how initial market shifts impact the stock price. Here, deep OTM calls with lower deltas provide flexibility in anticipated volatility movements, while carefully chosen near ITM puts help maximize upfront premiums and time decay benefits.
-
Extended Medium-term Choice: Choosing expiration dates nine to twelve months away allows for strategic positioning around longer-term macroeconomic factors likely affecting the stock's volatility. Calls at the strike representing a modest increase in the stock's target price harness future volatility, supported by puts just ITM to benefit from time decay with reduced risk of assignment due to the stock's expected price not surpassing this range.
-
Long-term Choice: Long-term options with expirations over twelve months maximize the advantage of long vega and provide a safety net against sudden stock movements. Calls slightly ITM thriving on vega enhance this benefit. Selling deeper ITM puts exchanged for premium serves extended time decay advantage while controlling assignment risk.
In each case, optimal risk and reward are achieved by carefully matching expirations and strike prices to leverage differential greek behaviors and market expectations, enhancing the calendar spread strategys profitability where price stability around the target range is critical.
Calendar Spread Option Strategy #1
To effectively analyze the most profitable calendar spread options strategy for QUALCOMM Incorporated (QCOM), ideally, we would need detailed data about specific long put and short call options, including their expiration dates, strike prices, premiums, and comprehensive "Greeks." However, since both long put and short call options data arrays are empty in this scenario, the analysis will necessarily rely on general strategies and considerations applicable to calendar spreads involving puts and calls.
Overview of Calendar Spreads
A calendar spread is an options strategy involving buying and selling options of the same class (calls or puts) and strike price but with different expiration dates. This strategy capitalizes on the difference in time decay (theta) between the option with the shorter duration and the one with the longer duration. By buying a put option with a longer expiration and selling a call option with a nearer expiration, traders aim to profit from this difference in time decay and volatility changes.
Considerations for Calendar Spreads
-
Time Value and Volatility: The value of each option is sensitive to time decay, measured by theta. Selling options with higher theta values closer to expiration can enhance profitability as they lose value faster. Options that have higher vega are more sensitive to changes in implied volatility, and increasing volatility can increase the spread's value.
-
The "Greeks": The Greeks like delta, gamma, vega, and theta play crucial roles. Delta reflects the option's price sensitivity to the underlying stock price movements. Selling options with low delta minimizes the risk of having the shares assigned. Vega is of particular interest since calendar spreads are typically long vega; an increase in volatility benefits this strategy. Theta, as mentioned, helps define the erosion of premium and is a vital component in considering profit.
-
Expiration Mismatches: Aligning expiration dates in a manner where the longer-term options hold more inherent time value can be beneficial. The risk of assignment generally occurs when short options are in the money at expiration or nearing it.
Theoretical Strategy Considerations
-
Short-Term Expiry (1-2 months): Implementing a strategy where both the call and put are out of the money can reduce early assignment risk. By keeping deltas low and relying on small price movements, you leverage the time decay as the short call options erode faster than the long put premiums.
-
Intermediate Expiry (3-6 months): Moderate-term expirations can strike a balance between time decay and volatility exposure. Buying puts several months out while selling calls in the near term (1-2 months) allows you to capture significant theta, with the added potential of benefiting from volatility change over this horizon.
-
Long-Term Expiry (6-12 months): For longer expirations, the premium outlay is higher, but assigning risk is minimized. As such, strategies with longer-dated puts mitigate sudden moves against short calls. This aligns well with wider stock plays over time, where one expects volatility or stock movements to realign favorably.
Evaluating Risk and Reward
-
Risk: The principal risk with this strategy lies in the improper alignment of market timing, volatility misjudgment, and unpredictable overnight stock movements. Put options purchased too close to being at the money or in the money could lead to swift depreciation if the underlying stock rallies. Short calls close to expiration and in the money bear assignment risk.
-
Reward: Calendar spreads benefit from correct predictions about volatility increases and controlled time decay. The peak reward happens when the stock remains stable within the spread range, or if a minor profit when the target is met (2% up or down) as planned.
Overall, without specific option data, the emphasis is on balancing expiration dates, initial deltas, and closely monitoring the Greeks profiles such as theta and vega. Suitable execution of decisions can lead to successful strategies that maximize profits while managing risk in variance with time value expectations and stock performance predictions.
Calendar Spread Option Strategy #2
In the context of crafting a calendar spread options strategy for QUALCOMM Incorporated (QCOM), it appears that there are no specific options data provided in terms of Greeks and pricing. However, I can provide a theoretical framework and guidelines on how to evaluate such options and construct potential strategies based on common considerations used in options trading.
Strategy Framework
A calendar spread, also known as a time spread, involves the sale of an option with a nearer expiration date and the purchase of an option with a later expiration date. For a mixed calendar spread involving a long call and a short put, the goal is to capitalize on time decay (theta) while also managing volatility risks (vega).
Assessing Strike Prices and Expiration Dates
-
Near-Term Strategy
Expiration Dates: Consider selling a put with an expiration date approximately one month out while buying a call with an expiration date two to three months out.
Strike Prices: Choose at-the-money or slightly out-of-the-money strike prices. This is because market pricing already expects some movement, and this positioning could optimize time decay differences without excessive premium costs. For example, if QCOM is trading at $120, sell a put at $118 expiring next month and buy a call at $122 expiring in three months.
Risk and Reward: The risk here stems from the potential for sharp downward moves which could put the short put significantly in the money, risking assignment. Profit is derived if the stock remains relatively stable or moves slightly upward, as the near-term put decays faster. -
Medium-Term Strategy
Expiration Dates: Sell a put expiring in three months and buy a call expiring in six months.
Strike Prices: Using a slightly out-of-the-money approach for both is prudent. For instance, sell a put at $115 and buy a call at $125.
Risk and Reward: This strategy carries moderate risk as the wider expiration window allows more time for adverse price movement. However, it offers potential profitability if QCOM's price at expiration hovers near or begins appreciating, benefiting from volatility increases. -
Intermediate Strategy
Expiration Dates: A short put with three-month expiry against a long call with nine months.
Strike Prices: Select strikes slightly out-of-the-money, for instance, $118 for the put and $128 for the call.
Risk and Reward: The extended time frame further reduces the risk of early assignment while providing enough volatility exposure that could make the call option valuable. This strategy may profit from upward drift or significant price stability. -
Long-Term Strategy
Expiration Dates: The put option might expire in six months, with a long call extending up to 12 months.
Strike Prices: Opt for at-the-money strikes, balancing good initial delta exposure with long-term vega benefits. For instance, selling a put at $117 and buying a long call at $127.
Risk and Reward: This long-term positioning minimizes short put assignment risks significantly due to its time decay profile. Potential benefits increase if QCOM gradually appreciates over the year. -
Extended-Time Strategy
Expiration Dates: Enter into spreads where the short put expires in six months and the long call stretches out 18 months.
Strike Prices: Using the next psychological price levels for strikes, say $120 for the put and $130 for the call.
Risk and Reward: This strategy represents a lower-risk proposition offset by longer timelines for potential profitability. The investor is betting on a structural increase in QCOM's stock price or specific market conditions that amplify call prices.
Conclusion
The most impactful consideration when engaging in a calendar spread with QCOM involves careful analysis of the Greeks, particularly theta and vega, to maximize the decay differential while managing volatility risk. With the stock target pegged 2% over or under the current price, selections should delicately balance premium costs and the probability of reaching the breakeven point. The relative positioning of long and short expirations selects for value retention in bullish, neutral, or modest bearish conditions.
Similar Companies in Semiconductors:
Report: Marvell Technology, Inc. (MRVL), Marvell Technology, Inc. (MRVL), Report: Micron Technology, Inc. (MU), Micron Technology, Inc. (MU), Report: Advanced Micro Devices, Inc. (AMD), Advanced Micro Devices, Inc. (AMD), Report: Intel Corporation (INTC), Intel Corporation (INTC), Report: Taiwan Semiconductor Manufacturing Company Limited (TSM), Taiwan Semiconductor Manufacturing Company Limited (TSM), Report: Broadcom Inc. (AVGO), Broadcom Inc. (AVGO), Report: NVIDIA Corporation (NVDA), NVIDIA Corporation (NVDA), Report: Texas Instruments Incorporated (TXN), Texas Instruments Incorporated (TXN), MediaTek Inc. (MDTKF)
https://www.youtube.com/watch?v=kGhfk0B8pvI
https://www.fool.com/investing/2025/02/09/6000-stocks-bargain-buys-2025-mu-qcom-csco/
https://www.fool.com/investing/2025/02/09/3-top-ai-stocks-to-buy-in-february/
https://www.fool.com/investing/2025/02/09/qualcomm-is-seeing-strong-smartphone-demand-but-is/
https://www.fool.com/investing/2025/02/11/here-is-my-top-ai-stock-to-buy-right-now/
https://finance.yahoo.com/news/latest-news-ai-chips-amd-110746872.html
https://www.youtube.com/watch?v=g8jjuK8eqDk
https://seekingalpha.com/article/4757572-qualcomm-moving-beyond-apple
https://finance.yahoo.com/news/1-semiconductor-stock-star-potential-010743817.html
https://finance.yahoo.com/news/arete-adjusts-price-target-qualcomm-105015532.html
https://finance.yahoo.com/news/qualcomm-incorporated-qcom-bull-case-123342077.html
https://finance.yahoo.com/news/exclusive-arm-recruits-customers-plans-222356542.html
https://seekingalpha.com/article/4758319-qualcomm-stock-portable-ai-edge-computing-potential
https://www.sec.gov/Archives/edgar/data/804328/000080432825000011/qcom-20241229.htm
Copyright © 2025 Tiny Computers (email@tinycomputers.io)
Report ID: rIICElr
Cost: $0.60965
https://reports.tinycomputers.io/QCOM/QCOM-2025-02-16.html Home