United States Steel Corporation (ticker: X)
2025-01-25
 United States Steel Corporation (X) is a prominent player in the American integrated steel manufacturing industry, recognized for its longstanding history and substantial impact on the market. Founded in 1901, the Pittsburgh-based company has established itself as a significant producer of flat-rolled and tubular steel products, catering to diverse sectors, including automotive, construction, and energy. Over the years, U.S. Steel has navigated the evolving landscape of global steel production by investing in modernized facilities and technologies to enhance efficiency and sustainability. The corporation operates major production facilities in the United States, with a strategic focus on innovation, cost leadership, and maintaining environmental responsibility. Despite facing challenges from volatile market conditions and competition, U.S. Steel continues to adapt its strategies to remain competitive and capitalize on growth opportunities within the industry. As such, its financial performance and strategic initiatives remain central to its efforts to deliver value to shareholders and maintain its role as a leader in the American steel industry.
| Full-Time Employees | 21,803 | Previous Close | 37.09 | Open | 37.3 |
| Day Low | 37.3 | Day High | 37.835 | Dividend Rate | 0.2 |
| Dividend Yield | 0.53% | Payout Ratio | 0.1266 | Five Year Avg Dividend Yield | 0.71% |
| Beta | 1.861 | Trailing PE | 23.677214 | Forward PE | 16.11111 |
| Volume | 3,377,574 | Average Volume | 6,847,520 | Average Volume 10 Days | 7,191,850 |
| Market Cap | 8,423,647,232 | Fifty Two Week Low | 26.92 | Fifty Two Week High | 48.41 |
| Price to Sales TTM | 0.517582 | Fifty Day Average | 35.7692 | Two Hundred Day Average | 37.3984 |
| Book Value | 51.42 | Price to Book | 0.72753793 | Net Income to Common | 393,000,000 |
| Trailing EPS | 1.58 | Forward EPS | 2.65 | Enterprise Value | 11,063,645,184 |
| Total Cash | 1,772,999,936 | Total Debt | 4,320,000,000 | Current Ratio | 1.67 |
| Total Revenue | 16,275,000,320 | Debt to Equity | 37.015 | Revenue Per Share | 72.559 |
| Return on Assets | 1.021% | Return on Equity | 3.452% | Gross Profits | 1,736,000,000 |
| Sharpe Ratio | -0.4307824182312648 | Sortino Ratio | -6.283670268854587 |
| Treynor Ratio | -0.3267442778697314 | Calmar Ratio | -0.5755093559550168 |
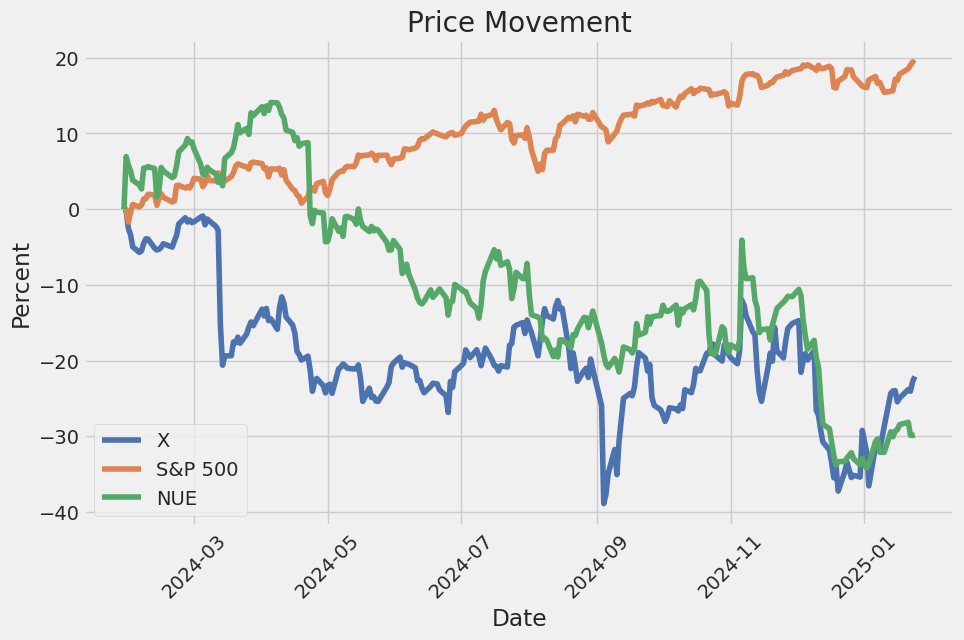
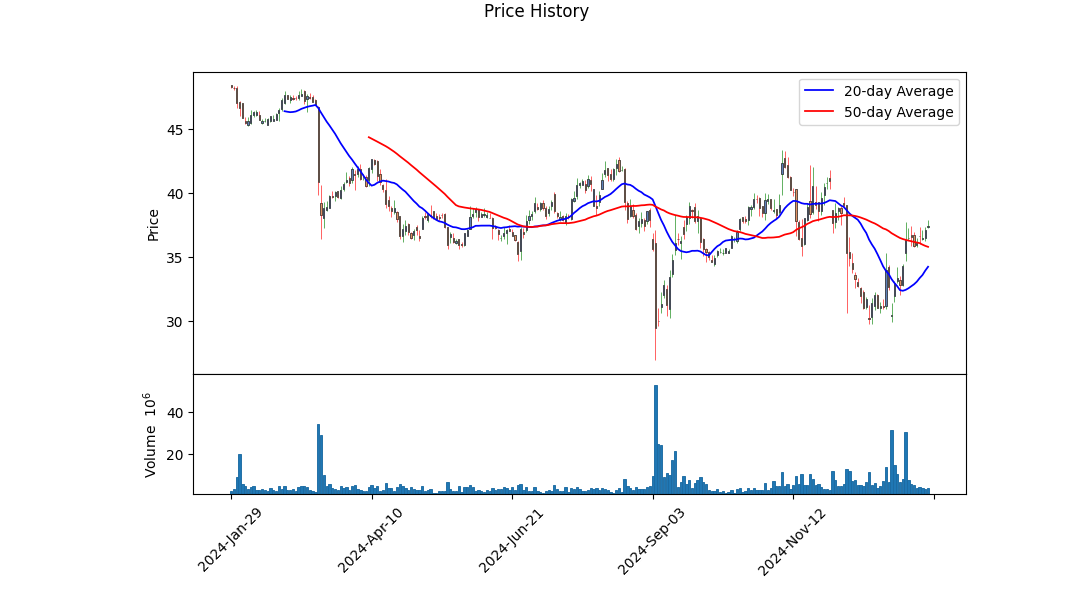
The analysis of the current stock momentum and financial condition of the company "X" indicates a complex situation requiring careful consideration. On the technical front, recent price movements reveal slight fluctuations, with the current price ranging between $35 and $37. Observing the On-Balance Volume (OBV), a pattern of consistent outflows suggests pressure from the sell-side, although the OBV trend is not steeply down, allowing for the possibility of stabilization.
The fundamentals offer a glimpse into the underlying strengths and challenges faced by the company. A noteworthy gross margin of 10.67% and an EBITDA margin of 7.61% reflect an ability to generate a profit over direct costs, albeit minor, while the operating margin remains slim at 1.79%. These margins suggest a competitive environment demanding efficiency improvements. Financial metrics, such as an Altman Z-score of 2.05, indicate moderate financial health, but below the threshold indicative of high distress levels.
Risk-adjusted performance ratios offer further insight, showing negative values for Sharpe, Sortino, Treynor, and Calmar ratios, indicative of a period of underperformance relative to the ten-year treasury yield, which serves as a risk-free benchmark. These ratios expose vulnerabilities to volatility, losses below expected returns, and sensitivity to market changes, respectively. Such metrics warrant careful monitoring as they suggest that returns, under the current pricing model, may not justify the investment risk taken.
Examining the balance sheet, the company maintains a considerable cash position of $2.94 billion against a significant net debt level of $1.27 billion. This liquidity offers some cushion, yet the firm's substantial capital expenditures ($2.58 billion) and free cash flow figures reveal ongoing investment and operational costs outpacing income generation. Debt issuance has moderately supported cash flows rather than organic revenue improvements.
The evidence gathered from technical indicators, coupled with underlying fundamentals and risk assessment, suggests a cautious outlook for the next few months. While the potential exists for moderate gains if market dynamics favorably shift, perhaps driven by strategic realignments or overall market improvements, the prevailing indicators signal prudence. Investors might anticipate continued volatility or sideways movement, unless external catalysts or significant internal improvements materialize, enhancing profitability and market sentiment.
In analyzing the financial performance of United States Steel Corporation (X), it is beneficial to consider both the Return on Capital (ROC) and the Earnings Yield as key metrics for evaluating its investment potential, as outlined in "The Little Book That Still Beats the Market." The ROC for United States Steel stands at approximately 6.78%, which offers insight into the company's efficiency in allocating its capital to profitable ventures. This figure suggests that U.S. Steel generates a return of $6.78 for every $100 of capital employed, providing a perspective on the effectiveness of its investments and operational performance. On the other hand, the Earnings Yield, calculated at around 10.80%, reveals the company's profitability relative to its market valuation, offering a substantial indication that it potentially offers more value to investors when compared to its current stock price. A higher Earnings Yield, in this case, signifies that U.S. Steel's earnings contribution per dollar invested in its equity is robust, potentially making it an attractive candidate for value-focused investors. Together, these metrics highlight U.S. Steels capacity to generate value from its capital and present a comprehensive view of its financial health and potential for future growth.
In evaluating United States Steel Corporation (X) through the lens of Benjamin Graham's value investing principles, we can analyze the key financial metrics you've calculated and compare them to Graham's criteria:
-
Price-to-Earnings (P/E) Ratio: United States Steel Corporation has a P/E ratio of 3.74. This is notably low, suggesting that the stock is potentially undervalued compared to the overall market. Graham favored stocks with low P/E ratios, especially those lower than the industry average, to identify undervalued companies. Although you have not provided an industry P/E ratio for comparison, a P/E of 3.74 generally indicates the stock could be a candidate for further consideration under Graham's criteria.
-
Price-to-Book (P/B) Ratio: The P/B ratio for United States Steel is 0.41, which is less than one, suggesting that the company is trading below its book value. According to Graham, purchasing stocks with a P/B ratio below one could provide a margin of safety, as investors are essentially buying the company for less than its net asset value.
-
Debt-to-Equity Ratio: The debt-to-equity ratio stands at 0.39 for United States Steel. This low ratio is in line with Graham's preference for companies with low financial leverage, as it signifies lower financial risk and suggests the company is not overly reliant on debt to finance its operations.
-
Current Ratio and Quick Ratio: Both the current and quick ratios for United States Steel are 1.76. These ratios, which measure a company's ability to cover short-term liabilities with short-term assets, indicate good liquidity and financial stability. Graham emphasized the importance of financial stability in the stocks he selected, and these ratios suggest that United States Steel is in a stable position to manage near-term financial obligations.
Overall, United States Steel Corporation seems to align well with several of Benjamin Graham's value investing principles. Its low P/E and P/B ratios suggest undervaluation, its low debt-to-equity ratio indicates limited financial risk, and its solid liquidity ratios reflect financial stability. These metrics warrant further investigation into the company's intrinsic value, competitive position, and long-term prospects as part of a comprehensive fundamental analysis consistent with Graham's investment philosophy.### Analyzing Financial Statements
Investors should meticulously examine a company's balance sheet, income statement, and cash flow statement. Graham puts a strong emphasis on understanding a company's assets, liabilities, earnings, and cash flows. Below, we delve into the financial data for United States Steel Corp (USS) over several periods to illuminate this analysis process.
This multi-period analysis offers insights into USS's financial standing, neither offering direct investment advice nor projecting future performance.
Balance Sheet Analysis
The balance sheet provides a snapshot of a company's financial condition at a particular moment in time. For USS, we observe the following key metrics as of the latest reporting period (Q3 2024):
-
Assets: Total assets amounted to approximately $20.63 billion. Key components include cash and cash equivalents ($1.77 billion), accounts receivable ($7 million), and property, plant, and equipment (net of depreciation, $11.67 billion). Inventory levels were substantial, highlighting the capital-intensive nature of the steel industry.
-
Liabilities: Total liabilities were about $8.96 billion, with significant portions in current liabilities ($3.45 billion). Long-term debt stood at $4.07 billion, reflecting financing activities and investment in growth and modernization.
-
Equity: Stockholders' equity was $11.58 billion, suggesting a robust equity foundation, essential for financial stability and attracting further capital. Accumulated other comprehensive income highlights changes in equity not captured by net income.
Income Statement Analysis
The income statement details USS's revenue generation and expense distribution over a specific period.
-
Revenues: As reported for Q3 2024, revenues were $12.13 billion, demonstrating the firm's potential to generate significant cash inflow from core operations.
-
Expenses: The cost of goods sold was notably substantial, reflecting raw material and operational costs in steel manufacturing. Selling, general, and administrative expenses were $328 million, affecting net operational efficiency.
-
Net Income: USS reported a net income of $473 million for the period. While positive earnings suggest profitability, investors should consider earnings sustainability amid market fluctuations and industry cyclicality.
Cash Flow Analysis
The cash flow statement provides insights into USS's liquidity and cash generation capabilities from operating, investing, and financing activities.
-
Operating Activities: Net cash provided by operating activities was $711 million for Q3 2024. This indicates effective cash generation from operations, vital for ongoing business viability.
-
Investing Activities: USS reported significant capital expenditure of $1.78 billion, aligning with industry expectations due to the capital-intensive nature of business expansion and technological upgrades.
-
Financing Activities: Cash used in financing activities indicates a net outflow of $104 million, primarily for debt repayments and other financing obligations, affecting leverage ratios and capital structure.
Key Observations and Considerations
-
CapEx and Debt Management: USSs significant capital investments and managing debt are crucial. The firms long-term debt level and investing outflows suggest strategic expansion efforts balanced with caution regarding leverage and interest obligations.
-
Profitability and Efficiency: The continuum of USS's profitability is contingent upon operational efficiency improvements and market conditions, such as demand cycles, raw material prices, and tariff implications.
-
Liquidity and Solvency: Current and quick ratios derived from balance sheet figures help assess USSs short-term liabilities coverage by current assets, affecting the firm's financial flexibility.
In conclusion, when analyzing United States Steel Corp or similar entities, investors should utilize these primary financial statements in conjunction with market trends, economic forecasts, and sector-specific analyses to inform comprehensive investment decisions.# Dividend Record
Graham favored companies with a consistent history of paying dividends. The following data represents a historical dividend record for Company X, showing a consistent dividend payment over several years:
- 2024:
- November 08: $0.05
- August 12: $0.05
- May 10: $0.05
-
February 09: $0.05
-
2023:
- November 03: $0.05
- August 04: $0.05
- May 05: $0.05
-
February 10: $0.05
-
2022:
- November 04: $0.05
- August 05: $0.05
- May 06: $0.05
-
February 04: $0.05
-
2021:
- November 05: $0.05
- August 06: $0.01
- May 07: $0.01
-
February 05: $0.01
-
2020:
- November 06: $0.01
- August 07: $0.01
- May 08: $0.01
-
February 07: $0.01
-
2019:
- November 12: $0.05
- August 13: $0.05
- May 10: $0.05
-
February 12: $0.05
-
2009:
- November 06: $0.05
- August 10: $0.05
- May 11: $0.05
-
February 09: $0.30
-
2008:
- November 07: $0.30
- August 11: $0.30
- May 12: $0.25
-
February 11: $0.25
-
2007:
- November 09: $0.20
- August 13: $0.20
- May 14: $0.20
-
February 12: $0.20
-
1995 - 1999: Consistent quarterly dividends of $0.25.
-
1991 - 1994: Consistent quarterly dividends of $0.25.
This consistent payment history aligns with Benjamin Graham's emphasis on investing in companies with a long and reliable track record of returning profits to shareholders through dividends.
| Alpha | None |
| Beta | None |
| R-squared | None |
| Standard Error | None |
The linear regression model between X and SPY, which serves as a stand-in for the entire market, indicates a specific measure of alpha. Alpha represents the ability of the model to generate returns that exceed the broader market's performance, independent of the returns predicted by market movements. When evaluating the model's alpha, it is crucial to understand whether it is statistically significant, as this will determine if the observed outperformance is likely to be an inherent characteristic of X rather than a result of random chance. A positive alpha suggests that X may consistently outperform the market, whereas a negative alpha may indicate underperformance.
Furthermore, alpha is essential for portfolio managers and investors as it provides insight into the investment's added value compared to the benchmark, which in this case is SPY. When interpreting alpha, it should be considered in conjunction with other statistics like beta and R-squared, which provide additional context about market correlation and model accuracy. Since SPY encompasses a broad market perspective, alpha effectively allows investors to isolate the unique effectiveness of X in achieving superior market performance beyond traditional market forces.
United States Steel Corporation (U.S. Steel) conducted its third quarter 2023 earnings call, highlighting its consistent performance and strategic enhancements. Kevin Lewis, VP of Finance, introduced the panel, emphasizing key contributors to U.S. Steel's performance, including CEO Dave Burritt and other senior executives. A notable mention was the addition of Emily Chieng as Investor Relations Officer, poised to bridge the company and its stakeholders with her industry experience. The company was painted with a backdrop of geopolitical concerns, yet keen focus was placed on its strategic goals and financial metrics, which were summarized using detailed presentation slides available on their Investor Relations page.
CEO Dave Burritt outlined three core messages shaping U.S. Steel's strategic direction: a robust strategic alternatives review process, the sustained operational success of the corporation, and potential EBITDA growth in 2024 beyond current market projections. The strategic review process, initiated in response to unsolicited acquisition proposals, was conveyed as a testament to the company's value, though confidentiality and progress details were maintained. U.S. Steel's leadership asserted progress with strategic alternative activities and underscored its alignment with shareholder interests, hinting at future significant value creation as capital expenditures on strategic projects decrease.
The operation side was portrayed as resilient and flexible, hitting a 12th consecutive quarter of profitability. Safety performance was highlighted, marking it as integral to operational success. U.S. Steel presented itself as strategically positioned to capitalize on prevalent industry megatrends such as de-globalization, decarbonization, and digitization, with U.S.-centric production underpinning competitive advantages. The significant headwinds due to global conflicts and shifts in supply chains were juxtaposed against legislative boosts like the Bipartisan Infrastructure Law and the CHIPS Act, which supported a renaissance in American manufacturing. U.S. Steel's commitment to sustainability and technological adoption through electrification of steelmaking and AI-driven operational efficiencies was evidently a strategic anchor.
Looking forward to 2024, U.S. Steel anticipated a transformational year with strategic projects entering operational phases, considerable EBITDA increments, and a marked reduction in CAPEX. Highlighted projects included the NGO Electrical Steel Line, the dual-coated GALVALUME line, and the anticipated startup of Big River 2. The forecasted volume growth and operational improvements spurred optimism in reduced GHG emissions and enhanced steelmaking sustainability. Importantly, the call also addressed market challenges by discussing strategic asset management decisions, such as idling the Granite City Works blast furnace, and the adaptability of its operational framework. CFO Jess Graziano rounded off the financial outlook indicating stable or improved EBITDA across business segments, anticipating market variables like pricing, foreign exchange, and material costs, with a focus on bridging to a potentially promising 2024.
The SEC 10-Q filing for United States Steel Corporation (X) for the quarterly period ended September 30, 2024, reveals several important details about the company's financial activities and position during the quarter. Filed on October 28, 2024, the report provides a comprehensive overview of U.S. Steel's operations, financial performance, and strategic endeavors within the steel production industry. The document details net sales of $3.219 billion for the third quarter and $10.192 billion for the nine months ended September 30, 2024, compared to $3.943 billion and $12.375 billion in the respective periods of the previous year. This decline in sales reflects challenges likely influenced by market conditions and strategic operational changes within the company.
The report emphasizes significant segments within U.S. Steel's operations, which include the North American Flat-Rolled, Mini Mill, U. S. Steel Europe (USSE), and Tubular Products. The Flat-Rolled segment reported net sales of $2.377 billion for the quarter, marking the largest contribution among segments, but indicating a reduction from prior periods. Notably, the Mini Mill operations, with a nascent, technologically advanced flat-rolled steelmaking facility, Big River 2, observed substantial assets allocation due to expansion strategies. The USSE posted sales of $745 million while Tubular products contributed $217 million, indicating varied performance across different product lines within the segments.
Strategic initiatives highlighted in the filing include the ongoing merger agreement with Nippon Steel Corporation and the development of Big River 2 in Osceola, Arkansas. The merger, which obtained a high approval percentage from U.S. Steel stockholders, is set to finalize in the fourth quarter of 2024, subject to regulatory approvals. This potential merger and the expansion of technologically advanced facilities underscore U.S. Steel's focus on bolstering its positioning in the global steel market through strategic partnerships and innovation.
U.S. Steel also commented on its performance related to environmental and operational sustainability, addressing the expected impacts of new SEC climate-related disclosure requirements effective fiscal years 2025 and 2026. The company is preparing for these disclosures, particularly around capital and operational impacts related to severe weather conditions and greenhouse gas emissions.
Financial measures also include earnings and cash flow insights where earnings before interest and income taxes totaled $48 million for the third quarter of 2024, a stark decrease compared to $277 million in Q3 2023. Despite ongoing investments in capital expenditures, emerging challenges such as restructuring charges, asset impairment costs, and strategic maintenance expenses have led to a dip in earnings performance. Additionally, stock-based compensation and earnings before taxes reflect financial complexities the corporation is navigating while maintaining targeted growth and capital investment objectives.
United States Steel Corporation (U.S. Steel) stands as a core pillar in the American steel industry, embedded in both the nation's industrial history and its strategic economic future. As of early January 2025, the company is a focal point in a potential acquisition that could reshape the landscape of the American steel market. The emerging interest from domestic steel magnates Cleveland-Cliffs and Nucor highlight strategic movements aimed at consolidating the U.S. steel industry in the face of growing global competition and strategic international interest.
Cleveland-Cliffs, in collaboration with Nucor, has positioned itself as a significant contender in the bid for U.S. Steel, especially after geopolitical factors blocked a prior acquisition attempt by Japan's Nippon Steel. The White House's intervention to prevent Nippons $14.9 billion offer, citing national security concerns, underscores the importance of maintaining domestic control over critical manufacturing sectors. This move by Cleveland-Cliffs aspires to not only acquire the historic steelmaker but to retain its headquarters in Pittsburgh, signaling a commitment to preserving its American heritage.
The proposed acquisition is not just a strategic business maneuver but is also laden with legal complexities. The existing litigation involving U.S. Steel and Nippon against Cleveland-Cliffs, alleging collusion to thwart the Japanese bid, adds layers of complexity to the acquisition scenario. This legal tangle has been further complicated by shifting political landscapes, particularly with a new U.S. administration under President-elect Donald Trump, who has signaled a hardline stance against foreign acquisition attempts of critical American industries.
Goncalves, CEO of Cleveland-Cliffs, has been an articulate proponent of the domestic acquisition strategy. His rhetoric frequently emphasizes strengthening American industrial capabilities and protecting U.S. jobs, using aggressive rhetoric against Japan, accusing it of harmful trade practices. Though contentious, this stance aligns with a broader narrative of nationalist economic policies underscoring the strategic importance of U.S. Steel.
Investor reaction to these developments has been notable, as U.S. Steel's stock experienced a rise when the news of Cleveland-Cliffs and Nucor's interest surfaced. Despite their offer being lower than Nippons, it is viewed more favorably in light of domestic consolidation prospects. The strategic proposal involves Cleveland-Cliffs acquiring U.S. Steel with a plan to divest certain assets to Nucor, reflecting a carefully crafted strategy to not only optimize operations but also potentially evade regulatory constraints.
The steel industry is inextricably tied to geopolitical factors, with trade policies and national security playing vital roles in mergers and acquisitions. With Nippon pursuing legal avenues in response to the blocked deal, the legal outcomes will be pivotal in shaping the future ownership and governance of U.S. Steel. Additionally, these proceedings will provide critical insights into how national security considerations are weighed against commercial interests in the context of high-stakes international business dealings.
The broader market dynamics also influence this potential acquisition. The steel market, characterized by fluctuating demand and international competition, implies that strategic consolidations might be crucial for future profitability. With automotive, construction, and other industries susceptible to economic cycles, steelmakers like U.S. Steel must navigate a complex web of factors to sustain competitiveness.
Stakeholders, investors, and policymakers will be closely monitoring the unfolding developments around U.S. Steel. Future corporate strategies, market conditions, and geopolitical shifts will dictate the trajectory of this iconic American company. As the potential acquisition advances, it will likely serve as a bellwether for similar industrial consolidations, set against a backdrop of national security and economic resilience considerations.
As this complex scenario evolves, the strategic interests, legal disputes, and shifting political priorities hand in hand will determine the ultimate outcomepotentially redefining the competitive dynamics and operational strategies of U.S. Steel and its standing within the global steel industry.
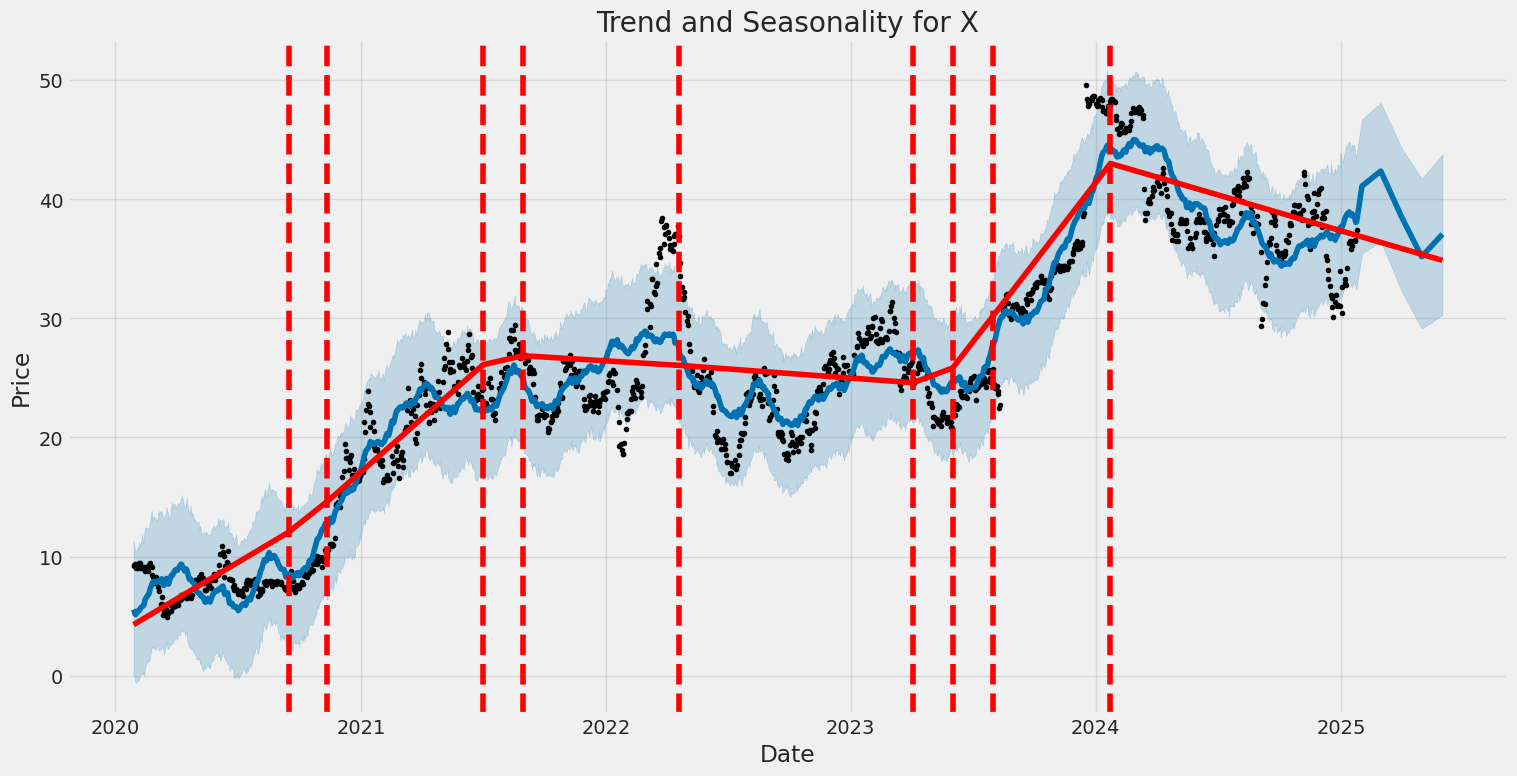
United States Steel Corporation experienced fluctuating returns during the specified date range, indicating a level of unpredictability in its stock price movements. The ARCH model reveals that the volatility of asset returns was significantly influenced by past variances, as observed from the omega and alpha coefficients. Furthermore, the volatility model's low R-squared value suggests that the model explains little of the variance in asset returns, highlighting the challenges in forecasting the stock's future movements.
| R-squared | 0.000 |
| Adj. R-squared | 0.001 |
| Log-Likelihood | -3,456.74 |
| AIC | 6,917.48 |
| BIC | 6,927.75 |
| No. Observations | 1,255 |
| Df Residuals | 1,255 |
| Df Model | 0 |
| omega | 11.7978 |
| alpha[1] | 0.2641 |
In examining the financial risk associated with a $10,000 investment in United States Steel Corporation over a one-year period, an approach combining volatility modeling and machine learning predictions offers significant insights.
Volatility modeling serves a crucial role in understanding the fluctuations in United States Steel Corporation's stock price by evaluating past market data to identify patterns in volatility. This analysis benefits from observing how volatility clusters over time, recognizing periods of high and low volatility that might impact the stock price. Accurate modeling of this volatility is essential for assessing potential risks, as fluctuations can directly influence the level of investment risk.
Meanwhile, machine learning predictions enhance this analysis by forecasting future stock returns. Using complex algorithms that consider historical price movements, broader market indicators, and economic variables, the model predicts the likely path of stock prices. These predictions help quantify potential gains or losses and provide a probabilistic view of future financial scenarios.
The synergy between these methodologies allows for a robust risk assessment framework. For instance, integrating volatility insights with machine learning forecasts enables the calculation of the Value at Risk (VaR), a statistic that quantifies the potential maximum loss over a specified period at a given confidence level. For this investment in United States Steel Corporation, the VaR at a 95% confidence interval is calculated to be $477.97. This figure represents the maximum expected loss over one year with a 95% probability, indicating that while there is a 5% chance of experiencing a loss greater than $477.97, the investor is relatively insulated against extreme downside risk.
This approach not only quantifies the potential risk but also equips investors with a probabilistic understanding of possible outcomes, highlighting the utility of integrating volatility modeling with advanced predictive techniques to navigate equity investments effectively.
Long Call Option Strategy
To analyze the profitability of long call options for United States Steel Corporation (X) in this scenario, we would typically examine the options chain using the Greeks, which are essential tools that help quantify risk and approach potential profitability. Since the data here is missing, I will outline a general approach based on common principles and considerations that are typically used when doing such an analysis.
Profitability Considerations
-
Delta: This measures the sensitivity of the option's price relative to the underlying stock's price movements. For more immediate gain expectations, we would focus on options with higher deltas, typically closer to 1. As the stock is predicted to increase by 2%, selecting options with high delta values would allow for capturing most of this move. Such options usually have higher premiums but offer exposure that translates an immediate upward stock movement into substantial option value increases.
-
Gamma: This reflects how the delta of an option changes as the stock price changes. High gamma values indicate that an option's delta will increase quickly with favorable stock price movements. Selecting options with sizeable gamma will be beneficial, as this would suggest that as U.S. Steel Corporation's stock starts to increase, the delta of your option will rise, compounding the potential gains.
-
Theta: Known as the time decay component, this quantifies how much the value of an option decreases as the expiration date approaches. Near-term options typically have higher time decay, so selecting options further out in time will mitigate rapid losses due to theta decay, at the expense of higher premiums.
-
Vega: This measures sensitivity to volatility. If implied volatility is expected to rise, options with higher vega will increase in value, while a decline in volatility can erode the option's premium.
Short-Term Options
For a more immediate strategy, near-term options, such as those expiring in the next month, should be considered. These options will typically have higher gammas and deltas, maximizing the responsiveness to the anticipated 2% increase. The principal risk here involves theta decay and volatility. If the stock does not move quickly enough, the option's value could diminish sharply.
Medium-Term Options
Choosing options with expiration dates between three to six months can provide a balanced approach. While gamma and delta might be slightly lower than short-term options, the impact of theta is reduced. Moreover, these options offer some protection against volatility changes, making them ideal if moderate stock price movement is expected.
Long-Term Options
Leap options with expirations over six months to a year tend to have the lowest gamma and theta, providing a cushion against short-term price volatility and time decay. These options are costly but allow for longer-term stock price movements to materialize. They're suited for those who foresee significant stock appreciation over time and wish to minimize regular losses due to daily price fluctuations.
Conclusion
A diversified strategy incorporating both short, medium, and long-term options can limit risk while allowing for participation in the expected stock appreciation. Monitoring implied volatility and market conditions can adjust these choices for optimal exposure. Always remember to consider transaction costs and the overall market sentiment when making final selections among available options.
Short Call Option Strategy
To analyze the most profitable short call options for United States Steel Corporation (X), we must consider several factors related to option pricing and risk management. Despite the absence of specific data in the query, we can still provide a framework for evaluating short call options based on general options trading principles and our goal to minimize risk of assignment while maximizing potential profit.
-
Near-Term Expiration, High Strike Price: Consider short call options with near-term expiration dates and strike prices significantly above the current stock price, yet realistic for potential price moves. Generally, options that are deep out-of-the-money carry lower premiums but have a reduced risk of being assigned. If the target stock price is 2% below the current stock price, options with an expiration date of, say, one month and a strike price of, for example, 10% above the current stock price, might be attractive. The limited time to expiration reduces exposure to time decay (theta), which is beneficial for short sellers. The primary risk here is limited if the stock price unexpectedly rises sharply before expiration.
-
Mid-Term Expiration, Moderate Strike Price: Another choice includes options with a mid-term expiration, such as three to six months out, with strike prices closer to but still above the current stock price. These options typically offer higher premiums because of increased time value. This scenario would involve more exposure to time-related risks but also potential greater premium income. Here, you must carefully evaluate the delta and gamma, as higher values indicate greater sensitivities to stock price changes which increase assignment risks when the options move in-the-money.
-
Long-Term Expiration, High Strike Price (LEAPS): Selling long-term options such as LEAPS (Long-term Equity Anticipation Securities), with expiration dates more than a year away, can also be profitable. Choose options with strike prices that are significantly above the anticipated future stock price to keep the risk of assignment low. These options will carry higher premiums due to the extended time value. Large theta values in long-term options indicate a slow decay in time value, allowing for sustained premium collection, but these positions require monitoring to avoid assignment on significant price movements.
-
Near-Term Expiration, Closer to Target Price: Options with a near-term expiration close to the target stock price (e.g., 2% under the current stock price) may offer higher premiums due to their proximity to current market value. However, these carry a higher risk of being in-the-money at expiration, necessitating a balance between profit potential and assignment risk. Thorough analysis of market trends and implied volatility can help mitigate unexpected movements.
-
Balanced Strategy Across Different Terms: Implementing a mixed-term strategy involves selling options across different maturities and strike prices to diversify risk and premium income. For instance, combining short-dated options for quick premium collection with long-dated options for sustained premium while managing the overall portfolio delta and theta exposure could optimize risk-reward dynamics efficiently.
The analysis of specific options within these categories would need to be nuanced and based on market conditions, volatility levels, and other stock-specific factors at the time of trading. Each option choice involves weighing the premiums received against the risk of stock price changes and potential assignment. Using tools like the Greeks (delta, gamma, theta, vega) allows traders to gauge these risks and align them with their market outlook and risk tolerance.
Long Put Option Strategy
In analyzing long put options for United States Steel Corporation (X), we focus primarily on those with expiration dates and strike prices that present the best opportunities for profitability given a target stock price that is 2% above the current market price. Put options generally profit when a stock's price decreases, making the current scenario ideal for exploring strategic entries based on market expectations.
-
Near-Term Expiration, In-the-Money Options: Generally, in-the-money (ITM) put options with a closer expiration date present a higher delta value, implying they are more sensitive to changes in the underlying stock price. This is crucial for short-term investors betting on a swift downward movement in the stock price. For instance, consider a put option expiring soon with a strike price marginally above the current stock price; its high delta suggests significant gains if the stock's price drops as anticipated. However, the gamma risk is also higher, meaning these options could lose value just as quickly if the stock does not move favorably.
-
Moderate-Duration, At-the-Money Options: For a balanced trading strategy, investors often consider at-the-money (ATM) put options with a moderate expiration timeline. These options usually have a delta near 0.5, offering a balanced risk-reward scenario. As the stock price moves lower, these options quickly gain intrinsic value while time decay (theta) is moderate compared to near-term options. If the strike price aligns with a slight decrease in stock price post 2% increment, potential profits are amplified through strategic timing, though careful attention to time decay is necessary.
-
Further-Out Expiration, In-the-Money Options: These options are appealing for traders expecting a significant decrease in the stock price over a longer period. With higher intrinsic value and lower time decay than short-term counterparts, these options allow for a more patient approach. For example, put options with a distant expiration date and a slightly higher strike price than the current market price offer substantial profit if the stock price aligns with market forecasts. However, their vega is higher, indicating sensitivity to volatility changes, enhancing their value in turbulent markets but posing risks if volatility falls unexpectedly.
-
Long-Term Expiration, Deep In-the-Money Options: For a conservative strategy aiming at risk mitigation, deep ITM options with long-term expirations maximize intrinsic value while minimizing exposure to time decay and volatility changes. These options are less speculative, providing certainty in payout should the stock price decline significantly, as projected. They offer a solid hedging opportunity for portfolios or substantial standalone profit if market conditions align with bearish expectations over an extended period.
-
Long-Term Expiration, Out-of-the-Money Options: While inherently riskier due to their speculative nature, long-term OTM options offer outsized potential returns. These are suitable for traders with high-risk tolerance betting on substantial downward movement. Given the target price scenario, selecting OTM options with modest premiums yet far enough expiration dates allows for considerable upside if the stock trajectory dramatically shifts downward, albeit at the risk of losing the entire premium if the price movement does not transpire.
Analyzing the profitability of these options involves weighing each's delta, gamma, theta, and vega while considering current market conditions and forecast scenarios. The choice of expiration date and strike price significantly impacts risk-reward dynamics, necessitating a nuanced approach to manage risks effectively while capitalizing on potential downturns in United States Steel Corporation's stock price.
Short Put Option Strategy
To analyze the short put options for United States Steel Corporation (X) effectively and determine the most profitable options with minimized assignment risk, we must consider several factors, including the Greeks and the relationship between strike prices, target stock price, and time to expiration. Given the current market dynamics and an aim to target a stock price that is 2% below the current price, our approach should prioritize options that maximize premium earnings while minimizing the likelihood of assignment.
Firstly, focusing on near-term options with expiration dates within the next few weeks can be enticing due to the rapid decay of time value, captured by high theta values. These options tend to lose value quickly as expiration approaches, which is beneficial for a short put strategy. This time decay offers potential profitability if the stock price remains stable or rises. However, we must balance this with the risk of shares being assigned if the market price falls below the strike price. For instance, selecting options with a strike price a bit lower than the target stock price reduces this risk. Hence, identify near-term options with relatively high premium and strike prices slightly lower than the target stock price, complemented by a low delta value, indicating lower sensitivity to price movements.
For mid-term options, consider those with expiration dates one to three months out. These options provide a balance between time decay and potential intrinsic value changes. Choosing mid-term options with a low delta and a moderate vega allows you to benefit from stable implied volatility, which can contribute to maintaining premium value. Evaluation should focus on options with strikes closely aligned to the target stock price, ensuring that the option is out-of-the-money under most scenarios, reaffirming the limited assignment risk.
Long-term options offer different characteristics. With expiration dates extending six months or more, these options carry higher premiums due to significant time value. However, the slowing pace of time decay (lower theta) and potential changes in volatility (high vega) might influence profitability. For long-term options, choosing those with relatively lower delta values minimizes price sensitivity, while higher vega values allow strategic plays on implied volatility changes. Strike prices for these long-term options should still be closer to the current stock price, which can mitigate the assignment risk as the stock is anticipated to remain above or near these levels in the long run.
To summarize the selections: 1. Select a near-term option with a lower strike price than the target, emphasizing a high theta for time decay benefit. 2. Choose a mid-term option with moderate premium value, ensuring the strike price aligns just below the current target, focusing on low delta. 3. Another mid-term option might focus on elevated vega for implied volatility opportunism, with a similar target vicinity for strike price. 4. For long-term options, seek those with moderate premiums and higher vega, ensuring strike prices near the current market to limit risk. 5. A final option selection could capitalize on unique high-volume scenarios with slightly lower deltas and strikes marginally under as a safety net.
By tactically assessing these aspects, short put traders can strategically expose themselves to premium accrual while conscientiously managing assignment risks over various time horizons.
Vertical Bear Put Spread Option Strategy
To develop a profitable vertical bear put spread strategy on United States Steel Corporation (X), we need to analyze the available options, which include short put and long put positions. In a vertical bear put spread, an investor buys a put option and sells another put option with a lower strike price but the same expiration date. This strategy is tailored for a bearish market view, where the aim is to profit from a decline in the stock price.
Since comprehensive data is not provided here, a general approach will be applied. Typically, in constructing a bear put spread, the investor should first identify an at-the-money or slightly out-of-the-money put option to buy. This option will generally have a higher delta, indicating a higher sensitivity to price movements and a greater likelihood of finishing in-the-money, thereby providing the opportunity for a significant payoff if the stock price declines.
Next, the investor sells a put option with a lower strike price, ideally out-of-the-money, to limit the cost of buying the higher strike put. The price difference between these two options constitutes the initial cost of the spread. The spread's maximum profit is generally the difference between the two strike prices minus the net premium paid. Hence, it's crucial to select options where this cost-benefit balance is optimized.
In terms of expiration dates, here's a guide to selecting varying term options:
-
Near Term Option: Look for options expiring within the next month. Here, time decay (Theta) will be significant, meaning that the value of the options can decrease rapidly as expiration approaches. Therefore, it is vital to monitor the stock closely and potentially exit the trade if the target price range is reached early. The advantage here is potentially higher volume and liquidity, making it easier to enter and exit positions.
-
Medium Term Option: Expire in 2 to 3 months. These options provide a balance between time decay and the opportunity for the move you anticipate. The Greeks, such as Delta and Theta, play crucial roles here, as a moderate decline in the stock is needed to make the trade profitable. Picking options with moderate Vega values might help mitigate volatility risks.
-
Longer Term Options: Expire beyond six months to a year. These options tend to have less time decay and are more about strategic positioning over a longer timeframe. If you foresee market trends negatively impacting the stock, this can maximize potential returns by allowing for larger market movements. With lower Theta and significant Delta, these longer-dated options offer less immediate risk of time decay while allowing for more market fluctuations.
An optimal vertical bear put spread aims to capture a downside move while limiting risk with strategic option choices. For specific strike prices, choose ones that slightly encompass your 2% target price range to ensure profitability if the stock moves in the expected direction but not overly in the money to avoid assignment risk. Dynamic adjustments and monitoring Greeks such as Gamma (for fluctuation sensitivity) and Vega (for volatility considerations) are essential for maintaining profitability during the life of the spread.
In conclusion, the most profitable approach is highly reliant on current market conditions and stock price dynamics; hence flexibility and close monitoring are advised.
Vertical Bull Put Spread Option Strategy
Analyzing a vertical bull put spread strategy for United States Steel Corporation (X) involves selecting both short put and long put options from the available options chain. Since you wish to minimize the risk of having shares assigned, it is crucial to choose short put options that are out-of-the-money (OTM), ideally using the Greeks to assess the potential risk and reward.
Given that your target stock price is approximately 2% above or below the current price, let's focus on establishing spread strategies with varying expiration dates and strike prices to determine five viable outcomes. The bull put spread involves writing a put option (short position) while simultaneously purchasing another put option (long position) with a lower strike price but the same expiration date. This strategy typically capitalizes on moderate bullish trends in the underlying asset.
- Near-term Expiration:
- Expiration Date: One month out
- Strike Prices: $25 short put / $23 long put
For the near-term strategy, selecting a short put option with a strike price of $25 and a long put at $23 capitalizes on a slight market uptick, which aligns with your 2% price target window. The Delta value of the short put should ideally be low, indicating limited intrinsic value, thereby reducing the likelihood of assignment. Risk is limited as the maximum loss occurs if the stock price falls below $23, while potential profit is capped by the premium earned from selling the $25 put.
- Intermediate-term Expiration (3 months):
- Expiration Date: Three months out
- Strike Prices: $26 short put / $24 long put
Opting for a longer expiration allows for potential appreciation in the stock. The $26/$24 spread further diversifies time decay since Theta can benefit the trader more effectively with these options. This strategy presumes a steady uptrend beyond short-term fluctuations. Here, the Rho value should also be considered, as interest rate changes over a longer duration can impact the position.
- Six-month Expiration:
- Expiration Date: Six months out
- Strike Prices: $27 short put / $25 long put
A mid-range expiration offers a balanced time premium that still aligns with forecasted market trends. This strategy works by doubling down on the assumption that the industry fundamentals and market sentiment will bolster the stock's upward trajectory. Vanna and Gamma values can play a part here, as gains due to volatility shifts are more pertinent within this timeframe.
- Nine-month Expiration:
- Expiration Date: Nine months out
- Strike Prices: $28 short put / $26 long put
A spread with nine-month maturity taps into longer-term developments and is resilient to short-term market pulls. The potential reward comes from premium generation, while risk is curtailed through time to adjust positions if market trends deviate.
- Long-term Expiration (12 months):
- Expiration Date: One year out
-
Strike Prices: $29 short put / $27 long put
Longer-dated options provide expansive leeway for price movement amidst broader economic cycles. The primary risk lies in market volatility and external shocks; however, the disciplined selection of a wide enough spread limits downside while maximizing the premium receivable. Vega considerations gain prominence in these extended strategies due to sensitivity toward volatility changes in the market.
Each choice offers varying degrees of risk, dependent on the stock's adherence to anticipated trends. Near-term options are subject to price volatility and require more precise market timing, while longer-term options leverage extended periods to mitigate temporary setbacks. Profitability ultimately pivots on structurally favorable Greeks, spread width, and strategic market insights.
Vertical Bear Call Spread Option Strategy
As you are interested in a vertical bear call spread strategy using options for United States Steel Corporation (X), let's delve into this strategy without being able to refer to specific data. Even though you have indicated you are interested in empty options datasets for both short and long call options, typically this strategy would involve simultaneously selling a call option at a lower strike price and buying a call option at a higher strike price, both with the same expiration date. The objective is to profit from a neutral to bearish market outlook, fading share price action that does not catapult significantly beyond the lower strike price, thereby rendering the position profitable or limited in loss when expiration occurs.
Strategy Definition and Execution:
Since we focus on minimizing the risk of shares being assigned, choosing option strike prices that are either at-the-money or out-of-the-money while ensuring the market price of the underlying is close to these strikes will be prudent. Its evident that the strategy will become profitable when the stock price is at or below the strike price of the short call option at expiration.
Options Selection:
Given the hypothetical scenario with no specific data for the short and long call options provided, let's outline a theoretical framework for choices that stretch from near-term to long-term expiration dates for this vertical bear call spread:
- Near-Term Option (1-2 months till expiration):
- Choice: A near at-the-money bear call spread.
- Risk: High risk of assignment if the underlying spikes due to unforeseen news.
-
Reward: Moderate reward since premium decay (theta) is more rapid as expiration nears, enabling quicker capture of premium if the movement remains within expected bounds.
-
Mid-Term Option (3-4 months till expiration):
- Choice: Slight out-of-the-money bear call spread.
- Risk: Moderately lower risk of assignment compared to near-term as there is some buffer with slightly higher strikes.
-
Reward: Balanced premium capture potential with risk control, as time value is still significant, meaning collected premium could be higher.
-
Mid-Long Term (6 months till expiration):
- Choice: Deep out-of-the-money bear call spread.
- Risk: Lower risk of assignment; largely reliant on the forecast of bearish market conditions being correct at expiration.
-
Reward: Smaller reward potential as deep OTM spreads have lower premiums unless implied volatility increases favorably.
-
Long-Term Option (9-12 months till expiration):
- Choice: A wider spread in out-of-the-money territory.
- Risk: Assignation risk is minimized; however, long maturation period demands patience and solid confidence in bearish continuation.
-
Reward: Allows strategic adjustments; reward is in consistent volatility offsetting funded side positions long-term.
-
Leap-Year Option (over 1 year till expiration):
- Choice: Options with extended expiration, targeting significant shifts in macro environment or systemic changes.
- Risk: Considerably minimized assignment concern amidst major time until expiry yet sensitive to fundamental changes to make potential adjustment or exit early if sentiment shifts bullish.
- Reward: Maximizes premiums on infrequent speculative assertion that long-term price decline will favorably impress over its course.
Overall, the balance centers on your risk profile against United States Steel Corporation's anticipated price action. Being strategic about the distance of strike prices from the target price, alongside ensuring the expiration aligns with likely movements, should calibrate the optimal bear call spread.
Vertical Bull Call Spread Option Strategy
To assess the most profitable vertical bull call spread strategy for United States Steel Corporation (X), we need to analyze the options chain with a keen eye on minimizing risk tied to being assigned shares while achieving reasonable profit under the target stock price forecast. The bull call spread involves purchasing a call option with a lower strike price while simultaneously selling another call option with a higher strike price, both with the same expiration date. This strategy has limited potential losses while capping potential profits.
Near-Term Strategy
- Expiration: Near-Term (1-2 months out) | Strike Prices: At-The-Money (ATM) and OTM
- Call Option A (Buy): Choose an at-the-money option such that the delta value is moderately high (approaching 0.50), ensuring a favorable price movement with the underlying asset.
- Call Option B (Sell): The choice should be an out-of-the-money option, and we aim for a delta lower than that of the purchased option to cap the profit while reducing cost.
- Risk and Reward: The risk involves a limited maximum loss equal to the net premium paid, while the reward is also capped. Since the timeframe is short, theta decay is high, accelerating loss if the stock does not move as expected.
Medium-Term Strategy
- Expiration: Mid-Term (3-5 months out) | Strike Prices: Slightly OTM and Further OTM
- Call Option A (Buy): Select options with a delta higher than the sold call but slightly out-of-the-money to lower the cost while still being positioned for profit with modest stock appreciation.
- Call Option B (Sell): Far out-of-the-money option with lower gamma; this keeps potential profit thresholds higher without excessive cost.
- Risk and Reward: While the net premium is a sunk cost, potential profits become enticing if the stock price appreciates beyond the lower strike price by expiration. Vega risk gets higher, meaning volatility changes will significantly affect option values.
Long-Term Strategy
- Expiration: Longer-Term (6-12 months out) | Strike Prices: Moderately In-The-Money (ITM) and ATM
- Call Option A (Buy): An in-the-money option with a high intrinsic value, ensuring if the stock price approaches the estimated target, it retains a significant value.
- Call Option B (Sell): Use at-the-money calls to increase premium intake and contain assignment risk.
- Risk and Reward: Higher intrinsic value mitigates decay losses, but the profit remains capped. The loss levels remain equal to the net spread cost.
Near-the-Money Strategy
- Expiration: Mid-Term (4 months out) | Strike Prices: Near-The-Money for both buy and sell
- Call Option A and B: Delta of the bought option should be moderately positive, whereas for the sold option it should be low to minimize immediate exercise risk.
- Risk and Reward: This strike alignment maximizes spread coverage, and any stock movement to the target value ensures a full span of profit with the lowest theta exposure.
Calendar Spread Modifications
- Expiration: Mixed-Term (Front-Month buy and Back-Month sell) | Strike Prices: Matching
- Call Option A (Front-Month Buy): High delta call option.
- Call Option B (Back-Month Sell): Matching strike call from a further expiration.
- Risk and Reward: This rolling approach potentially offers increased time value capture, thus maximizing realized profit over the strategy's lifespan, albeit with increased capital and managing complexity.
Each strategy involves balancing the Greek values to optimize the profit from the spread while taking calculated risks that can be managed according to volatility expectations and market anticipations. Understanding the implications on assignment, particularly for near-term and in-the-money options, is crucial to managing overall strategy effectively.
Spread Option Strategy
To analyze the most profitable calendar spread options strategy related to United States Steel Corporation (X), we need to understand the dynamics between the call and put options while managing risks associated with in-the-money positions and aiming for profitability. A calendar spread typically involves buying and selling options with the same strike price but different expiration dates. In this context, your strategy involves buying a call option with a further expiration date and selling a put option with a shorter expiration date. While you want to minimize the risk of having shares assigned, your focus is on leveraging time decay and volatility appropriately.
1. Near-Term Strategy:
For a near-term approach, choose a call option with an expiration date slightly further out than the nearest put option you intend to sell. For instance, buying a call with a 1-month expiration and selling a put with a 2-week expiration around the current stock price can be effective. This way, you capitalize on the rapid time decay (theta) of the short put option while maintaining a relatively stable position in the long call. An ideal choice would be a call option with a delta close to 0.3 and low theta to minimize time decay, signifying less likelihood of being deep in-the-money, combined with selling a put option with higher theta for premium attraction.
2. Mid-Term Strategy:
In a mid-term strategy, the goal is to capture potential stock movement over several months. Buying a call option expiring in 3 months and selling a put with a 1-month expiration can provide a good balance. Seek a long call with lower gamma to reduce sensitivity to volatile price swings and match it with a short put where theta remains high. Here, choosing a strike price around 2% below the current stock price for the put can limit your risk of assignment, as it generally stays out-of-the-money unless the stock declines significantly.
3. Intermediate Strategy:
For a more intermediate stance, you could purchase a call option with a 6-month expiration and sell a put option expiring in 2 months. This strategy allows you to ride any anticipated stock price movement while managing theta decay more precisely. The long call should exhibit a higher vega to benefit from increases in volatility, while the short put, carrying significant theta decay, captures premium effectively. Both positions should have deltas around 0.2-0.4 to limit the risk of deep in-the-money scenarios.
4. Long-Term Strategy:
Over the long term, a call option with a 12-month expiration paired with a short put option with a 3-month expiration can create opportunities for maximum profit capture. This takes advantage of longer-term capital appreciation while continuously collecting premium from the short put. Ensure the long call has an advantageous risk/reward profile with a delta around 0.2 and high vega potential to be positively influenced by implied volatility spikes. The selected short put should ideally be slightly out-of-the-money to align with lower assignment risk.
5. Extended-Term Strategy:
Finally, for an extended time horizon, target a call option with an 18-month expiration while selling puts on a rolling 3-month basis. This approach allows for long-term view execution while resetting short positions to align with market conditions periodically. The long call needs a strategic balance between delta, theta, and vega to ensure it's neither too exposed to immediate volatility shifts nor impeded by excessive time decay. The serial short puts should consistently have high thetas and low deltas lowering the chance of being in-the-money.
In assessing these strategies, always consider the implied volatility changes, potential stock movement, and market conditions as they heavily influence the Greeks and option pricing. The risk of assignment from short puts can be controlled by selecting appropriately placed out-of-the-money options around the current price projection and maintaining attentive trade management depending on evolving stock behavior.
Calendar Spread Option Strategy #1
Without the specific data from the options chain and the Greeks, I'll provide a general strategy to construct a calendar spread using put and call options, and discuss the considerations involved in maximizing profitability while minimizing the risk of assignment.
A calendar spread typically involves buying and selling the same type of option (either both calls or both puts) at the same strike price, but with different expiration dates. However, your strategy here involves buying a put and selling a call, which is a different setup and implies a bullish outlook on the stock until the earlier expiration date.
To achieve profitability and reduce the risk of assignment in your scenario, the choice of options and strike prices is critical. Given your requirement to minimize the risk of assignment, it's important to choose call options that are out-of-the-money (OTM), where the strike price is above the current stock price. This reduces the likelihood of early assignment because options are generally exercised when they are in-the-money (ITM).
Now, let's explore five choices of expiration dates and strike prices for a put calendar spread, taking into account a target stock price 2% over or under the current price:
- Near-term Strategy (1-3 months):
- Long Put: Buy an at-the-money (ATM) or slightly out-of-the-money (OTM) put option with expiration in the next month. This provides downside protection if the stock price drops as anticipated within the near term.
-
Short Call: Sell an OTM call option with a strike price 2% higher than the current stock price and expiration date around 1-3 months out. This option is less likely to be assigned early due to its OTM status.
-
Short-term Strategy (3-6 months):
- Long Put: Opt for a put with 3-6 months until expiration. This longer duration allows time for potential downward price movement.
-
Short Call: Choose an OTM call option with a similar time to expiration. Keeping the call OTM minimizes the risk of assignment while allowing you to profit from time decay.
-
Intermediate-term Strategy (6-9 months):
- Long Put: Buy a put option with 6-9 months to expire, providing continued bearish exposure.
-
Short Call: An OTM call expiring in the same window should be selected to balance the spread. The call's out-of-the-moneyness should work in your favor, reducing assignment risk.
-
Long-term Strategy (9-12 months):
- Long Put: Purchase a put option with closer to a year until expiration, allowing for long-term bearish speculation.
-
Short Call: Sell an OTM call with a similar expiration date. The long-term nature reduces the present value of potential assignments.
-
Extended-duration Strategy (12+ months):
- Long Put: Choose a LEAPS (Long-term Equity Anticipation Securities) put with expiration beyond a year. This provides significant time for the option to gain value if the stock falls.
- Short Call: An OTM call with a long expiration aligns with reduced assignment risk while capitalizing on a potential stock appreciation ceiling.
Risk and Reward Analysis:
-
Long Put Options: The primary risk is time decay, which gradually erodes the value of the option without corresponding downward price movement in the stock. The reward is potentially significant if the stock declines substantially prior to expiration.
-
Short Call Options: The risk is theoretically unlimited if the stock price rises significantly above the strike price, leading to potential assignment (though reduced if OTM). The reward is more limited, typically the option premium received, which benefits from both time decay and volatility reductions.
Profit and Loss Scenarios:
-
Bullish Outcome: If the stock rises towards the call's strike price by the near-term expiration without falling significantly, the calendar spread could be profitable due to decay in the call's time value.
-
Bearish Outcome: Significant downward movement would increase the long put's value, potentially outweighing any loss in the call position, especially in long-term scenarios.
-
Neutral Outcome: Slight oscillations within a narrow range around the current price could see maximum profitability from the call's time decay, with limited loss from the long put.
In conclusion, a well-constructed calendar spread can profit situationally by leveraging different time horizons, strike prices, and stock price movements. However, careful selection and monitoring are essential to manage risks, particularly with respect to call assignments in this unconventional put-call calendar spread strategy.
Calendar Spread Option Strategy #2
To craft an effective calendar spread strategy involving United States Steel Corporation (X), one should consider primarily the volatility represented by the Greeks, particularly delta, theta, and vega. In a typical calendar spread strategy, you would buy a long-dated option and sell a short-dated one. However, the suggestion here deviates by proposing the selling of a put and buying a call across different expiration dates. This approach can still leverage the benefits of time decay while potentially capturing directional price movements.
Option Strategy and Risk Consideration:
-
Volatility and Greeks Analysis: The strategy's profitability hinges intricately on the implied volatility and the delta values of the options involved. Since one will be selling an option and thus becoming short gamma might demand careful attention as approaching expiry increases this aspect alongside time decay (theta). Conversely, buying a call option further out in time might allow you to enjoy increased leverage (via the delta) with less immediate concern about gamma risk.
-
Short Put Option Risk: The short put exposes you to the risk of assignment, specifically if it moves significantly in-the-money. The target stock price being 2% over or under the current stock price implies that if the underlying's price declines beyond a certain threshold relative to the strike price, assignment risk may materialize, necessitating proactive management. To minimize this, select a short put option with gamma values suggesting low price sensitivity in the near term and deliberately choose an option with a lower delta - indicating further out-of-the-money positioning - which reduces immediate assignment risk while operating within a viable profitability zone.
-
Long Call Option Potential: On the long call side, selecting an option with a higher theta advantageously counters the time decay impacting this side of the trade. Furthermore, selecting a call option with modest vega would ensure one gains from potential volatility surges, thus augmenting the profitability scenario as time lags. It is vital to choose a strike price close to your target stock price to balance cost and likelihood of capitalizing on price moves.
Choice Scenarios:
- Short-term Horizon:
- Short Put: Choose a strike slightly below the spot price, medium expiration short put, minimizing delta exposure.
-
Long Call: An option with a strike marginally above the current stock price in a medium-longer expiration timeline.
-
Intermediate-term Horizon:
- Short Put: An option comfortably out of the money with a notable savings in premium cost-efficiency.
-
Long Call: Selecting a call expiring around fiscal or product announcements for potential volatility upticks.
-
Medium-term Play:
- Short Put: Opt for deep out-of-the-money puts, near-term expiration to maximize on theta decay.
-
Long Call: Calls with favorable vega to hedge against unexpected volatility arise.
-
Long-term Projection:
- Short Put: Far enough expiration dates with lower delta for reduced compulsory assignment risk despite stock fluctuations.
-
Long Call: Leap options could be gone for long future dated scenario.
-
Market Fluctuation Choice:
- Short Put: Choose high gamma, low delta, and shorter expiry options to capitalize from major earnings surprises.
- Long Call: Strategically timed when cyclical reports project peak performance, longer expiry, high theta options.
Risk and Reward Analysis:
In essence, the strategy aims to minimize risk through thoughtful attention to delta and theta primarily. Having lower delta short put options towards your expiration control potential assignment challenges and protect profits through theta. Meanwhile, accurate forecasting, buying long call options in the right vega-volatility sphere facilitates potential high rewarding outcomes if the stock climbs by 2% or higher. Its structural complexity does require assiduous monitoring but offers a buffer through diverse expiration which potentially harnesses both intrinsic time decay benefits and market driven excursions.
Similar Companies in Steel:
Report: Nucor Corporation (NUE), Nucor Corporation (NUE), Report: Steel Dynamics, Inc. (STLD), Steel Dynamics, Inc. (STLD), Report: ArcelorMittal S.A. (MT), ArcelorMittal S.A. (MT), Report: Gerdau S.A. (GGB), Gerdau S.A. (GGB), Report: Cleveland-Cliffs Inc. (CLF), Cleveland-Cliffs Inc. (CLF), Report: Reliance Steel & Aluminum Co. (RS), Reliance Steel & Aluminum Co. (RS), Report: Commercial Metals Company (CMC), Commercial Metals Company (CMC), POSCO Holdings Inc. (PKX), Report: Ternium S.A. (TX), Ternium S.A. (TX), Companhia Siderurgica Nacional (SID)
https://www.youtube.com/watch?v=dLdsLadGheA
https://www.fool.com/investing/2025/01/13/why-us-steel-stock-soared-today/
https://www.youtube.com/watch?v=fKkne6m6Ymo
https://finance.yahoo.com/news/jim-cramer-united-states-steel-031618294.html
https://finance.yahoo.com/news/hearing-nippon-steels-lawsuit-over-093928443.html
https://finance.yahoo.com/news/why-investors-advantage-2-basic-140010327.html
https://finance.yahoo.com/news/u-steel-x-beat-estimates-171014746.html
https://finance.yahoo.com/news/japan-us-agree-bringing-ties-010330638.html
https://www.fool.com/investing/2025/01/22/the-ownership-battles-at-us-steel-and-tiktok/
https://finance.yahoo.com/news/united-states-steel-corporation-release-212400453.html
https://finance.yahoo.com/news/huge-polymetallic-discovery-could-power-000000098.html
https://finance.yahoo.com/news/united-states-steel-x-expected-150055777.html
https://www.sec.gov/Archives/edgar/data/1163302/000116330224000068/x-20240930.htm
Copyright © 2025 Tiny Computers (email@tinycomputers.io)
Report ID: OtrJyLF
Cost: $0.63943