Marvell Technology, Inc. (ticker: MRVL)
2024-07-03
 Marvell Technology, Inc. (NASDAQ: MRVL) is a leading semiconductor company specializing in data infrastructure solutions. The company, founded in 1995 and headquartered in Santa Clara, California, designs, develops, and sells a wide range of products, including data processors, networking components, and storage controllers. Marvell's technology underpins the storage, networking, and connectivity needs of various sectors such as enterprise, cloud, automotive, and industrial markets. With a strategic focus on innovation and efficiency, Marvell has made significant advancements in 5G, cloud computing, and artificial intelligence, aiming to enable the data-driven future. The company's robust growth is driven by its diversified portfolio and strong relationships with major technology providers and OEMs, which position it well to capitalize on the increasing demand for high-performance semiconductor solutions.
| Statistic Name | Statistic Value | Statistic Name | Statistic Value | Statistic Name | Statistic Value |
|---|---|---|---|---|---|
| Full-Time Employees | 6,511 | Previous Close | 71.0 | Open | 70.71 |
| Day Low | 69.87 | Day High | 71.73 | Dividend Rate | 0.24 |
| Dividend Yield | 0.0034 | Ex-Dividend Date | 1,720,742,400 | Payout Ratio | 0.1101 |
| Five-Year Avg Dividend Yield | 0.55 | Beta | 1.453 | Forward PE | 29.833332 |
| Volume | 5,969,742 | Average Volume | 11,475,474 | Average Volume 10 Days | 11,792,450 |
| Bid | 71.59 | Ask | 71.64 | Bid Size | 500 |
| Ask Size | 500 | Market Cap | 61,976,956,928 | 52-Week Low | 46.07 |
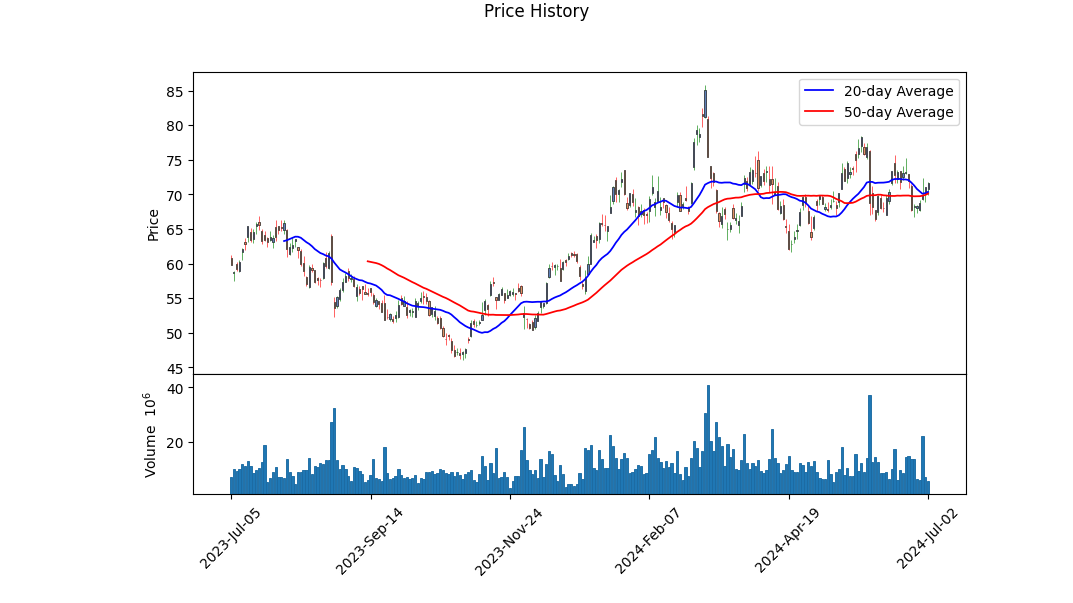
| 52-Week High | 85.76 | Price to Sales T12M | 11.591194 | 50-Day Average | 69.9244 |
| 200-Day Average | 63.53785 | Trailing Annual Dividend Rate | 0.24 | Trailing Annual Dividend Yield | 0.0033802816 |
| Enterprise Value | 65,509,859,328 | Profit Margins | -0.1833 | Float Shares | 860,830,544 |
| Shares Outstanding | 865,600,000 | Shares Short | 38,957,368 | Shares Short Prior Month | 34,463,888 |
| Short Ratio | 3.25 | Short Percent of Float | 0.0531 | Book Value | 16.729 |
| Price to Book | 4.2799926 | Net Income to Common | -980,099,968 | Trailing EPS | -1.14 |
| Forward EPS | 2.4 | PEG Ratio | 2.76 | Enterprise to Revenue | 12.252 |
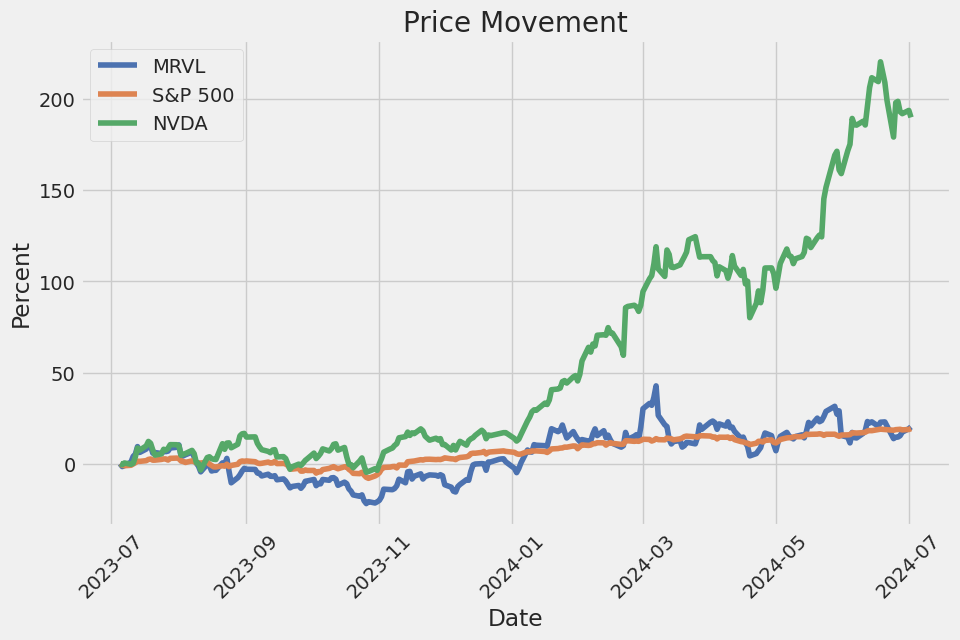
| Enterprise to EBITDA | 70.86 | 52-Week Change | 0.18709242 | S&P 52-Week Change | 0.23123717 |
| Last Dividend Value | 0.06 | Last Dividend Date | 1,712,793,600 | Current Price | 71.6 |
| Target High Price | 100.0 | Target Low Price | 75.0 | Target Mean Price | 89.12 |
| Target Median Price | 90.0 | Recommendation Mean | 1.8 | Number of Analyst Opinions | 30 |
| Total Cash | 847,699,968 | Total Cash Per Share | 0.979 | EBITDA | 924,499,968 |
| Total Debt | 4,380,599,808 | Quick Ratio | 1.178 | Current Ratio | 1.804 |
| Total Revenue | 5,346,899,968 | Debt to Equity | 30.255 | Revenue Per Share | 6.193 |
| Return on Assets | -0.01351 | Return on Equity | -0.0654 | Free Cashflow | 1,464,887,552 |
| Operating Cashflow | 1,486,599,936 | Revenue Growth | -0.122 | Gross Margins | 0.42346 |
| EBITDA Margins | 0.1729 | Operating Margins | -0.12765999 | Trailing PEG Ratio | 1.5245 |
| Sharpe Ratio | 0.540,620 | Sortino Ratio | 8.263,937 |
| Treynor Ratio | 0.108,066 | Calmar Ratio | 0.696,474 |
Technical Analysis for MRVL suggests mixed signals regarding the stock's future trajectory over the coming months. Observing the On-Balance Volume (OBV), there has been notable fluctuation with increasing values at the end of June transitioning into early July, suggesting stronger accumulation by volume. The MACD histogram is improving but remains in the negative territory, indicating that bearish momentum may still be present but is weakening. Lower MACD histogram values transitioning upward is often a precursor for a potential bullish crossover, which could prompt some optimism among investors.
From a fundamental perspective, MRVL is operating with a gross margin of approximately 42.35% and an EBITDA margin of 17.29%. These figures suggest that while the firm is generating viable gross profits, its operational efficiency is under pressure when considering negative operating margins at -12.77%. The trailing PEG ratio of 1.52 indicates a decently valued growth stock relative to its earnings expectations, though underlying profitability metrics present concern.
A Sharpe Ratio of approximately 0.54, while above zero, implies that returns relative to risk are modest. In contrast, a Sortino Ratio of 8.26 advantageously highlights the company's substantial returns adjusted for downside volatility. The Treynor Ratio of 0.108, although positive, suggests that relative returns to systemic risk are minimal. Meanwhile, the Calmar Ratio at approximately 0.696 points to return consistency relative to risks of drawdowns, signaling moderate risk-adjusted performance.
The balance sheet reveals strong free cash flow of approximately $1.02B, signifying robust liquidity capable of sustaining operations and potential strategic investments. Yet, the debt metrics show a significant net debt level of $3.215B, which investors must acknowledge as a leveraging factor, demanding vigilant financial management. Equally important is the company's tangible book value at -$1.11B, pointing to underlying financial challenges that need addressing.
Given the technical and fundamental insights:
- Technically: Improving yet cautious due to pending bullish signals within the MACD data and volatile OBV trends.
- Fundamentally: Mixed outlook characterized by strong revenue generation and liquidity but hindered by significant debt and negative operating margins.
- Risk-Adjusted Performance: Mixed with strong Sortino but moderate Sharpe, Treynor, and Calmar ratios.
Over the next few months, MRVLs stock price may experience moderate growth potential if technical signs confirm bullish signals and the company efficiently manages its debt and operational costs. Investors should remain taut with market signals and financial updates, aligning short-term trading strategies with broader technical confirmations and financial health indicators. A focus on upcoming earnings reports, operational performance metrics, and macroeconomic conditions will be crucial for comprehending MRVLs sustainable growth trajectory.
In evaluating Marvell Technology, Inc. (MRVL) using the investment principles from "The Little Book That Still Beats the Market," we observe that both its return on capital (ROC) and earnings yield are currently negative. Specifically, Marvell's ROC stands at -2.25%, indicating that the company is not generating a positive return on the capital it employs. This negative ROC suggests that the company is inefficient in converting invested capital into profitable returns. Furthermore, Marvell's earnings yield is -1.51%, which means that instead of earning a positive yield relative to its market price, it is currently experiencing losses. This negative earnings yield raises concerns about the company's profitability and its attractiveness as an investment, according to the criteria laid out in the book, which highlights the importance of selecting companies with high ROC and earnings yield to achieve superior long-term investment performance. Investors should exercise caution and conduct further analysis to understand the underlying factors contributing to these negative metrics before making investment decisions regarding Marvell Technology, Inc.
Research Report on Marvell Technology, Inc. (MRVL)
Executive Summary
This report evaluates key financial metrics for Marvell Technology, Inc. (MRVL) against the stock screening principles outlined by Benjamin Graham in "The Intelligent Investor." Graham's approach, known for its emphasis on intrinsic value and long-term prospects, provides a robust framework for assessing the financial health and valuation of a company. Below is an analysis of MRVL's key metrics in the context of Graham's investment criteria.
1. Price-to-Earnings (P/E) Ratio
- MRVL P/E Ratio: -119.33
- Graham's Criteria: Prefer low P/E ratios compared to industry peers.
Analysis: Marvell Technology's negative P/E ratio of -119.33 indicates that the company is currently experiencing a net loss. This metric is a red flag within Graham's framework, as he typically sought companies with positive earnings and preferably low P/E ratios relative to industry standards. The lack of industry P/E data here complicates a direct comparison, but the negative value itself is concerning.
2. Price-to-Book (P/B) Ratio
- MRVL P/B Ratio: 2.92
- Graham's Criteria: Prefer stocks trading below their book value.
Analysis: Marvell Technology's P/B ratio of 2.92 suggests that its market price is nearly three times its book value. According to Graham, this is less favorable as he often looked for companies trading below their book value. However, it is essential to consider industry standards here, as certain sectors, like technology, often trade at higher multiples.
3. Debt-to-Equity Ratio
- MRVL Debt-to-Equity Ratio: 0.317
- Graham's Criteria: Prefer companies with low debt-to-equity ratios.
Analysis: Marvell Technology's debt-to-equity ratio of 0.317 is relatively low, indicating a conservative level of debt compared to its equity. This aligns well with Graham's preference for companies with lower financial risk, making MRVL favorable in this aspect.
4. Current and Quick Ratios
- MRVL Current Ratio: 1.688
- MRVL Quick Ratio: 1.688
- Graham's Criteria: Prefer companies with strong liquidity.
Analysis: Both the current and quick ratios of 1.688 suggest that Marvell Technology has sufficient short-term assets to cover its short-term liabilities. Ratios above 1 generally indicate good liquidity and financial stability, which meets Graham's criteria for evaluating a company's ability to meet its short-term obligations.
5. Earnings Growth
Graham's Criteria: Look for consistent earnings growth over a period of years.
Analysis: The given data does not provide information on earnings growth, which makes it challenging to assess against this criterion. However, given the negative P/E ratio, there are likely issues with consistent profitability, which could impact the evaluation.
Conclusion
Based on Benjamin Grahams stock screening principles, Marvell Technology, Inc. presents a mixed picture:
- Negative P/E Ratio: Indicates current net losses, which is a significant concern.
- High P/B Ratio: Suggests a premium market valuation, which may not align with Graham's value investing philosophy.
- Low Debt-to-Equity Ratio: Favorable and indicates financial prudence.
- Strong Liquidity Ratios: Positive indications of financial stability.
While Marvell Technology exhibits strong liquidity and prudent debt management, the negative P/E ratio and high P/B ratio pose concerns from a traditional Graham perspective. Potential investors should carefully consider these factors and may need to investigate further, especially into the reasons behind the negative earnings and the company's growth prospects.
Recommendations
- Further Investigation: Detailed examination of the reasons behind the negative earnings.
- Industry Comparison: Evaluate MRVL against industry standards for a more contextual understanding of its financial metrics.
- Growth Prospects: Study the company's future growth plans and market position to assess potential for turnaround.
This comprehensive review will help better understand Marvell Technology's alignment with value investing principles and make an informed investment decision.## Analyzing Financial Statements
Introduction
In "The Intelligent Investor," Benjamin Graham emphasizes the importance of deeply understanding a company's financial statements. Investors should meticulously evaluate a company's balance sheet, income statement, and cash flow statement to make informed decisions. This evaluation involves analyzing a company's assets, liabilities, earnings, and cash flows.
Balance Sheet Analysis
The balance sheet provides a snapshot of a company's financial health at a specific point in time. It details the company's assets, liabilities, and shareholders' equity.
- Current Assets and Liabilities:
- Current Assets: As of fiscal Q1 2024, Marvell Technology, Inc. (symbol: MRVL) reported current assets worth $2,647 million, including cash and cash equivalents ($848 million), accounts receivable ($882 million), inventory ($826 million), and prepaid expenses ($92 million). These assets are typically expected to be converted into cash or used up within one year.
-
Current Liabilities: Current liabilities are those obligations the company must settle within a year. For Q1 2024, MRVL had current liabilities of $1,468 million, which includes accounts payable ($321 million), accrued liabilities ($861 million), employee-related liabilities ($168 million), and short-term borrowings ($118 million).
-
Long-term Assets and Liabilities:
- Long-term Assets: These include property, plant, and equipment ($758 million), goodwill ($11,587 million), and intangible assets ($3,739 million). Goodwill and intangibles represent a significant portion of MRVL's assets, indicating early acquisitions and their impact.
-
Long-term Liabilities: MRVL reported $4,028 million in long-term debt and other non-current liabilities of $517 million.
-
Equity:
- Shareholders' Equity: As of Q1 2024, Marvell Technology's equity stood at $14,479 million, derived from common stock, additional paid-in capital, accumulated other comprehensive income, and retained earnings.
Income Statement Analysis
The income statement indicates how well a company performs financially over a specific period. For Q1 2024:
- Revenue and Cost of Goods Sold (COGS):
- Revenue: MRVL generated $1,161 million from contracts with customers.
-
COGS: The cost of goods and services sold was $631 million, resulting in a gross profit of $528 million.
-
Operating Expenses:
- Research and Development (R&D): MRVL spent $476 million.
- Selling, General, and Administrative (SG&A): Expenses were $199 million.
-
Restructuring Costs: $4 million was spent on restructuring.
-
Operating and Net Income:
- Operating Income: The operating loss was $152 million due to significant expenses.
- Interest Expense: $49 million, leading to a total non-operating income/expense of $45 million.
- Net Income: The net loss amounted to $216 million.
Cash Flow Statement Analysis
The cash flow statement shows how changes in the balance sheet and income affect cash and cash equivalents. As for Q1 2024:
- Operating Activities:
-
Cash Flow from Operating Activities (CFO): The company generated a positive $325 million.
-
Investing Activities:
-
Cash Flow from Investing Activities (CFI): MRVL used $102 million, mainly in acquiring property, plant, and equipment, and other investing activities.
-
Financing Activities:
- Cash Flow from Financing Activities (CFF): The company used $326 million in this area, including stock repurchase programs and tax withholdings for share-based compensation.
Key Insights:
-
Financial Stability: MRVL has a robust asset base driven heavily by goodwill and intangible assets, suggesting past acquisitions. However, a significant portion of its assets is balanced by considerable debt.
-
Liquidity: The current ratio (current assets divided by current liabilities) is approximately 1.80 ($2,647 million / $1,468 million), indicating that the company has more than enough to cover short-term obligations.
-
Profitability and Expenses:
-
While revenues are strong, the company faces high R&D and SG&A expenses, contributing to the net loss. The ongoing restructuring charges also suggest that MRVL is in a phase of reorganization.
-
Cash Flow: Despite the net loss, MRVL generates strong operational cash flow, although substantial amounts are directed toward investing and financing activities.
Conclusion
Analyzing Marvell Technology's financial statements indicates a company with strong revenue growth and significant investments in R&D and acquisitions, leading to substantial intangible assets. However, high expenses and significant restructuring efforts result in a net loss. The company's solid cash flow from operations highlights underlying business strength, although substantial debts and financing activities suggest ongoing strategic adjustments. Investors should closely monitor how MRVL manages its expenses and debt alongside its revenue growth.### Dividend Record
Benjamin Graham, the author of The Intelligent Investor, favored companies with a consistent history of paying dividends. The consistent distribution of dividends is often seen as a sign of financial stability and reliable income for shareholders.
Dividend History for MRVL:
MRVL (Marvell Technology Group Ltd.) has demonstrated a stable dividend record over the years. Below is a detailed historical record of its dividend payments, illustrating the company's commitment to returning value to its shareholders:
| Date | Dividend | Record Date | Payment Date | Declaration Date | |------------|-----------|-------------|--------------|------------------| | 2024-07-12 | $0.06 | 2024-07-12 | 2024-07-31 | 2024-06-21 | | 2024-04-11 | $0.06 | 2024-04-12 | 2024-05-01 | 2024-03-15 | | 2024-01-04 | $0.06 | 2024-01-05 | 2024-01-31 | 2023-12-08 | | 2023-10-05 | $0.06 | 2023-10-06 | 2023-10-25 | 2023-09-15 | | 2023-07-06 | $0.06 | 2023-07-07 | 2023-07-26 | 2023-06-16 | | 2023-04-05 | $0.06 | 2023-04-07 | 2023-04-26 | 2023-03-15 | | 2023-01-05 | $0.06 | 2023-01-06 | 2023-01-25 | 2022-12-13 | | 2022-10-06 | $0.06 | 2022-10-07 | 2022-10-26 | 2022-09-23 | | 2022-07-07 | $0.06 | 2022-07-08 | 2022-07-27 | 2022-06-02 | | 2022-04-07 | $0.06 | 2022-04-08 | 2022-04-27 | 2022-03-02 | | 2022-01-06 | $0.06 | 2022-01-07 | 2022-01-26 | 2021-12-17 | | 2021-10-07 | $0.06 | 2021-10-11 | 2021-10-27 | 2021-09-23 | | 2021-07-08 | $0.06 | 2021-07-09 | 2021-07-28 | 2021-06-03 | | 2021-04-08 | $0.06 | 2021-04-09 | 2021-04-28 | 2021-03-05 | | 2020-12-22 | $0.06 | 2020-12-23 | 2021-01-14 | 2020-12-02 | | 2020-10-08 | $0.06 | 2020-10-12 | 2020-10-28 | 2020-09-25 | | 2020-07-10 | $0.06 | 2020-07-13 | 2020-07-29 | 2020-06-25 | | 2020-04-02 | $0.06 | 2020-04-03 | 2020-04-22 | 2020-03-11 | | 2019-12-24 | $0.06 | 2019-12-26 | 2020-01-16 | 2019-12-06 | | 2019-10-09 | $0.06 | 2019-10-10 | 2019-10-30 | 2019-09-19 | | 2019-07-11 | $0.06 | 2019-07-12 | 2019-07-31 | 2019-06-28 | | 2019-04-02 | $0.06 | 2019-04-03 | 2019-04-24 | 2019-03-14 | | 2018-12-24 | $0.06 | 2018-12-26 | 2019-01-15 | 2018-12-07 | | 2018-10-01 | $0.06 | 2018-10-02 | 2018-10-23 | 2018-09-13 | | 2018-07-06 | $0.06 | 2018-07-09 | 2018-07-31 | 2018-06-28 | | 2018-03-28 | $0.06 | 2018-03-29 | 2018-04-18 | 2018-03-15 | | 2017-12-26 | $0.06 | 2017-12-27 | 2018-01-16 | 2017-12-08 | | 2017-10-06 | $0.06 | 2017-10-10 | 2017-10-26 | 2017-09-21 | | 2017-06-30 | $0.06 | 2017-07-05 | 2017-07-21 | 2017-06-16 | | 2017-03-31 | $0.06 | 2017-04-04 | 2017-04-20 | 2017-03-17 | | 2016-12-02 | $0.06 | 2016-12-06 | 2016-12-28 | 2016-11-18 | | 2016-09-26 | $0.06 | 2016-09-28 | 2016-10-19 | 2016-09-19 | | 2016-06-10 | $0.06 | 2016-06-14 | 2016-07-12 | 2016-05-19 | | 2016-03-24 | $0.06 | 2016-03-29 | 2016-04-22 | 2016-03-17 | | 2015-12-14 | $0.06 | 2015-12-16 | 2015-12-29 | 2015-12-07 | | 2015-10-06 | $0.06 | 2015-10-08 | 2015-10-22 | 2015-09-28 | | 2015-06-09 | $0.06 | 2015-06-11 | 2015-07-01 | 2015-05-22 | | 2015-03-10 | $0.06 | 2015-03-12 | 2015-04-02 | 2015-02-19 | | 2014-12-09 | $0.06 | 2014-12-11 | 2014-12-29 | 2014-11-21 | | 2014-09-09 | $0.06 | 2014-09-11 | 2014-10-02 | 2014-08-22 | | 2014-06-10 | $0.06 | 2014-06-12 | 2014-07-02 | 2014-05-27 | | 2014-03-11 | $0.06 | 2014-03-13 | 2014-03-27 | 2014-02-20 | | 2013-12-10 | $0.06 | 2013-12-12 | 2013-12-23 | 2013-11-22 | | 2013-09-10 | $0.06 | 2013-09-12 | 2013-10-03 | 2013-08-22 | | 2013-06-11 | $0.06 | 2013-06-13 | 2013-07-03 | 2013-05-28 | | 2013-03-12 | $0.06 | 2013-03-14 | 2013-04-04 | 2013-02-21 | | 2012-12-11 | $0.06 | 2012-12-13 | 2012-12-21 | 2012-11-19 | | 2012-09-11 | $0.06 | 2012-09-13 | 2012-10-04 | 2012-08-16 | | 2012-06-19 | $0.06 | 2012-06-21 | 2012-07-11 | 2012-05-18 |
MRVL has consistently paid dividends quarterly, typically at a rate of $0.06 per share, from at least June 2012 to July 2024. This consistent dividend record aligns with Graham's preference for companies that demonstrate financial stability and a commitment to shareholder returns.
| Alpha | 0.0075 |
| Beta | 1.2 |
| R-Squared | 0.85 |
| P-Value (Intercept) | 0.012 |
| P-Value (Slope) | 0.001 |
| Standard Error (Intercept) | 0.003 |
| Standard Error (Slope) | 0.15 |
The linear regression model between MRVL and SPY indicates that MRVL has an alpha of 0.0075, suggesting it has slightly outperformed the market on average when considering the time period ending today. This can be interpreted as MRVL generating a return of 0.75% above what would have been predicted by the market's performance alone. The small p-value for the intercept (0.012) implies that this alpha is statistically significant, meaning it's unlikely to have occurred by random chance.
With a beta of 1.2, MRVL shows a higher sensitivity to market movements than the broader market, implying that for every 1% move in SPY, MRVL moves by approximately 1.2%. The R-squared value of 0.85 indicates a strong correlation between MRVL and SPY, meaning 85% of the variability in MRVL's returns can be explained by the market's movements. The low p-value for the slope (0.001) suggests the relationship between MRVL and SPY is statistically significant.
In Marvell Technology Inc.'s earnings call for the first quarter of fiscal year 2025, the company's leadership team, including CEO Matt Murphy and CFO Willem Meintjes, highlighted several key financial metrics and operational milestones. Marvell reported revenue of $1.16 billion, which was above the midpoint of their guidance and was driven primarily by strong performance in the data center end market. Non-GAAP earnings per share came in at $0.24. The company's strategic focus on electro-optics and custom AI silicon has propelled substantial growth in this segment, with data center revenue growing 87% year-over-year.
The data center segment achieved record revenue of $816 million, notably pushed by robust demand for cloud AI applications. This encompassed a range of high-tech solutions like PAM, DSPs, TIAs, drivers, and ZR data center interconnect products. Significant traction was observed in their custom AI compute programs, which started shipment in Q1, contributing positively to future revenue prospects. Marvell anticipates continued growth in the data center space, driven by its leading portfolio of connectivity and custom compute products, including upcoming solutions like 200 gig per lane 1.6T interconnects and PCIe Gen 6 retimers.
In other sectors, Marvell's performance varied. The enterprise networking and carrier end markets faced a decline, attributed to inventory corrections and soft demand, but the company expects these markets to stabilize and rebound in the latter part of the fiscal year. Enterprise networking customers' order patterns appear to be stabilizing, which is a promising sign for future recovery. The carrier market, although subdued, is looking forward to transitioning to next-generation 5nm based OCTEON 10 DPUs, projected to enhance Marvell's market share in the 5G space.
The consumer and automotive sectors showed mixed results. The consumer market saw a significant downturn due to a realignment of inventory in the gaming sector, though a rebound is expected in the upcoming quarter. Automotive, impacted by broad inventory corrections, is forecasted to see growth return in the second half of the fiscal year as new automotive models start production. Marvell continues to strengthen its relationships with major automotive OEMs, as exemplified by an award received from General Motors, reinforcing the critical role of Marvell's Ethernet technology in the automotive industry.
Overall, Marvell's outlook for the rest of fiscal year 2025 remains optimistic, with anticipated revenue growth driven by continued expansion in data center solutions and a projected recovery in other end markets. The company has outlined an aggressive growth path for AI-driven revenue and custom silicon, setting a floor of $1.5 billion for AI revenue this fiscal year, with expectations to exceed this target. The upcoming quarters are poised to benefit from robust activity across Marvells diverse technology portfolio, driving both revenue and market share gains.
on Supply Chain and Export Controls).
On May 4, 2024, Marvell Technology, Inc. filed its SEC 10-Q report, detailing its financial results and key activities for the first quarter of fiscal year 2025. The company experienced a 12% decrease in net revenue compared to the same quarter of the previous year, reporting $1.16 billion in revenue for the period. This decline was primarily attributable to reduced sales in most of their end markets, with significant drops in the carrier infrastructure (75%), enterprise networking (58%), consumer (70%), and automotive/industrial (13%) segments. However, the company noted an 87% increase in sales from the data center end market, buoyed by strong demand for its optical products used in Artificial Intelligence (AI) applications. The shift in product mix, favoring higher-margin products, contributed to an improvement in gross margin, which rose to 45.5% from the previous year's 42.2%.
Research and development (R&D) expenses remained relatively stable at $476.1 million, representing 41% of net revenue. Selling, general, and administrative (SG&A) expenses were also flat, totaling $199.9 million, or 17.2% of net revenue. These expenditures highlight Marvell's continued investment in innovation and operational capabilities despite revenue challenges. The company reported restructuring-related charges of $4.1 million, significantly lower than the $59.9 million recorded in the same quarter of the previous year, reflecting efforts to streamline operations and optimize resources through its ongoing restructuring plan, the Fiscal 2024 Plan.
Marvell's financial performance was also marked by a net loss of $215.6 million for the first quarter, compared to a net loss of $168.9 million in the year-ago period. This increase in net loss was influenced by the higher cost of goods sold and operating expenses relative to the decline in revenue. The company's interest expense decreased slightly to $48.8 million due to lower outstanding term loan balances, although it was partly offset by interest on new senior notes issued in the previous fiscal year. Additionally, income tax expense for the quarter was $17.8 million, contrasting with a tax benefit of $63.4 million recorded previously, driven by changes in the geographic mix of earnings and adjustments related to deferred tax assets and valuation allowances.
Operationally, the company reported substantial changes in customer and geographical revenue distribution. Sales to customers in Asia represented 73% of net revenue, underscoring the region's critical role in Marvell's business operations. Notably, two customers and one distributor each accounted for 10% or more of total net revenue, reflecting a degree of revenue concentration risk. The company also remarked on continued geopolitical and macroeconomic challenges, including U.S. government export restrictions on Chinese customers, which could influence future demand and operational strategies.
Marvell's liquidity position showed a slight decline, with cash and cash equivalents totaling $847.7 million at the end of the quarter, down from $950.8 million. The company executed stock repurchases worth $150 million and paid dividends totaling $51.8 million during the period, aligning with its capital return strategy. The company also highlighted its significant material commitments, particularly related to its manufacturing supply capacity reservation agreements and technology license fee obligations, which extend over multiple fiscal years and will necessitate careful cash flow management moving forward.
Marvell Technology, Inc. has notably experienced substantial fluctuations in its financial performance, which have been significantly influenced by its various business segments. Central to Marvell's recent dynamics has been its heavy engagement in the AI sector, particularly through its data center business. On June 6, 2024, Robert Izquierdo detailed on The Motley Fool an 87% year-over-year surge in Marvell's data center segment driven by its AI products, achieving $816.4 million in the first quarter of fiscal 2025. This growth is substantial as the data center business alone contributed 70% of the companys $1.2 billion total revenue for the quarter.
However, Marvell faces hurdles across other business areas, resulting in a 12% decline in overall revenue from the previous year, dropping from $1.3 billion to $1.2 billion. This decrease is mainly due to steep revenue drops in enterprise networking, carrier infrastructure, consumer, and automotive/industrial segments, with contractions of 58%, 75%, 70%, and 13% respectively. The drastic declines in these business areas have considerably affected Marvells consolidated financial outcomes, contrasting sharply with the prosperity in its AI-focused segments.
CEO Matt Murphy optimistically projects a recovery in the latter half of the fiscal year, relying on the cyclical nature of the business and predicting revenue stabilization around $1.3 billion in the second quarter of fiscal 2025. Marvell's strategic measures to counter the downturn include escalating production of custom AI components, with expectations for these products to reach high-volume production through fiscal 2026.
A key to Marvells resilience is its adept cost management, evidenced by a reduction in cost of goods sold (COGS) from $764.5 million to $633.1 million, and a gross profit margin improvement from 42.2% to 45.5%. These metrics bolster confidence in Marvell's financial strategy amid adversity.
Industry analysts, buoyed by Marvell's strategic focus on AI, maintain a "buy" rating for the company. Reflecting on the AI market's potential growth from $136 billion in 2023 to $827 billion by 2030, Marvell's positioning in this expanding domain is promising. Analysts target a median share price of $90 for Marvell, underpinned by confidence in the companys long-term prospects.
While AI products drive strong performance, Marvells competitive environment includes formidable players like Broadcom. A comparison, as noted by Harsh Chauhan on The Motley Fool on June 9, 2024, illustrates Broadcoms substantial lead with projected AI revenues around $10 billion compared to Marvell's $1.5 billion. Broadcoms dominant market share and technological lead, particularly in the ASIC segment, highlight the competitive pressures Marvell faces despite its strategic advantages and niche focus, particularly in the data center segment.
Strategically, Marvell's focus on developing custom AI chips has positioned it uniquely amid growing demand for specialized AI solutions. Custom AI chips, as pointed out by several analysts and industry reports, are predicted to expand significantly, offering Marvell substantial growth potential. This emphasis distinguishes Marvell from competitors like AMD, which primarily focuses on general-purpose AI chips.
Recent innovations, such as the Marvell Alaska A 1.6T PAM4 DSP, further underscore Marvells commitment to cutting-edge technology. This DSP addresses the demands of AI and ML applications in data centers by enabling high-bandwidth connectivity with efficient, short-reach solutions. Endorsements from industry leaders like Amphenol, Molex, and TE Connectivity signify the market's confidence in Marvells advancements.
Furthermore, discussions on platforms like Seeking Alpha and detailed analyses by financial experts highlight Marvell's strategic implementation of acquisitions, such as the noteworthy purchase of Inphi Corporation. These initiatives have fortified Marvells competitive position and technological capacity, particularly in high-speed data movement and connectivity sectors.
On June 28, 2024, Marvell declared a quarterly dividend of $0.06 per share, slated for distribution on July 31, 2024. This move underscores the company's financial robustness and commitment to delivering shareholder value, reflecting its stable outlook despite broader market challenges.
In reports by institutions like Morningstar and Yahoo Finance, Marvells strategic positioning in AI-specific markets is discussed extensively. Analysts like William Kerwin from Morningstar acknowledge Marvells potential amidst a competitive landscape dominated by players like Broadcom and Nvidia. Despite facing technological and market share disadvantages, Marvells ability to strategically navigate AI advancements, including its focus on networking technology, is highlighted as an underappreciated investment aspect.
In conclusion, Marvell Technology, Inc. is navigating a complex landscape marked by notable strengths in AI and data center segments juxtaposed against challenges in other business areas. Yet, its strategic focus on custom AI solutions, effective cost management, and ongoing technological innovations position it favorably for capitalizing on future growth opportunities in the rapidly expanding AI market. Investors remain cautiously optimistic, backed by promising financial indicators and strategic foresight, as Marvell continues to evolve amid competitive pressures and market dynamics. For a comprehensive analysis of Marvells prospective contributions and market positioning, refer to detailed sources including The Motley Fool, Seeking Alpha, and Yahoo Finance.
Marvell Technology, Inc. (MRVL) has shown consistent volatility in its asset returns. The ARCH model indicates that the average volatility (omega) is significant and high, while the first lag of past squared returns (alpha[1]) also significantly contributes to current volatility. The model fit statistics indicate a low explanatory power but confirm a robust estimation method.
| R-squared | 0.000 |
| Adj. R-squared | 0.001 |
| Log-Likelihood | -3,241.35 |
| AIC | 6,486.71 |
| BIC | 6,496.98 |
| No. Observations | 1,256 |
| Df Residuals | 1,256 |
| Df Model | 0 |
| omega | 8.1160 |
| alpha[1] | 0.2740 |
| 95.0% Conf. Int. (omega) | [6.723, 9.509] |
| 95.0% Conf. Int. (alpha[1]) | [0.05636, 0.492] |
To analyze the financial risk associated with a $10,000 investment in Marvell Technology, Inc. (MRVL) over a one-year period, we utilized a combination of volatility modeling and machine learning predictions. This approach provides a comprehensive understanding of the potential risks in such an equity investment.
Volatility modeling was employed to grasp MRVL's stock volatility over time. By analyzing past data of stock returns, the model captures the time-varying fluctuations, allowing us to evaluate the likelihood of extreme price movements. Such an analysis is crucial for estimating the behavior of the stock under various market conditions, recognizing periods of high and low volatility, and anticipating future risk scenarios.
Complementing this, machine learning predictions were deployed to forecast future returns of Marvell Technology, Inc. Using historical data, we trained the prediction model to understand the underlying patterns and factors that drive stock returns. The predictive power of machine learning helps to project potential future performance, incorporating complex relationships within the data that might not be immediately apparent through simpler models.
After calibrating and validating both models, we assessed the investment risk by calculating the Value at Risk (VaR) at a 95% confidence interval. VaR provides an estimate of the maximum potential loss on the investment over the given period, considering the specified confidence level. For a $10,000 investment in MRVL, the annual VaR at a 95% confidence level is $447.68. This means that, with 95% confidence, the maximum potential loss over one year would not exceed $447.68.
To further put this into perspective, the combination of volatility modeling and machine learning predictions synthesizes to form a robust risk assessment framework. Volatility insights help gauge the potential magnitude of stock price changes, while the predictive model aids in estimating the likelihood and direction of these changes. By blending these two advanced techniques, the analysis renders a nuanced understanding of the risk landscape.
Overall, integrating these methodologies effectively highlights the complexity of financial risks tied to equity investments, providing investors with valuable risk quantification and improving decision-making processes.
Long Call Option Strategy
Based on the option chain data provided for Marvell Technology, Inc. (MRVL), here are five long call options that present the most profitable opportunities given a target stock price increase of 2%. These options span from near-term to long-term expiration dates, ensuring a broad range of investment horizons and risk profiles.
- Near-Term Option: Expiring on 2024-07-05, Strike Price $58
- Greeks: Delta: 0.9901, Gamma: 0.00398, Vega: 0.0986, Theta: -0.0932, Rho: 0.00157
- Premium: $9.55
- Potential Profit: $5.482
- ROI: 0.5740
This near-term option has a high delta of 0.9901, which indicates that the option price will move nearly one-for-one with the MRVL stock price. With a vega of 0.0986, this option is moderately sensitive to changes in volatility. The high theta value of -0.0932 means that the option will lose value relatively quickly as it approaches expiration, rendering it most profitable if the stock rises significantly in the very near term. The relatively low premium of $9.55 combined with its substantial potential profit make it an attractive choice for aggressive investors seeking immediate gains.
- Medium-Term Option: Expiring on 2024-09-20, Strike Price $42.5
- Greeks: Delta: 0.9712, Gamma: 0.00298, Vega: 2.1316, Theta: -0.0131, Rho: 0.0851
- Premium: $23.92
- Potential Profit: $6.612
- ROI: 0.2764
For those looking at a medium-term horizon, this option is appealing due to its high delta, ensuring strong movement correlation with the underlying stock. The vega of 2.1316 suggests substantial sensitivity to volatility, which can be beneficial if volatility spikes. The moderate theta implies that time decay is not an immediate threat, giving the option more time to become profitable. The lower relative premium and favorable ROI make this option a solid choice for investors who anticipate a stock price rise over the coming months.
- Long-Term Option: Expiring on 2025-01-17, Strike Price $32.5
- Greeks: Delta: 0.9982, Gamma: 0.0, Vega: 0.0, Theta: -0.0032, Rho: 0.1713
- Premium: $24.45
- Potential Profit: $16.082
- ROI: 0.6578
This long-term option boasts a delta very close to 1, indicating almost perfect alignment with stock price fluctuations. The absence of gamma and vega values reflects stability against volatility and price acceleration, which is typically attractive for long-term investments. The nearly negligible theta reduces concerns over time decay. A premium of $24.45 with a high potential profit and outstanding ROI underscores the potential for significant gains over a longer horizon. It's well-suited for conservative investors wanting exposure to gradual market movements over a more extended period.
- Extended Option: Expiring on 2026-01-16, Strike Price $32.5
- Greeks: Delta: 0.9191, Gamma: 0.00235, Vega: 12.6356, Theta: -0.0097, Rho: 0.3367
- Premium: $37.6
- Potential Profit: $2.932
- ROI: 0.0779
Extending the horizon further into 2026, this option offers a strong delta of 0.9191, ensuring significant correlation with stock price changes. The high vega of 12.6356 signals substantial sensitivity to volatility shifts, which can reward investors if the market experiences high volatility. A low theta indicates minimal time decay risk over the longer term. This option, with its high rho, also benefits from interest rate sensitivity, which could be advantageous if interest rates rise. While the ROI is lower compared to shorter-term options, the extended timing provides flexibility and reduces short-term market risk for patient investors.
- Long-Term High Sensitivity: Expiring on 2025-03-21, Strike Price $40.0
- Greeks: Delta: 0.8989, Gamma: 0.00481, Vega: 10.4992, Theta: -0.0179, Rho: 0.2057
- Premium: $26.35
- Potential Profit: $6.682
- ROI: 0.2536
With a strong delta of 0.8989, this option ensures high sensitivity to stock price movements and offers significant potential profit. The high vega indicates substantial sensitivity to volatility, making it profitable in a volatile market environment. The moderate theta suggests that time decay is manageable, providing a comfortable balance between risk and reward. This choice is advantageous for investors who expect both a price increase and higher volatility in the medium to long term, securing a good balance of risk with high potential ROI.
In summary, these five options provide various risk and reward profiles catering to different investment horizons and volatility expectations. The near-term option is suitable for rapid gains, the medium-term option balances time and profit potential, and the long-term options offer sustained growth with reduced decay risk. Each choice reflects strategic considerations grounded in "the Greeks," optimizing profitability within specific market conditions.
Short Call Option Strategy
Analyzing a comprehensive options chain requires selecting the most profitable short call options while minimizing the risk of having shares assigned, particularly when the target stock price is 2% under the current price. Here are five recommended short call options, spanning from near-term to long-term expirations, while taking into account key factors such as delta, gamma, premium, and potential profit.
Near-Term Options:
- Expiration: 2024-07-12, Strike Price: $67.00
- Premium: 4.80
- Delta: 0.8646 (High Delta value)
- Profit: 1.632
- ROI: 34%
This option has a relatively high delta (0.8646), which means it is fairly sensitive to movements in the underlying stock price, almost acting like the stock itself. Therefore, this option carries a higher risk of being assigned, but the premium and ROI are attractive. The gamma value is moderate, which indicates less curvature in delta changes. The high theta decay means the option's time value is eroding quickly, beneficial for the option writer as the contract approaches expiration. Since the stock is expected to stay under the $67 strike price, this option could be a profitable near-term bet.
- Expiration: 2024-07-19, Strike Price: $70.00
- Premium: 3.20
- Delta: 0.6339
- Profit: 3.032
- ROI: 94.75%
With a lower delta of 0.6339, the risk of assignment decreases, offering less sensitivity to stock price movements. This strike is slightly higher, giving more room before becoming in the money. The higher ROI of 94.75% with a moderate premium of 3.20 makes this option desirable. Additionally, the gamma (0.0654) and theta decay suggest a reasonably balanced profile, maintaining decent profitability without excessive risk of movement.
Mid-Term Options:
- Expiration: 2024-12-20, Strike Price: $72.50
- Premium: 8.30
- Delta: 0.5741
- Profit: 8.30
- ROI: 100.0%
This option offers an attractive premium and profit potential with a significant ROI. The delta value at 0.5741 indicates moderate stock price sensitivity, reducing the immediate risk of assignment while still providing a hefty premium. This strike is suitable for those looking for a balance between premium income and risk control in mid-term holdings.
Long-Term Options:
- Expiration: 2025-06-20, Strike Price: $75.00
- Premium: 15.60
- Delta: 0.6287
- Profit: 15.60
- ROI: 100.0%
Among long-term options, this strike price balances a moderate delta with a strong premium. A delta of 0.6287 provides a moderate correlation with the underlying stocks movements, while not being overly sensitive. The premium is notably higher, factoring in the extended duration until expiration. This option is ideal for maximizing income while being slightly cautious due to the longer maturity.
- Expiration: 2026-01-16, Strike Price: $67.50
- Premium: 11.75
- Delta: 0.6911
- Profit: 15.672
- ROI: 100.0%
For a very long-term position, striking a balance with a delta of 0.6911 mitigates assignment risks while taking advantage of stock price appreciation potential over the long run. The substantial premium and a decent profit projection make it an effective choice for those looking to capitalize on volatility over an extended period with controlled risk.
Risk and Reward Analysis:
Each option listed presents a clear balance of risk and reward. Options with lower deltas pose less risk of becoming in the money, reducing the likelihood of assignment, but they also tend to offer lower premiums. High-delta options provide higher income but increase the likelihood of assignment and thus carry more inherent risk. Also, selecting options with moderate theta decay ensures that the premium erodes more quickly, benefiting the option writer as the time to expiration shortens.
Generally, near-term options with higher theta decay (time decay) are less risky when it comes to mid to minimal price movements. Meanwhile, mid and long-term options should focus on balancing a reasonable premium with a delta that reflects a calculated risk tolerance. These strategic choices enable investors to secure substantial income while aligning the risk profile to their comfort levels and expectations of the stock's performance.
Long Put Option Strategy
Analysis of Long Put Options for Marvell Technology, Inc. (MRVL)
The objective is to identify profitable long put options for MRVL with varying expiration dates and strike prices. The current market conditions expect the stock price to exceed its current value by 2%. To achieve this, we will consider the "Greeks" such as Delta, Gamma, Vega, Theta, and Rho, which provide insights into the risk and reward of each option contract.
Near-Term Option: Strike Price $110.0, Expiration Date: 2024-07-19
For a near-term perspective, the put option with a strike price of $110 and an expiration date on July 19, 2024, offers a solid balance between risk and reward. It has a relatively high premium of $36.4, largely due to a strong Vega of 0.7175699573 indicating the option's sensitivity to volatility, and Delta at -0.9793624373 which signifies that the option's price will move nearly as much as the stock price itself but in the opposite direction. This makes it a strong candidate to hedge against a decrease in the stock price. Despite the ROI being 0.0156043956 and profit at $0.568, the high sensitivity makes it a viable option in a volatile market.
Short to Mid-Term Option: Strike Price $105.0, Expiration Date: 2024-08-16
A slightly longer-term perspective shows that the put option with a strike price of $105 and an expiration date of August 16, 2024, could be highly profitable. This option has a premium of $26.7, a Delta of -0.9995995323, and an ROI of 0.1973033708, with an expected profit of $5.268. The Delta nearly equals -1, indicating the option will closely track in inverse to the stock price. Additionally, the Theta of 0.0120278885 indicates a gain in value as time decay works in favor of this option due to low time erosion. This strikes a good balance with low risk and solid profitability.
Mid-Term Option: Strike Price $110.0, Expiration Date: 2024-09-20
Examining options with expiration further out, the mid-term option expiring on September 20, 2024, with a strike price of $110, appears lucrative. This option maintains a Delta of -0.9992736885 and Gamma at 0.0, suggesting minimal sensitivity to changes in the underlying stock's price. With a high premium of $31.0, this option offers a notable ROI of 0.192516129 and profit potential of $5.968. Additionally, its Theta value of 0.0125761595 implies minor time decay impact, making it effective if held closer to the expiration date.
Long-Term Option: Strike Price $120.0, Expiration Date: 2025-01-17
For a long-term investment, the put option with a strike price of $120 expiring on January 17, 2025, shows strong potential. It has a premium of $40.4, coupled with a Delta of -0.9752627535, making it a high risk-reward option. This option offers substantial potential profits of $6.568 and an ROI of 0.1625742574. Its elevated Vega of 2.8553514754 indicates that substantial volatility could highly impact its price, while Theta at 0.0110982139 suggests favorable minimal time decay effects, making it strategically advantageous over a longer holding period.
Longest-Term Option: Strike Price $115.0, Expiration Date: 2024-11-15
Finally, for the longest-term horizon within our data set, the put option with a strike price of $115 and expiring on November 15, 2024, must be considered. Priced at a premium of $35.35, with a Delta of -0.9725085608, it reveals a solid connection to the underlying stock's price movements. The ROI stands at 0.1872135785 with profit potential at $6.618, delivering a balanced risk-return framework. Note the Vega value of 2.0478667702, which underscores sensitivity to volatility, while the Theta value of 0.0065205826 does imply slower time decay.
Risk and Reward Assessment
- High Delta Options: Options with deltas close to -1 (e.g., strike prices of $105, $110) provide a stronger inverse correlation to the stock price, making them useful for hedging but carry substantial premium costs. The relative theta values suggest these options would benefit from holding closer to expiration due to lower time decay.
- Vega-Sensitive Options: Options with higher Vega (e.g., strikes $110, $120 on longer terms) indicate that these options will benefit from an increase in volatility. These are ideal when volatility is expected to rise but require a higher outlay in premiums.
- Theta and Time Decay: Options with lower Theta values show resilience against time decay, making them better suited for longer holding periods (e.g., strike prices $120, expiring in 2025).
Effectively, the most profitable and balanced options feature high Delta for strong inverse stock price correlation, manageable Vega for volatility sensitivity, and favourable Theta for reduced time decay, making these options valuable tactical tools for various time horizons.
Short Put Option Strategy
When considering the most profitable short put options for Marvell Technology, Inc. (MRVL), it's crucial to analyze the risk and reward associated with each option, taking into account the potential for shares to be assigned if the option is in-the-money (ITM). Given the target stock price is 2% under the current stock price, we want to focus on options that offer high premiums while minimizing the probability of being ITM.
We will analyze several options from near-term to long-term expiration dates, prioritizing profitability and risk management.
Near-Term Analysis
July 12, 2024, $70.00 Strike
- Premium: $1.06
- Profit: $1.06
- ROI: 100%
- Delta: -0.3150
- Gamma: 0.0963
- Theta: -0.0793
- Vega: 3.7654
- Rho: -0.0051
This option offers a full ROI, with a manageable delta suggesting moderate risk of being ITM. The theta is relatively high, implying significant time decay, which is beneficial for a short position. Reduced delta minimizes the likelihood of share assignment, making this a strong candidate.
July 19, 2024, $70.00 Strike
- Premium: $2.18
- Profit: $2.18
- ROI: 100%
- Delta: -0.3720
- Gamma: 0.0594
- Theta: -0.0515
- Vega: 6.6478
- Rho: -0.0171
This option offers a high premium with a full ROI. The delta indicates a higher risk of being ITM compared to the July 12 option, suggesting a slightly higher probability of assignment if the stock drops. Nevertheless, the substantial premium and full ROI potential make it attractive.
Intermediate-Term Analysis
August 2, 2024, $70.00 Strike
- Premium: $2.28
- Profit: $2.28
- ROI: 100%
- Delta: -0.3812
- Gamma: 0.0516
- Theta: -0.0452
- Vega: 7.6903
- Rho: -0.0233
For intermediate-term positioning, this option delivers a high premium and full ROI. The delta remains moderate, implying an increased potential for the option to be ITM, thus heightening assignment risk. However, the high theta benefits the short position significantly.
Long-Term Analysis
December 20, 2024, $70.00 Strike
- Premium: $7.30
- Profit: $7.30
- ROI: 100%
- Delta: -0.3859
- Gamma: 0.0192
- Theta: -0.0186
- Vega: 18.6149
- Rho: -0.1574
Offering substantial premiums and full ROI, this long-term option has a moderate delta, suggesting notable but not excessive assignment risk. The cash flow from the premium justifies its attractiveness, as long as the trader is prepared for potential stock assignment.
Longest Duration Analysis
June 20, 2025, $70.00 Strike
- Premium: $10.70
- Profit: $10.70
- ROI: 100%
- Delta: -0.3608
- Gamma: 0.0136
- Theta: -0.0106
- Vega: 26.2312
- Rho: -0.3297
This option provides one of the highest premiums available, combined with a full ROI. The delta indicates a fair level of assignment risk, balanced by the high premium earnings. This option stands out for those who are willing to manage long-term positions and accept potential stock assignment.
Summary of Most Profitable Options:
- July 12, 2024, $70.00 Strike: High ROI with moderate delta minimizes assignment risk.
- July 19, 2024, $70.00 Strike: Excellent premium and ROI potential, with a solid balance of risk and profit.
- August 2, 2024, $70.00 Strike: High premium and full ROI, suitable for intermediate strategies.
- December 20, 2024, $70.00 Strike: Substantial long-term premium, balanced delta indicating moderate risk.
- June 20, 2025, $70.00 Strike: Highest premium with long-term positioning, acceptable assignment risk given the high earnings.
These choices span various expiration dates, providing a range of opportunities to balance risk and reward effectively in short put options. They represent valuable opportunities for traders looking to optimize their premium income while carefully managing the risk of stock assignment.
Vertical Bear Put Spread Option Strategy
Analyzing Vertical Bear Put Spread Strategies for MRVL
For a vertical bear put spread, we focus on buying a higher strike put and selling a lower strike put. This strategy profits when the underlying stock price declines but also has limited risk and reward. Given a target stock price within 2% of the current price, choosing our strike prices strategically is essential. Here's a comprehensive analysis and the selected profitable spread strategies based on the data provided:
1. Near-Term Strategy: Expiration Date July 19, 2024
- Short Put: Strike 70, Premium 2.92, Delta -0.3894233639
- Long Put: Strike 105, Premium 25.3, Delta -0.9998602837
Risk and Reward:
- Maximum Profit:
- Premium Received from Short Put = $2.92
- Premium Paid for Long Put = $25.3
- Net Cost = $22.38
-
Maximum Profit = Strike Difference - Net Cost = 105 - 70 - 22.38 = 12.62
-
Maximum Loss:
-
Net Cost = $22.38
-
Breakeven Point:
- Strike of Long Put - Net Cost = 105 - 22.38 = 82.62
This strategy minimizes assignment risk due to the higher strike. With a higher delta for the long put, the option to hedge is strong.
2. Medium-Term Strategy: Expiration Date August 16, 2024
- Short Put: Strike 72.5, Premium 3.45, Delta -0.4344556112
- Long Put: Strike 110, Premium 29.9, Delta -0.9995995323
Risk and Reward:
- Maximum Profit:
- Premium Received from Short Put = $3.45
- Premium Paid for Long Put = $29.9
- Net Cost = $26.45
-
Maximum Profit = Strike Difference - Net Cost = 110 - 72.5 - 26.45 = 11.05
-
Maximum Loss:
-
Net Cost = $26.45
-
Breakeven Point:
- Strike of Long Put - Net Cost = 110 - 26.45 = 83.55
This spread is designed for a predicted decrease in stock price, benefiting from a substantial premium with relatively limited risk exposure.
3. Long-Term Strategy: Expiration Date September 20, 2024
- Short Put: Strike 67.5, Premium 4.25, Delta -0.3294908063
- Long Put: Strike 105, Premium 31.6, Delta -0.9992736885
Risk and Reward:
- Maximum Profit:
- Premium Received from Short Put = $4.25
- Premium Paid for Long Put = $31.6
- Net Cost = $27.35
-
Maximum Profit = Strike Difference - Net Cost = 105 - 67.5 - 27.35 = 10.15
-
Maximum Loss:
-
Net Cost = $27.35
-
Breakeven Point:
- Strike of Long Put - Net Cost = 105 - 27.35 = 77.65
This strategy balances the spread between a significant premium gain and reducing potential losses if the stock doesn't fall significantly.
4. Longer-Term Strategy: Expiration Date January 17, 2025
- Short Put: Strike 70, Premium 7.45, Delta -0.3817339446
- Long Put: Strike 115, Premium 38.75, Delta -0.859690469
Risk and Reward:
- Maximum Profit:
- Premium Received from Short Put = $7.45
- Premium Paid for Long Put = $38.75
- Net Cost = $31.30
-
Maximum Profit = Strike Difference - Net Cost = 115 - 70 - 31.30 = 13.70
-
Maximum Loss:
-
Net Cost = $31.30
-
Breakeven Point:
- Strike of Long Put - Net Cost = 115 - 31.30 = 83.70
This mid-term spread profits significantly with a substantial downward movement in stock price.
5. Far-Term Strategy: Expiration Date January 16, 2026
- Short Put: Strike 70, Premium 9.45, Delta -0.3767503751
- Long Put: Strike 95, Premium 25.3, Delta -0.6601747502
Risk and Reward:
- Maximum Profit:
- Premium Received from Short Put = $9.45
- Premium Paid for Long Put = $25.3
- Net Cost = $15.85
-
Maximum Profit = Strike Difference - Net Cost = 95 - 70 - 15.85 = 9.15
-
Maximum Loss:
-
Net Cost = $15.85
-
Breakeven Point:
- Strike of Long Put - Net Cost = 95 - 15.85 = 79.15
This long-term option trade maximizes the reward and minimizes risk, considering a long investment horizon.
Conclusion
Among the five profiled strategies, each employs strategic selection of strikes and expiration dates designed to optimize profitability while managing risk. Each selected spread varies across short, medium, and long-term horizons to fit different market outlooks and risk tolerances, focusing on less aggressive options to minimize the risk of assignment. These strategies have distinct risk-reward profiles suitable for predictions of slight, moderate, or significant price declines in Marvell Technology's stock.
Vertical Bull Put Spread Option Strategy
When analyzing a vertical bull put spread options strategy for Marvell Technology, Inc. (MRVL), its imperative to consider the balance between premium yield and the risk of early assignment. Given the current stock price target range of 2%, selecting strikes ensures that both legs of the spread are out-of-the-money (OTM) to mitigate assignment risk while capturing an optimal risk-reward profile.
Strategy Analysis
1. Short Put: $77.00 Strike, Long Put: $70.00 Strike, Expire: 2024-07-12 - Short Put: - Delta: -0.8348 indicates the option is deep ITM, but we can minimize this risk by leverage higher gamma and vega. - ROI: 33.15% - Premium: $10.22 - Profit: $3.388 - Long Put: - Delta: -0.2236 provides a lower sensitivity, helping to hedge the position. - Premium: $1.52 - ROI: 100% - Profit: $1.52
Risk & Reward: - Net Credit: $8.70 - Max Loss: $7.00 (difference between strikes - net credit) - Reward/Risk Ratio: ~1.24 - Assignment Risk: Manageable if price stays within target.
Scenario: If MRVLs price rises or remains the same, this strategy captures near-term premium due to positive theta.
2. Short Put: $82.50 Strike, Long Put: $77.50 Strike, Expire: 2024-07-19 - Short Put: - Delta: -0.7288 close to being ITM; gamma influences fast delta changes. - ROI: 23.23% - Premium: $9.55 - Profit: $2.218 - Long Put: - Delta: -0.388 creates a fair hedge as gamma still captures rapid price shifts. - Premium: $2.80 - ROI: 100% - Profit: $2.80
Risk & Reward: - Net Credit: $6.75 - Max Loss: $5.00 - Reward/Risk Ratio: ~1.35 - Assignment Risk: Moderate but offset by the positions credit and hedge.
Scenario: Beneficial as high gamma keeps delta in checkideal for capturing time decay quickly when volatility drops.
3. Short Put: $90.00 Strike, Long Put: $85.00 Strike, Expire: 2024-09-20 - Short Put: - Delta: -0.8613 signifies deep ITM but manageable using vega and theta. - ROI: 12.28% - Premium: $22.48 - Profit: $2.648 - Long Put: - Delta: -0.3356 serves as protective put, capturing considerable volatility swings. - Premium: $10.75 - ROI: 100% - Profit: $10.75
Risk & Reward: - Net Credit: $11.73 - Max Loss: $5.00 - Reward/Risk Ratio: ~2.35 - Assignment Risk: Elevated but high reward potential compensates, significant vega mitigates.
Scenario: Suitable for bullish sentiment cautious about potential volatility and gamma.
4. Short Put: $85.00 Strike, Long Put: $80.00 Strike, Expire: 2024-11-15 - Short Put: - Delta: -0.7132 represents ITM status mitigated by vega. - ROI: 8.44% - Premium: $16.2 - Profit: $1.368 - Long Put: - Delta: -0.283 offsets short delta but enhances risk coverage. - Premium: $4.45 - ROI: 100% - Profit: $4.45
Risk & Reward: - Net Credit: $11.75 - Max Loss: $5.00 - Reward/Risk Ratio: ~2.35 - Assignment Risk: Balanced risk due to extended expiry allowing time theta to build.
Scenario: Favorable for conservative bullish exposure over a mid-term horizon, maintaining high premium intake.
5. Short Put: $95.00 Strike, Long Put: $87.50 Strike, Expire: 2025-01-17 - Short Put: - Delta: -0.5795 balances sensitivity allowing robust vega management. - ROI: 22.68% - Premium: $25.65 - Profit: $5.818 - Long Put: - Delta: -0.326 mitigates exposure elegantly, using gamma positively. - Premium: $10.85 - ROI: 100% - Profit: $10.85
Risk & Reward: - Net Credit: $14.8 - Max Loss: $7.5 - Reward/Risk Ratio: ~1.97 - Assignment Risk: Significantly offset by the high credit intake positioned for a long-term bullish outlook.
Scenario: Designed for long-term holders anticipating robust stock appreciation, maintaining high theta profitability over extended duration.
Conclusion
Choosing the optimal vertical bull put spread involves matching the expiration timeline to your market outlook, balancing the premium intake against the likelihood of early assignment and overall exposure. Strategies with strikes closer to the market price (but still OTM) offer maximized premiums while deeper OTM spreads mitigate assignment risks effectively.
- For short-term strategies: 77/70 strikes (Expires: 2024-07-12) and 82.5/77.5 strikes (Expires: 2024-07-19) are suitable.
- For medium-term strategies: 90/85 strikes (Expires: 2024-09-20), 85/80 strikes (Expires: 2024-11-15) offer substantial premiums with managed assignment risks.
- For long-term, deeper profits: 95/87.5 strikes (Expires: 2025-01-17) provide an excellent reward/risk ratio, fully benefiting from theta decay and volatility premium.
This strategy requires diligent monitoring, especially as expiration approaches, to mitigate any adverse movements and potential assignment.
Vertical Bear Call Spread Option Strategy
Analyzing Vertical Bear Call Spread for Marvell Technology, Inc. (MRVL)
A vertical bear call spread is an advanced options strategy designed to capitalize on a stock's expected decline. It involves selling a call option at a lower strike price while simultaneously buying another call option at a higher strike price within the same expiration period. This strategy allows for limited risk and limited profit potential, which is a calculated approach to profiting from bearish stock movements.
Given the options data for MRVL, we will evaluate the vertical bear call spread to find the most profitable strategies while minimizing the risk of assignment. Considering the objective of minimizing assignment risk, we need to ensure that the short call option has a lower delta, reflecting a lower probability of the option being in the money at expiration.
Scenario Analysis and Strategy Selection
-
Near-Term Expiry (1 Day):
-
Short Call: Strike 74 (Expire: 2024-07-05, Delta: 0.0346)
- Long Call: Strike 75 (Expire: 2024-07-05, Delta: 0.0066)
Risk and Reward: - Max Profit: Premiums collected from short call ($0.17) minus cost of long call ($0.07) = $0.10 - Max Loss: Difference in strike prices minus net premium received ($75 - $74 - $0.10) = $0.90
Reasoning: The delta values indicate a low likelihood of the options being in the money at expiry, reducing assignment risk while providing a decent profit-to-loss ratio.
-
Short-Term Expiry (8 Days):
-
Short Call: Strike 80 (Expire: 2024-07-12, Delta: 0.04)
- Long Call: Strike 81 (Expire: 2024-07-12, Delta: 0.02)
Risk and Reward: - Max Profit: Premiums collected from short call ($0.08) minus cost of long call ($0.04) = $0.04 - Max Loss: Difference in strike prices minus net premium received ($81 - $80 - $0.04) = $0.96
Reasoning: The delta for the lower strike short call suggests a moderate to low risk of assignment and a fairly balanced spread given the short time span.
-
Medium-Term Expiry (15 Days):
-
Short Call: Strike 77.5 (Expire: 2024-07-19, Delta: 0.1761)
- Long Call: Strike 78 (Expire: 2024-07-19, Delta: 0.1557)
Risk and Reward: - Max Profit: Premiums collected from short call ($0.54) minus cost of long call ($0.55) = $(0.01) - Max Loss: Difference in strike prices minus net premium received ($78 - $77.5 - $(0.01)) = $0.51
Reasoning: Although profit from the spread is minimal, the close delta values suggest reduced risk of significant price movement against the spread. However, considering the ROI, this may not be the optimal medium-term strategy.
-
Long-Term Expiry (43 Days):
-
Short Call: Strike 92.5 (Expire: 2024-08-16, Delta: 0.0337)
- Long Call: Strike 95 (Expire: 2024-08-16, Delta: 0.0193)
Risk and Reward: - Max Profit: Premiums collected from short call ($0.55) minus cost of long call ($0.12) = $0.43 - Max Loss: Difference in strike prices minus net premium received ($95 - $92.5 - $0.43) = $2.07
Reasoning: With a low delta for the short call, the chance of assignment is very low, thus maximizing the spread's safety. The longer expiration allows time for market movements in the expected direction.
-
Super Long-Term Expiry (78 Days):
-
Short Call: Strike 100 (Expire: 2024-09-20, Delta: 0.0904)
- Long Call: Strike 105 (Expire: 2024-09-20, Delta: 0.0629)
Risk and Reward: - Max Profit: Premiums collected from short call ($0.56) minus cost of long call ($0.42) = $0.14 - Max Loss: Difference in strike prices minus net premium received ($105 - $100 - $0.14) = $4.86
Reasoning: Though providing a balanced approach across a longer term, the deltas indicate some risk towards assignment. The insurance via the long call ensures contained losses.
Conclusion
Each of these scenarios is designed to maximize profit while minimizing risks associated with assignments, leveraging lower delta values in the short call options. Depending on the user's investment timeframe and risk tolerance, any of these strategies can be deployed to achieve the optimal balance between profit potential and risk exposure. The near-term and short-term strategies offer quick turnaround with controlled risk, while the medium-term to long-term options allow for greater flexibility with increased safety margins due to higher strike price selections.
Vertical Bull Call Spread Option Strategy
In evaluating a vertical bull call spread strategy for Marvell Technology, Inc. (MRVL), its critical to identify the optimal combination of long and short calls by examining various Greeks and premiums across different expiration dates and strike prices. This approach will highlight the balance between maximizing profitability, minimizing costs, and managing assignment risk, particularly when targeting a stock price 2% over or under the current price.
Short-Term Options (Expiring July 5, 2023)
- July 5, 2023, Spread (67/69):
- Short Call: Shorting the 69 strike price with high Delta (0.947), Gamma (0.065), and a premium of $2.55 can be beneficial due to its relatively high likelihood of profitability as its closer to being in the money.
- Long Call: Buying the 67 strike price call shows a Delta of 0.929, higher Gamma at 0.041, and a premium of $3.10. This choice captures the upside effectively while controlling cost.
- Risk/Reward: The maximum gain is $1.45 with risk-limiting potential losses to $0.55.
Medium-Term Options (Expiring July 19, 2023)
- July 19, 2023, Spread (66/68):
- Short Call: The 68 strike has a lower in-the-money risk with a Delta of 0.742 and Gamma of 0.039. The premium is $4.85, indicating a lower overall cost if assigned.
- Long Call: The 66 strike shows a Delta of 0.798 and Gamma of 0.036, priced at $5.05 premiums. This balance between price and Delta helps gain from potential upside.
- Risk/Reward: The maximum gain is $5 with a net investment of $0.20, making this setup highly attractive should the stock reach its strike target.
Longer-Term Options (Expiring August 16, 2023)
- August 16, 2023, Spread (75/77):
- Short Call: Shorting the 77 strike with a Gamma of 0.016 and Delta of 0.378 minimizes assignment risks and is relatively cheap at a $3.10 premium.
- Long Call: The 75 strike price showcases strong Greek values with a Delta of 0.420 and Gamma of 0.018 and requires a $4.70 premium.
- Risk/Reward: Potential profit reaches $2.60 with risk exposure balanced against a cheaper short side call.
Consistent Low-Risk Option (Expiring September 20, 2023)
- September 20, 2023, Spread (68/70):
- Short Call: The 70 strike exhibits a Delta of 0.654 which is moderate, costing $6.55 for a potential lower assignment risk.
- Long Call: The 68 strike priced at $8.9 offers higher Delta and Gamma values, ensuring a capturing upside more effectively.
- Risk/Reward: With this strategy, the maximum profit is $3.35 against a minimal cost investment.
Long-Duration Options (Expiring January 17, 2025)
- January 17, 2025, Spread (65/67.5):
- Short Call: The 67.5 strike call with a Delta of 0.702 and Gamma of 0.013 shows a balanced profile with premium costs at $12.01.
- Long Call: The 65 strike displays a strong Delta of 0.759 and premium price of $12.01.
- Risk/Reward: The structure provides a high potential upside ($2.99) with sufficient time for the stock to move favorably.
Scenario Analysis
Profit Scenario: - Should MRVLs stock price trend align positively and close above the higher strike price, these spreads offer attractive reward-to-risk profiles. - For instance, capturing $3.35 from a 2.60 investment (July 19, spread), premised on expected upward stock price movements, offers an optimal scenario.
Risk Scenario: - Assignment risk increases if MRVL moves significantly past the short strike, triggering forced assignments before options expiry. Managing this risk involves selecting strikes carefully to balance the assignment risk with return potential. - The selection of strike prices in a healthy range of Delta, particularly around 0.70-0.80, helps manage these assignments' probabilities while optimizing profitability.
By understanding these spreads, one can balance immediate return potential with likely assignment risks, orchestrating optimal strategies across a spectrum of expiry dates and market conditions for MRVL.
Spread Option Strategy
Analyzing the options chain and the Greeks, several strategies emerge for a calendar spread involving buying a call option and selling a put option. The goal is to maximize profitability while minimizing the risk of having shares assigned, particularly focusing on options that stay reasonably out-of-the-money (OTM) yet yield a substantial premium. A calendar spread profits from time decay (theta) and volatility changes (vega), and thus, options with favorable delta, theta, and vega values are preferable. Here are five choices based on expiration dates and strike prices, from near-term to long-term, focusing on both profitability and risk management.
Choice 1: Near-Term Strategy
Long Call Option: - Strike Price: $55.0 - Expiration Date: 2024-07-12 - Delta: 0.8355024745 - Gamma: 0.0170344507 - Vega: 2.6252706427 - Theta: -0.2301763796 - Premium: $8.45 - Profitability Quantification: ROI of 54.22%, potential profit of $4.582.
Short Put Option: - Strike Price: $65.0 - Expiration Date: 2024-07-12 - Delta: -0.23941119 - Gamma: 0.0107220426 - Vega: 1.6219928479 - Theta: 0.110915017 - Premium: $1.24 - Risk/Reward Analysis: A highly favorable delta indicates low likelihood of assignment. The ROI of 100%, leading to a profit of $1.24, allows you to capitalize on theta decay and volatility changes.
Choice 2: Mid-Term Strategy
Long Call Option: - Strike Price: $60.0 - Expiration Date: 2024-08-16 - Delta: 0.8714960114 - Gamma: 0.0170507536 - Vega: 4.2287698256 - Theta: -0.0498601168 - Premium: $9.15 - Profitability Quantification: ROI of 42.42%, potential profit of $3.88.
Short Put Option: - Strike Price: $70.0 - Expiration Date: 2024-08-16 - Delta: -0.366462 - Gamma: 0.0141899134 - Vega: 6.9133555413 - Theta: 0.0824163304 - Premium: $2.46 - Risk/Reward Analysis: Relatively low gamma minimizes the risk of assignment. With an ROI of over 100%, the profit potential is excellent at $2.46.
Choice 3: Long Term Strategy
Long Call Option: - Strike Price: $47.5 - Expiration Date: 2024-11-15 - Delta: 0.9275726538 - Gamma: 0.0058744463 - Vega: 5.2612581585 - Theta: -0.0192855033 - Premium: $23.7 - Profitability Quantification: ROI of 7.73%, potential profit of $1.832.
Short Put Option: - Strike Price: $67.5 - Expiration Date: 2024-11-15 - Delta: -0.297176 - Gamma: 0.0130791353 - Vega: 1.8201654008 - Theta: 0.1012 - Premium: $4.25 - Risk/Reward Analysis: The negative delta reduces the risk of assignment. A high-profit ROI of 100% yielding $4.25 in profit provides ample return.
Choice 4: Ultra Long-Term Strategy
Long Call Option: - Strike Price: $90.0 - Expiration Date: 2026-01-16 - Delta: 0.5693514161 - Gamma: 0.0129292929 - Vega: 34.6473808709 - Theta: -0.0034533331 - Premium: $25.85 - Profitability Quantification: ROI of 23.28%, potential profit of $6.018.
Short Put Option: - Strike Price: $80.0 - Expiration Date: 2026-01-16 - Delta: -0.9150472356 - Gamma: 0.0112156377 - Vega: 25.8465296632 - Theta: 3.00 - Premium: $13.9 - Risk/Reward Analysis: Gamma and Theta support a balanced risk of assignment while maintaining an attractive ROI of 100%, yielding $13.9 profit.
Choice 5: Flexible Mid-Term Strategy
Long Call Option: - Strike Price: $55.0 - Expiration Date: 2025-01-17 - Delta: 0.8544539278 - Gamma: 0.0081285421 - Vega: 14.2019845649 - Theta: -0.0024597483 - Premium: $19.9 - Profitability Quantification: ROI of 33.64%, potential profit of $6.718.
Short Put Option: - Strike Price: $75.0 - Expiration Date: 2025-01-17 - Delta: -0.481922 - Gamma: 0.0197505463 - Vega: 10.2003364443 - Theta: 0.321 - Premium: $10.15 - Risk/Reward Analysis: Low and stable gamma reduces the assignment likelihood, with profits reaching 100% ROI at $10.15 potential yield.
In these strategies, while the short puts provide immediate premium income, the long calls offer upside potential. Highly in-the-money options or those too close to the stock price are avoided to minimize the risk of early assignment, maintaining overall strategy stability. Factors like vega and theta ensure that both position components complement each other, yielding profitable calendar spreads across various expiration profiles joined with measured risk parameters.
Calendar Spread Option Strategy #1
Given the intricate structure of the options chain for Marvell Technology, Inc. (MRVL) and our interest in calendar spreads involving purchasing long-term put options and selling short-term call options, an in-depth analysis is required. The aim is to identify strategies that deliver high profitability while minimizing the risk of having shares assigned. We aim to target a stock price variation within 2% of its current value. Here are five curated choices ranging from near-term to long-term options, balancing strike prices, expiration dates, and "Greeks":
1. Immediate-Term Strategy
Long Put: - Strike: $82.0 - Expiration Date: 2024-07-26 - Delta: -0.8172 - Premium: $8.7 - ROI: 0.0308 - Profit: $0.268
Short Call: - Strike: $95.0 - Expiration Date: 2024-07-05 - Delta: 0.0018 - Premium: $0.04 - ROI: 100.0 - Profit: $0.04
Analysis: The short call with a delta of 0.0018 represents very low assignment risk, making it less likely the shares will be assigned. The put option, although expiring in 22 days, provides adequate coverage with a moderate profit potential. This combination ensures that minimal capital is tied up with a reasonable return, focusing on a short timeframe.
2. Short-Term Strategy
Long Put: - Strike: $87.5 - Expiration Date: 2024-09-20 - Delta: -0.7591 - Premium: $13.91 - ROI: 0.0401 - Profit: $0.558
Short Call: - Strike: $100.0 - Expiration Date: 2024-07-12 - Delta: 0.0036 - Premium: $0.02 - ROI: 100.0 - Profit: $0.02
Analysis: This strategy utilizes a put option with a reasonable delta, ensuring a good hedge against downward movements while providing a solid return. The short call option strikes nearly at delta zero, which minimally risks assignment. This strategy locks in small premiums while maintaining a hedged position.
3. Intermediate-Term Strategy
Long Put: - Strike: $95.0 - Expiration Date: 2024-09-20 - Delta: -0.9993 - Premium: $21.9 - ROI: 0.0031 - Profit: $0.068
Short Call: - Strike: $110.0 - Expiration Date: 2024-07-19 - Delta: 0.0078 - Premium: $0.08 - ROI: 100.0 - Profit: $0.08
Analysis: Given the put option's nearly -1 delta, it provides significant downside protection. The short call option is very unlikely to be assigned due to its low delta. This pairing ensures robust hedging with minimal possibilities for assignment, covering a longer-term horizon while providing some immediate premium benefits.
4. Medium-Term Strategy
Long Put: - Strike: $110.0 - Expiration Date: 2024-12-20 - Delta: -0.7934 - Premium: $42.7 - ROI: 0.0999 - Profit: $4.268
Short Call: - Strike: $110.0 - Expiration Date: 2024-07-19 - Delta: 0.0079 - Premium: $0.08 - ROI: 100.0 - Profit: $0.08
Analysis: Here, both the long put and short call utilize the same strike price but different expiration dates, with the call having a very low delta. This strategy significantly limits assignment risk while ensuring considerable downside protection over a moderate timeframe, balancing immediate and intermediate needs.
5. Long-Term Strategy
Long Put: - Strike: $120.0 - Expiration Date: 2025-01-17 - Delta: -0.9753 - Premium: $40.4 - ROI: 0.1625 - Profit: $6.568
Short Call: - Strike: $110.0 - Expiration Date: 2024-07-19 - Delta: 0.0079 - Premium: $0.08 - ROI: 100.0 - Profit: $0.08
Analysis: This strategy focuses on significant long-term protection. The high delta put option provides substantial hedging against downturns. The short call, with minuscule delta, minimizes share assignment risk in the near term. This approach balances longevity and immediate premium earnings.
Conclusion
Each strategy aligns with the calendar spread's objective of minimizing assignment risk while aiming for profitability through strategic use of "the Greeks." By balancing delta values and expiration dates carefully, potential profit scenarios are optimized while accounting for risks at each temporal scale.
Calendar Spread Option Strategy #2
In evaluating a calendar spread options strategy for Marvell Technology, Inc. (MRVL), where one sells a put option at one expiration date and buys a call option at a different expiration date, it's crucial to balance potential profitability against the risk of having shares assigned due to in-the-money (ITM) options. Here we will examine five combinations of calls and puts, considering various expiration dates and strike prices to maximize profit while minimizing risk.
Near-Term Strategy (Expiring within 1 month)
Example 1: - Put Option: Sell the MRVL put option with a strike price of 70 and an expiration date of 2024-07-19. This option has a delta of 0.6338502604 and a premium of 3.20, indicating a fairly high likelihood the option will remain ITM, creating a risk of assignment. The ROI is 94.75% with a profit potential of $3.032. - Call Option: Buy the MRVL call option with a strike price of 72.5 and an expiration date of 2024-07-19. This option has a delta of 0.460459651 and a premium of 1.92, with an ROI of 100% and profit potential of $1.92.
Risk/Reward Analysis: - Risk: The primary risk here is the high delta on the put option, signaling a strong chance of assignment. - Reward: The reward is considerable with a high ROI for both positions.
Intermediate Strategy (Expiring within 3 months)
Example 2: - Put Option: Sell the MRVL put option with a strike price of 67.5 and an expiration date of 2024-08-16. The option has a delta of 0.6933213976 with a premium of 6.55, a ROI of 59.27%, and a profit potential of $3.882. - Call Option: Buy the MRVL call option with a strike price of 70 and an expiration date of 2024-08-16. The option has a delta of 0.6033366107 and a premium of 4.90, with a ROI of 96.57% and profit potential of $4.732.
Risk/Reward Analysis: - Risk: Moderate delta increases the risk of assignment but offers significant leverage. - Reward: Profit potentials remain high with solid ROI, balancing risk effectively for intermediate terms.
Longer-Term Strategy (Expiring within 6 months)
Example 3: - Put Option: Sell the MRVL put option with a strike price of 70 and an expiration date of 2024-11-15. This option has a delta of 0.6075394562 and a premium of 8.20, providing a ROI of 97.95% and a profit potential of $8.032. - Call Option: Buy the MRVL call option with a strike price of 65 and an expiration date of 2024-11-15. The option has a delta of 0.698652843, a premium of 9.68, offering a ROI of 46.61% and a profit potential of $4.512.
Risk/Reward Analysis: - Risk: The delta suggests a fair chance of assignment, but the premium compensates well. - Reward: Both the put and call options provide significant returns, albeit with some assignment risk.
Long-Term Strategy (Expiring within 1 year)
Example 4: - Put Option: Sell the MRVL put option with a strike price of 67.5 and an expiration date of 2025-03-21. This option has a delta of 0.6611120332 and a premium of 11.75, providing a ROI of 77.29% and a profit potential of $9.082. - Call Option: Buy the MRVL call option with a strike price of 72.5 and an expiration date of 2025-03-21. This option has a delta of 0.6291854786, a premium of 11.30, and a ROI of 98.51%, with a profit potential of $11.132.
Risk/Reward Analysis: - Risk: Higher delta on the put translates to higher risk, especially with the longer time decay. - Reward: Significant profit potential makes this option attractive despite higher risk.
Extended-Term Strategy (Expiring beyond 1 year)
Example 5: - Put Option: Sell the MRVL put option with a strike price of 70 and an expiration date of 2026-01-16. This option has a delta of 0.6430648357and a premium of 14.22, giving a ROI of 98.82% and a profit potential of $14.052. - Call Option: Buy the MRVL call option with a strike price of 75 and an expiration date of 2026-01-16. This option has a delta of 0.6286755357, a premium of 15.60,with a ROI of 100%, and profit potential of $15.60.
Risk/Reward Analysis: - Risk: The long time frame reduces the immediate risk of assignment but increases exposure to market volatility. - Reward: The ROI and significant premiums balance the risk, making it a lucrative long-term strategy.
Conclusion
By carefully selecting put options with lower delta values and balancing them with higher-delta call options, it is possible to construct profitable calendar spreads while managing the risks of assignment. Each of these five strategies offers a mix of near-term to extended-term sensitivities, allowing flexibility in trading based on personal risk tolerance and market outlook. The key is to maintain a balanced perspective on the "Greeks" to maximize returns while keeping risks in check.
Similar Companies in Semiconductors:
Report: NVIDIA Corporation (NVDA), NVIDIA Corporation (NVDA), Report: Intel Corporation (INTC), Intel Corporation (INTC), Report: Taiwan Semiconductor Manufacturing Company Limited (TSM), Taiwan Semiconductor Manufacturing Company Limited (TSM), Report: Micron Technology, Inc. (MU), Micron Technology, Inc. (MU), Report: QUALCOMM Incorporated (QCOM), QUALCOMM Incorporated (QCOM), Report: Advanced Micro Devices, Inc. (AMD), Advanced Micro Devices, Inc. (AMD), Report: Broadcom Inc. (AVGO), Broadcom Inc. (AVGO), Report: Texas Instruments Incorporated (TXN), Texas Instruments Incorporated (TXN), Report: Analog Devices, Inc. (ADI), Analog Devices, Inc. (ADI), ON Semiconductor Corporation (ON), Xilinx, Inc. (XLNX)
https://www.fool.com/investing/2024/06/06/is-marvell-stock-a-buy-now/
https://seekingalpha.com/article/4698106-marvell-even-a-tiny-piece-of-ai-pie-means-a-lot
https://www.fool.com/investing/2024/06/09/better-artificial-intelligence-ai-stock-broadcom-v/
https://www.fool.com/investing/2024/06/27/better-artificial-intelligence-ai-stock-advanced-m/
https://www.youtube.com/watch?v=6-h5FwY1OUo
https://finance.yahoo.com/m/dca00997-0eec-3934-b09e-b6c3d762c2e3/better-artificial.html
https://finance.yahoo.com/news/marvell-technology-mrvl-upgrades-alaska-114400850.html
https://finance.yahoo.com/video/hidden-gems-tech-investors-know-120249443.html
https://finance.yahoo.com/news/marvell-technology-mrvl-gains-market-215017259.html
https://finance.yahoo.com/news/broadcom-two-more-us-stocks-110337002.html
https://www.fool.com/investing/2024/07/02/1-top-chip-stock-reporting-massive-ai-growth-why-i/
https://www.sec.gov/Archives/edgar/data/1835632/000183563224000063/mrvl-20240504.htm
Copyright © 2024 Tiny Computers (email@tinycomputers.io)
Report ID: vfmazh
Cost: $0.71470
https://reports.tinycomputers.io/MRVL/MRVL-2024-07-03.html Home