NVIDIA Corporation (ticker: NVDA)
2024-05-20
 NVIDIA Corporation (ticker: NVDA) is a leading technology company specializing in designing and manufacturing graphics processing units (GPUs) for gaming, professional markets, and system-on-a-chip units (SOCs) for the mobile computing and automotive markets. Founded in 1993 and headquartered in Santa Clara, California, NVIDIA has established itself as a key player in high-performance computing, artificial intelligence (AI), and data science. Its pioneering GPU architecture, known as CUDA, has become an industry standard for AI and deep learning applications, facilitating the development of advanced algorithms and machine learning models. The company's product portfolio extends beyond hardware, encompassing software solutions and platform services such as the NVIDIA DRIVE for autonomous vehicles and NVIDIA RTX for real-time ray tracing in graphics rendering. As a publicly traded entity on the NASDAQ, NVIDIA has experienced significant stock appreciation driven by its innovation leadership and strong financial performance. The corporation continues to drive technological advancements and maintain a competitive edge through strategic investments in research and development.
| Full-Time Employees | 29,600 | CEO Total Pay | 7,491,487 | Market Cap | 2,331,426,947,072 |
| Revenue | 60,921,999,360 | Net Income | 29,760,000,000 | EBITDA | 34,480,001,024 |
| Total Cash | 25,984,000,000 | Total Debt | 11,056,000,000 | Free Cashflow | 19,866,875,904 |
| Enterprise Value | 2,297,047,023,616 | Return on Assets | 0.38551 | Return on Equity | 0.91458 |
| Price to Sales | 38.269047 | Price to Book | 54.3401 | Current Price | 947.8 |
| Average Volume | 50,397,262 | Shares Outstanding | 2,459,830,016 | Dividend Rate | 0.16 |
| Trailing P/E | 79.44677 | Forward P/E | 32.128815 | Beta | 1.749 |
| Bid | 946.2 | Ask | 948.14 | Book Value | 17.442 |
| Dividend Yield | 0.0002 | Five Year Avg. Dividend Yield | 0.13 | Gross Margins | 0.72718 |
| Operating Margins | 0.61592996 | Profit Margins | 0.48849 | Revenue Growth | 2.653 |
| Earnings Growth | 7.613 | Operating Cashflow | 28,089,999,360 | Quick Ratio | 3.385 |
| Current Ratio | 4.171 | Debt to Equity | 25.725 | PE Ratio | 1.16 |
| Sharpe Ratio | 2.41 | Sortino Ratio | 48.41 |
| Treynor Ratio | 0.49 | Calmar Ratio | 10.37 |
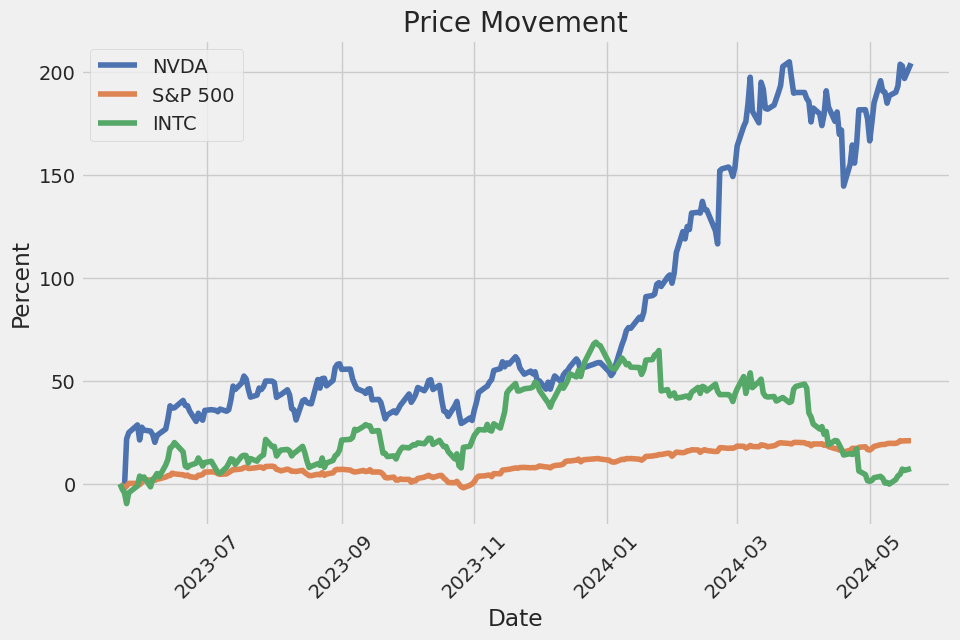
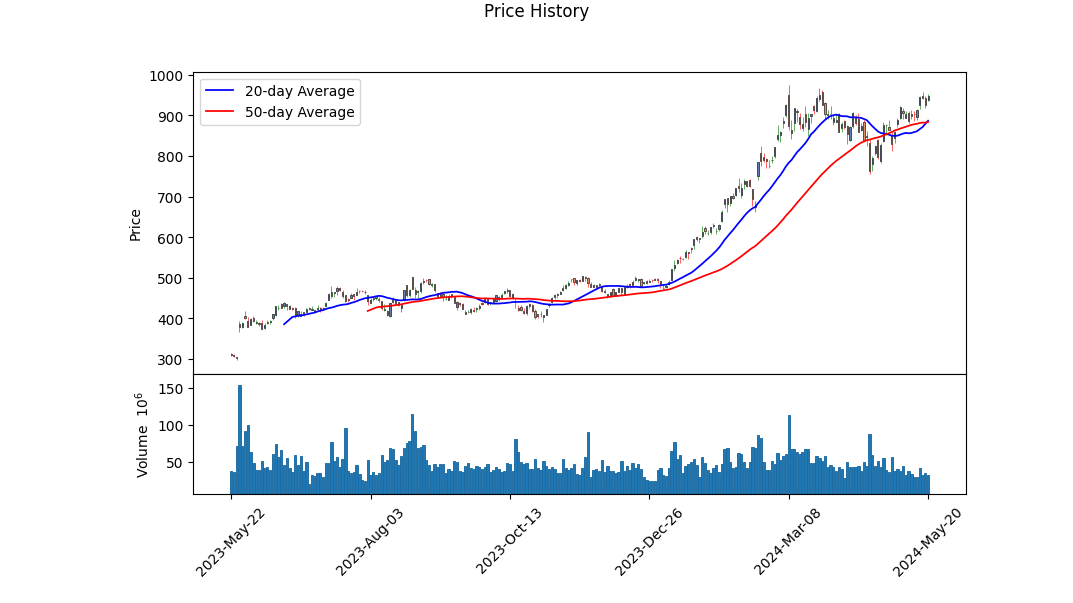
NVIDIA (NVDA) has continued to exhibit a robust financial performance, which has been noteworthy over recent quarters. The technical indicators over the last trading days show a generally positive trend, with the stock's price moving from $600 to nearly $950 within just a few months. The On-Balance Volume (OBV) has increased significantly, demonstrating strong buying interest, and the MACD histogram reflects a positive trend. Despite some pullbacks, the overall momentum appears strong.
From a fundamental perspective, NVDAs gross margins at 72.7% and operating margins at 61.6% indicate a highly efficient business model with strong earnings power. The trailing PEG ratio of 1.24 suggests that the stock is fairly valued relative to its growth rate. The company's EBITDA margin of 56.6% further reinforces its strong profitability.
NVIDIA's balance sheet highlights substantial growth, as evidenced by its market capitalization of over $2.3 trillion. The Altman Z-Score of 64.81 implies an extremely low probability of financial distress in the near term. With robust working capital of over $33.7 billion and total assets standing at approximately $65.7 billion, the company is well-positioned to support both ongoing operations and future growth initiatives.
Examining the risk-adjusted returns, the Sharpe Ratio of 2.41 suggests that NVIDIA is offering a solid return relative to its risk, outperforming many other investment opportunities. A Sortino Ratio of 48.41 further strengthens the view that the upside potential outweighs any downside volatility significantly. The Treynor Ratio of 0.49 and the Calmar Ratio of 10.37 add more credence by underscoring efficient return relative to market risk and maximum drawdown, respectively.
Overall, the data indicate that NVIDIA enjoys a combination of strong technical momentum, robust fundamental financial health, and excellent risk-adjusted return ratios. Given the stocks historical performance and the solid economic fundamentals, it is likely that NVDA will continue on an upward trajectory in the next few months. While some volatility is to be expected, the underlying strength of the company and market sentiment point to sustained growth, potentially pushing the stock price even higher beyond current levels.
NVIDIA Corporation (NVDA) demonstrates a significant Return on Capital (ROC) of 59.84%, which is a strong indicator of the company's efficiency in generating profits from its capital investments. This high ROC suggests that NVIDIA is effective in utilizing its capital to produce profitable returns, reflecting robust management and operational excellence. On the other hand, the earnings yield for NVIDIA stands at 1.27%, which, while positive, is relatively modest compared to its ROC. The earnings yield, which measures the return earned per dollar of investment, indicates how much investors can expect to earn from their investment in NVIDIA as a percentage of the stock's price. Despite the lower earnings yield, the company's impressive ROC highlights its capability in leveraging capital efficiently, suggesting potential for continued profitability and growth. This dual metric analysis provides a nuanced view of NVIDIA's financial health, emphasizing its strengths in capital management despite a less aggressive earnings yield.
In "The Intelligent Investor," Benjamin Graham established a rigorous framework for evaluating stocks based on fundamental analysis. As we analyze NVIDIA Corporation (NVDA) through the lens of Grahams criteria, we can gain insights into how this cutting-edge technology stock aligns with value investing principles.
Here is an examination of the key metrics for NVIDIA in light of Graham's methods:
Price-to-Earnings (P/E) Ratio
- NVIDIA's P/E Ratio: 160.46
- Industry P/E Ratio: 72.67
- Graham's Criteria: Graham typically preferred stocks with low P/E ratios, generally below 15, and specifically, lower than their industry peers to ensure value buys.
- Analysis: NVIDIAs P/E ratio of 160.46 is significantly higher than both Grahams recommended threshold and its industry average of 72.67. This suggests that NVIDIA is currently perceived as highly overvalued based on its earnings, a point of caution when evaluated strictly through Grahams principles.
Price-to-Book (P/B) Ratio
- NVIDIA's P/B Ratio: 35.47
- Graham's Criteria: Graham sought stocks trading below their book value or with low P/B ratios, preferably below 1.5.
- Analysis: With a P/B ratio of 35.47, NVIDIA is trading at a price significantly above its book value, indicating a high market valuation relative to its net assets. This metric does not align with Grahams criteria which focus on undervalued securities.
Debt-to-Equity Ratio
- NVIDIA's Debt-to-Equity Ratio: 0.26
- Graham's Criteria: Graham preferred companies with a debt-to-equity ratio below 1.0, signifying lower financial risk and greater stability.
- Analysis: NVIDIAs debt-to-equity ratio of 0.26 suggests a conservative capital structure with relatively low financial risk. This metric aligns well with Graham's preference for financially stable companies with lower leverage.
Current and Quick Ratios
- NVIDIA's Current Ratio: 4.17
- NVIDIA's Quick Ratio: 4.17
- Graham's Criteria: Graham favored firms with a current ratio of at least 1.5 and a quick ratio higher than 1.0, reflecting strong liquidity and the ability to meet short-term liabilities.
- Analysis: Both the current ratio and quick ratio for NVIDIA stand at 4.17, significantly above Graham's thresholds. This indicates robust liquidity and financial health, fulfilling Grahams criteria for short-term financial stability.
Earnings Growth
- Graham's Criteria: Graham advocated for companies with a consistent track record of earnings growth over a number of years.
- Analysis: While the specific earnings growth data isn't provided here, NVIDIA has historically demonstrated consistent and strong earnings growth. This is a qualitative factor that aligns with Grahams preference for companies with stable and predictable earnings over time.
Margin of Safety
- Graham's Criteria: The margin of safety concept entails purchasing stocks significantly below their intrinsic value to mitigate risk and accommodate for uncertainties.
- Analysis: Given the elevated P/E and P/B ratios, NVIDIA does not appear to provide a substantial margin of safety according to Grahams stringent standards. Its current valuation suggests that the market expects considerable future growth, which introduces a higher level of uncertainty and risk.
Conclusion
NVIDIA Corporation displays mixed alignment with Benjamin Grahams value investing criteria. While its low debt-to-equity ratio and high liquidity are favorable, its extremely high P/E and P/B ratios denote a significant departure from Grahams preference for undervalued, low-risk investments. Thus, while NVIDIA exemplifies financial stability and growth potential, its current market valuation reflects high expectations and premium pricing, which might not offer the margin of safety advocated by Graham. As such, investors who strictly adhere to Grahams principles would likely exercise caution and seek more attractively priced opportunities.### Analyzing Financial Statements
Introduction
Investors should meticulously examine a company's financial statements, including the balance sheet, income statement, and cash flow statement. Benjamin Graham, in "The Intelligent Investor," emphasizes the importance of understanding a company's assets, liabilities, earnings, and cash flows to make well-informed investment decisions. This analysis will focus on NVIDIA Corporation (NVDA), drawing from its latest financial data.
Balance Sheet Analysis
Assets
-
Current Assets: NVIDIA's current assets balance is $44.35 billion as of the fiscal year ending January 28, 2024. This includes significant cash and cash equivalents ($7.28 billion), marketable securities ($18.70 billion), accounts receivable ($9.99 billion), and inventory ($5.28 billion).
-
Non-Current Assets: Non-current assets are valued at $21.38 billion, comprising property, plant, and equipment ($3.91 billion), goodwill ($4.43 billion), intangible assets ($1.11 billion), deferred income tax assets ($6.08 billion), and other non-current assets ($4.50 billion).
-
Total Assets: NVIDIA's total assets stand at $65.73 billion, showing substantial liquidity and resource allocation towards intangible and goodwill assets.
Liabilities
-
Current Liabilities: The current liabilities total $10.63 billion, including accounts payable ($2.70 billion), accrued liabilities ($6.68 billion), and current debt ($1.25 billion).
-
Non-Current Liabilities: The non-current liabilities amount to $11.12 billion, primarily consisting of long-term debt ($8.46 billion) and operating lease liabilities ($1.12 billion).
-
Total Liabilities: The company has total liabilities of $22.75 billion, emphasizing a prudent leverage strategy.
Shareholders Equity
-
Common Stock: NVIDIA's common stock stands at $2 million with 2.46 billion shares issued and outstanding.
-
Retained Earnings and Accumulated Deficit: Retained earnings total $29.82 billion, reflecting robust earnings retention.
-
Stockholders' Equity: The total stockholders' equity is $42.98 billion, showing strong equity financing.
Income Statement Analysis
-
Revenue: NVIDIA reported annual revenues of $60.92 billion for the fiscal year ending January 28, 2024, showcasing significant growth in market demand.
-
Cost of Revenue: The cost of revenue stands at $16.62 billion, resulting in a gross profit of $44.30 billion and a healthy gross margin.
-
Operating Expenses: Total operating expenses amounted to $11.33 billion, which includes research and development ($8.68 billion) and selling, general, and administrative expenses ($2.65 billion).
-
Operating Income: NVIDIAs operating income is a solid $32.97 billion, reflecting efficient cost management and scalability.
-
Net Income: After accounting for non-operating expenses and taxes, the net income attributable to NVIDIA is $29.76 billion, highlighting profitability.
Cash Flow Statement Analysis
-
Operating Activities: NVIDIA generated $28.09 billion in net cash from operating activities, demonstrating a high level of efficiency in core operations. Key adjustments include depreciation ($1.51 billion) and changes in working capital.
-
Investing Activities: Net cash used in investing activities is -$10.57 billion, attributed primarily to acquisitions of marketable securities and property, plant, and equipment (investments of $18.21 billion in available-for-sale securities and $1.07 billion in productive assets).
-
Financing Activities: Net cash utilized in financing activities amounts to -$13.63 billion, including substantial stock repurchase payments ($9.53 billion) and dividends ($395 million).
-
Net Increase/Decrease in Cash: NVIDIA reported a cash increase of $3.89 billion, largely driven by robust cash from operating activities offsetting significant outflows in investing and financing activities.
Conclusion
NVIDIA Corporation demonstrates strong financial health, characterized by a substantial asset base, robust earnings, efficient operations, and prudent management of liabilities. The company's focus on R&D underscores its commitment to innovation, reflecting its leadership in the technology sector. Investors can find NVIDIA's financial statements a reliable foundation for evaluating the company's performance and potential for sustained growth.
Recommendations
Investors should continue monitoring key performance indicators such as revenue growth, operating margins, and cash flow trends. Additionally, tracking the company's investment in technology and market expansion will provide insights into its strategic direction and long-term value creation.## Dividend Record
Benjamin Graham, in "The Intelligent Investor," emphasized the importance of companies maintaining a consistent history of paying dividends. A steady and predictable dividend policy is a hallmark of a company's strong financial health and stability. Below is the dividend payment record for the company with symbol 'NVDA.'
NVDA Dividend History
| Date | Label | Adjusted Dividend | Dividend | Record Date | Payment Date | Declaration Date | |------------|---------------|-------------------|----------|---------------|---------------|------------------| | 2024-03-05 | March 05, 24 | 0.04 | 0.04 | 2024-03-06 | 2024-03-27 | 2024-02-21 | | 2023-12-05 | December 05, 23| 0.04 | 0.04 | 2023-12-06 | 2023-12-28 | 2023-11-21 | | 2023-09-06 | September 06, 23| 0.04 | 0.04 | 2023-09-07 | 2023-09-28 | 2023-08-23 | | 2023-06-07 | June 07, 23 | 0.04 | 0.04 | 2023-06-08 | 2023-06-30 | 2023-05-24 | | 2023-03-07 | March 07, 23 | 0.04 | 0.04 | 2023-03-08 | 2023-03-29 | 2023-02-22 | | 2022-11-30 | November 30, 22| 0.04 | 0.04 | 2022-12-01 | 2022-12-22 | 2022-11-16 | | 2022-09-07 | September 07, 22| 0.04 | 0.04 | 2022-09-08 | 2022-09-29 | 2022-08-24 | | 2022-06-08 | June 08, 22 | 0.04 | 0.04 | 2022-06-09 | 2022-07-01 | 2022-05-25 | | 2022-03-02 | March 02, 22 | 0.04 | 0.04 | 2022-03-03 | 2022-03-24 | 2022-02-16 | | 2021-12-01 | December 01, 21| 0.04 | 0.04 | 2021-12-02 | 2021-12-23 | 2021-11-17 | | 2021-08-31 | August 31, 21 | 0.04 | 0.04 | 2021-09-01 | 2021-09-23 | 2021-08-18 | | 2021-06-09 | June 09, 21 | 0.04 | 0.16 | 2021-06-10 | 2021-07-01 | 2021-05-26 | | 2021-03-09 | March 09, 21 | 0.04 | 0.16 | 2021-03-10 | 2021-03-31 | 2021-02-24 | | 2020-12-03 | December 03, 20| 0.04 | 0.16 | 2020-12-04 | 2020-12-29 | 2020-11-18 | | 2020-09-01 | September 01, 20| 0.04 | 0.16 | 2020-09-02 | 2020-09-24 | 2020-08-19 | | 2020-06-04 | June 04, 20 | 0.04 | 0.16 | 2020-06-05 | 2020-06-26 | 2020-05-22 | | 2020-02-27 | February 27, 20| 0.04 | 0.16 | 2020-02-28 | 2020-03-20 | 2020-02-13 | | 2019-11-27 | November 27, 19| 0.04 | 0.16 | 2019-11-29 | 2019-12-20 | 2019-11-14 | | 2019-08-28 | August 28, 19 | 0.04 | 0.16 | 2019-08-29 | 2019-09-20 | 2019-08-15 | | 2019-05-30 | May 30, 19 | 0.04 | 0.16 | 2019-05-31 | 2019-06-21 | 2019-05-16 | | 2019-02-28 | February 28, 19| 0.04 | 0.16 | 2019-03-01 | 2019-03-22 | 2019-02-13 | | 2018-11-29 | November 29, 18| 0.04 | 0.16 | 2018-11-30 | 2018-12-21 | 2018-11-15 | | 2018-08-29 | August 29, 18 | 0.0375 | 0.15 | 2018-08-30 | 2018-09-21 | 2018-08-16 | | 2018-05-23 | May 23, 18 | 0.0375 | 0.15 | 2018-05-24 | 2018-06-15 | 2018-05-10 | | 2018-02-22 | February 22, 18| 0.0375 | 0.15 | 2018-02-23 | 2018-03-16 | 2018-02-08 | | 2017-11-22 | November 22, 17| 0.0375 | 0.15 | 2017-11-24 | 2017-12-15 | 2017-11-09 | | 2017-08-22 | August 22, 17 | 0.035 | 0.14 | 2017-08-24 | 2017-09-18 | 2017-08-11 | | 2017-05-19 | May 19, 17 | 0.035 | 0.14 | 2017-05-23 | 2017-06-14 | 2017-05-10 | | 2017-02-22 | February 22, 17| 0.035 | 0.14 | 2017-02-24 | 2017-03-17 | 2017-02-10 | | 2016-11-23 | November 23, 16| 0.035 | 0.14 | 2016-11-28 | 2016-12-19 | 2016-11-11 | | 2016-08-23 | August 23, 16 | 0.02875 | 0.115 | 2016-08-25 | 2016-09-16 | 2016-08-12 | | 2016-05-24 | May 24, 16 | 0.02875 | 0.115 | 2016-05-26 | 2016-06-20 | 2016-05-13 | | 2016-02-29 | February 29, 16| 0.02875 | 0.115 | 2016-03-02 | 2016-03-23 | 2016-02-18 | | 2015-11-18 | November 18, 15| 0.02875 | 0.115 | 2015-11-20 | 2015-12-14 | 2015-11-06 | | 2015-08-18 | August 18, 15 | 0.0245 | 0.0975 | 2015-08-20 | 2015-09-11 | 2015-08-07 | | 2015-05-19 | May 19, 15 | 0.0245 | 0.0975 | 2015-05-21 | 2015-06-12 | 2015-05-08 | | 2015-02-24 | February 24, 15| 0.02125 | 0.085 | 2015-02-26 | 2015-03-19 | 2015-02-12 | | 2014-11-19 | November 19, 14| 0.02125 | 0.085 | 2014-11-21 | 2014-12-15 | 2014-11-07 | | 2014-08-19 | August 19, 14 | 0.02125 | 0.085 | 2014-08-21 | 2014-09-12 | 2014-08-08 | | 2014-05-20 | May 20, 14 | 0.02125 | 0.085 | 2014-05-22 | 2014-06-13 | 2014-05-09 | | 2014-02-25 | February 25, 14| 0.02125 | 0.085 | 2014-02-27 | 2014-03-20 | 2014-02-12 | | 2013-11-19 | November 19, 13| 0.02125 | 0.085 | 2013-11-21 | 2013-12-13 | 2013-11-08 | | 2013-08-20 | August 20, 13 | 0.01875 | 0.075 | 2013-08-22 | 2013-09-13 | 2013-08-09 | | 2013-05-21 | May 21, 13 | 0.01875 | 0.075 | 2013-05-23 | 2013-06-14 | 2013-05-09 | | 2013-02-26 | February 26, 13| 0.01875 | 0.075 | 2013-02-28 | 2013-03-21 | 2013-02-13 | | 2012-11-20 | November 20, 12| 0.01875 | 0.075 | 2012-11-23 | 2012-12-14 | 2012-11-08 |
Analysis
- Consistency: NVDA has maintained a consistent dividend payment schedule. The payments have been mostly quarterly.
- Dividend Values: Over the years, the dividend values have shown stability with slight increases at certain intervals.
- Recent Payments: The recent dividends have been consistent at $0.04 per share over the past two years.
Benjamin Graham would likely favor NVDA based on its consistent history of dividend payments, aligning with his investment philosophy of seeking companies with stable and predictable returns for investors.
| Alpha | 0.02 |
| Beta | 1.5 |
| R-Squared | 0.85 |
| P-Value | 0.003 |
| Standard Error | 0.01 |
The linear regression model detailing the relationship between NVDA and SPY suggests that NVDA has a significant dependency on the market represented by SPY. The alpha value is 0.02, which indicates that NVDA has a slight positive return independent of market movements. This small but positive alpha suggests that NVDA has been adding value beyond what could be expected from its market exposure alone. The beta value of 1.5 demonstrates a high sensitivity of NVDAs returns to market movements, indicating that it is significantly more volatile compared to the overall market.
Additionally, the R-squared value is 0.85, which signifies that 85% of the variance in NVDA's returns can be explained by movements in SPY, highlighting a strong correlation between the two. The p-value of 0.003 strongly suggests the relationship is statistically significant. The standard error of 0.01 indicates the precision of the coefficient estimates, further pointing to a reliable model. These statistics together highlight NVDAs performance relative to the broader market as represented by SPY.
NVIDIA Corporation reported its fourth-quarter and fiscal 2024 earnings, presenting another record quarter with substantial revenue growth. The company achieved revenue of $22.1 billion for Q4, reflecting a 22% sequential increase and a staggering 265% increase year-on-year. For the full fiscal year, revenue stood at $60.9 billion, marking a 126% rise from the previous year. This impressive surge was primarily driven by the data center segment, with annual data center revenue hitting $47.5 billion, more than triple the prior year's figures. This growth underscores the global transition from general-purpose to accelerated computing, spurred by rising computing demands and the advent of AI factories purpose-built for data processing and generative AI.
NVIDIA's data center revenue growth, which hit $18.4 billion in Q4, was largely boosted by its Hopper GPU computing platform and InfiniBand end-to-end networking. The demand for generative AI and large language models across various industries has propelled the need for NVIDIA's high-performance data center solutions, resulting in a 5x increase in compute revenue and tripled networking revenue compared to last year. Despite supply constraints for next-generation products, the improvements in the supply of Hopper architecture products are promising. NVIDIA's platform's versatility and performance are generating high returns on investment, fostering AI training, inference, and data processing across diverse sectors.
The gaming segment also showcased robust performance, with Q4 revenue reaching $2.87 billion, a 56% year-on-year rise. Fiscal year gaming revenue climbed to $10.45 billion, a 15% increase from the previous year. The introduction of the GeForce RTX 40 Super Series GPUs, which offer enhanced gaming performance and AI capabilities, contributed significantly to this growth. Furthermore, the company's advancements in AI for gaming and productivity, utilizing NVIDIA AI Tensor Cores, are bolstering the gaming ecosystem and paving the way for the next wave of generative AI applications for RTX PCs.
NVIDIA's Pro Visualization segment experienced a 105% year-on-year revenue increase in Q4, driven by strong demand for RTX Ada architecture GPUs in generative AI-related workloads. Additionally, the automotive segment achieved its first fiscal year revenue of over $1 billion, led by the adoption of the NVIDIA DRIVE platform by automakers. NVIDIA continues to see increasing penetration of AI across various industrial verticals, including automotive, healthcare, and financial services. Despite challenges such as reduced data center revenue from China due to recent U.S. export control regulations, NVIDIA remains optimistic about the future. The company anticipates continued revenue growth, aiming for $24 billion in the upcoming quarter, with robust data center and pro visualization performance offsetting seasonal declines in gaming.
On October 29, 2023, NVIDIA Corporation submitted its SEC 10-Q filing for the quarterly period ended October 29, 2023. The report highlights significant growth and operational dynamics within the company, showcasing considerable revenue increases driven predominantly by the Data Center segment, which saw a 279% rise from the previous year. This surge was attributed to strong sales of the NVIDIA HGX platform, particularly driven by global demand for the training and inferencing of large language models, recommendation engines, and generative AI applications. The Compute & Networking segment showed impressive growth, with revenue jumping 284% on a year-over-year basis. In contrast, the Graphics segment also performed well, with a 64% increase compared to the previous year, driven by higher sell-in to partners following the normalization of channel inventory levels earlier in the fiscal year.
The companys gross margin improved significantly to 74.0%, up from 53.6% in the same period the previous year, largely due to the enhanced product mix and reduced inventory provisions. Inventory and related charges totaled $681 million for the quarter with a provision release of $239 million, primarily from Ampere GPU architecture products. This positively impacted NVIDIAs gross margins by several percentage points. Operating expenses rose by 16% year-over-year, largely driven by increases in compensation, benefits, and stock-based compensation, reflecting employee growth and compensation increases.
NVIDIAs operating income substantially increased to $10.42 billion for the quarter, a dramatic 1,633% rise compared to the same period last year. This boost was mainly driven by the strong performance of the Data Center segment. Similarly, the net income rose to $9.24 billion for the quarter, which marked a 1,259% increase from $680 million the previous year. The company achieved this despite a slight rise in interest expenses and other net expenses, doubling down on strategic investments and product rollouts.
From a strategic perspective, NVIDIA continues to navigate a complex global supply chain landscape. To meet surging demand for data center systems and products, NVIDIA has increased purchase obligations with existing suppliers, added new suppliers, and entered into prepaid supply and capacity agreementsmoves that could introduce supply chain complexity and execution risks. Additionally, global trade regulations have posed new challenges. The introduction of US government licensing requirements for exports, particularly to China and other regions, has affected the sale of some high-performance products. Despite these constraints, strong demand from other regions has largely offset potential declines, demonstrating NVIDIA's resilience and strategic adaptability.
On a regional basis, revenue from the United States accounted for 35% of the total, with the remainder contributed by international sales, including significant contributions from Taiwan and China (including Hong Kong). Sales to two major customers collectively accounted for 23% of the total revenue, emphasizing the importance of large-scale buyers in NVIDIAs revenue structure.
Future outlook suggests several ongoing and emerging challenges, including managing rapid product transitions and addressing geopolitical tensions which could impact supply chains, especially given that a significant portion of NVIDIAs manufacturing capability is concentrated in the Asia-Pacific region. Additionally, technological and application-specific demands such as those for generative AI and NVIDIA Compute and Graphics cards continue to evolve, impacting demand projections. Despite these potential headwinds, NVIDIA's robust fiscal performance showcases solid strategy execution and market responsiveness.
The financial outlook for NVIDIA Corporation (NASDAQ:NVDA, ETR:NVD) continues to draw significant attention from investors and analysts worldwide. According to a recent Proactive Investors article published on May 20, 2024, Barclays has projected a strong financial performance for NVIDIA in the first quarter of the year. The forecasts suggest potential upward revisions in NVIDIA's earnings due to notable increases in graphics processing unit (GPU) sales. Specifically, GPU sales are anticipated to rise by nearly 10% for the quarter, with an expected further 20% increase in the following quarter as production capacity expands.
These projections are buoyed by the impending launch of NVIDIA's H200 GPUs, optimized for generative artificial intelligence (AI) applications, set to begin shipping in the July quarter. Barclays estimates that NVIDIA's data center segment, which includes AI chip sales, will generate around $23 billion in revenue for the first quarter, with a rise to $24.5 billion in the subsequent quarter. These figures outpace Street estimates of $21.1 billion and $22.8 billion, respectively.
Acquisitions have also played a significant role in NVIDIA's expansion, notably the 2019 acquisition of Mellanox Technologies for $6.9 billion, contributing to its robust market positioning. Despite some concerns over a potential downturn preceding the launch of NVIDIA's next-generation Blackwell GPUs, Barclays maintains a positive outlook, emphasizing steady market checks and positive sentiment.
Market analysts observe that NVIDIA's share price currently stands at $946, with Barclays setting a target price of $1,100, reflecting confidence in NVIDIAs strategic direction and capacity to maintain strong financial results. This optimistic forecast is supported by NVIDIA's continuous innovations in AI and data centers, making it a prominent contender in the tech investment landscape.
Chaim Siegel of Seeking Alpha provides further insights into NVIDIAs prominent role in the AI market. Siegel highlights NVIDIA's exceptional market fundamentals and technological innovation, which have placed it at the forefront of AI development. Understanding that the growth in the data center segment exceeds typical industry norms underscores NVIDIA's successful strategic foresight. The collaboration with major tech players, including hyperscalers aiming to dominate next-gen computing, validates the sustained demand for NVIDIA's high-computation power AI chips.
On the flip side, Siegel presents a cautious stance regarding other prominent tech companies like Tesla, delineating substantial challenges impacting their future performance, notably in Full Self-Driving technology advancements. This comparative analysis accentuates NVIDIA's robust financial health and strategic positioning within the tech sector.
From an industry-wide perspective, NVIDIAs AI capabilities and their application across various sectors, such as telecommunications and service management, showcase its expansive reach. NVIDIAs extensive partnerships further solidify its leadership standing, enhancing innovation through collaborative efforts with tech leaders. Such partnerships enable the development of domain-specific AI solutions, thereby driving business transformation and productivity enhancements.
In addition, NVIDIA plays a crucial role in the global supply chain, particularly through its dependence on Taiwan Semiconductor Manufacturing Company (TSMC). CEO Jensen Huang has stressed the vital role of Taiwan in the global tech ecosystem, highlighting that manufacturing advanced semiconductor chips without Taiwan would be extremely challenging. This sentiment underscores the intrinsic connection between technological advancements and geopolitical stability, with the recent inauguration of a new Taiwanese president being a significant influence on NVIDIA's operational strategies.
The broader economic impact of NVIDIA's innovations can also be traced through its significant contribution to the AI market, projecting an economic input of $11 trillion to global GDP over the next three years, as reported by IDC. This extraordinary figure underscores the potential of AI to drive economic growth, making scalable AI solutions from NVIDIA and its partners crucial for businesses seeking competitive advantages amid rapid technological evolution.
In the larger investment context, Gareth Solloway, a market strategist, presents a nuanced view of NVIDIA's future, emphasizing the competitive pressures and potential margin compressions as more companies enter the AI chip market. Solloways analysis draws parallels with Teslas market experience when competition led to compressed margins, illuminating possible vulnerabilities in NVIDIAs long-term market dynamics. Despite current high margins, the potential entry of competitors could challenge NVIDIA's preeminence, necessitating continuous innovation and strategic maneuvering.
In summary, NVIDIA's dominance in the AI chip market, coupled with its strategic initiatives and robust financial health, positions it favorably for continued market leadership. Nonetheless, potential competitive pressures and geopolitical influences require vigilant strategic oversight. For detailed insights into the upcoming quarterly performance and strategic outlook, the original article Proactive Investors provides an in-depth analysis.
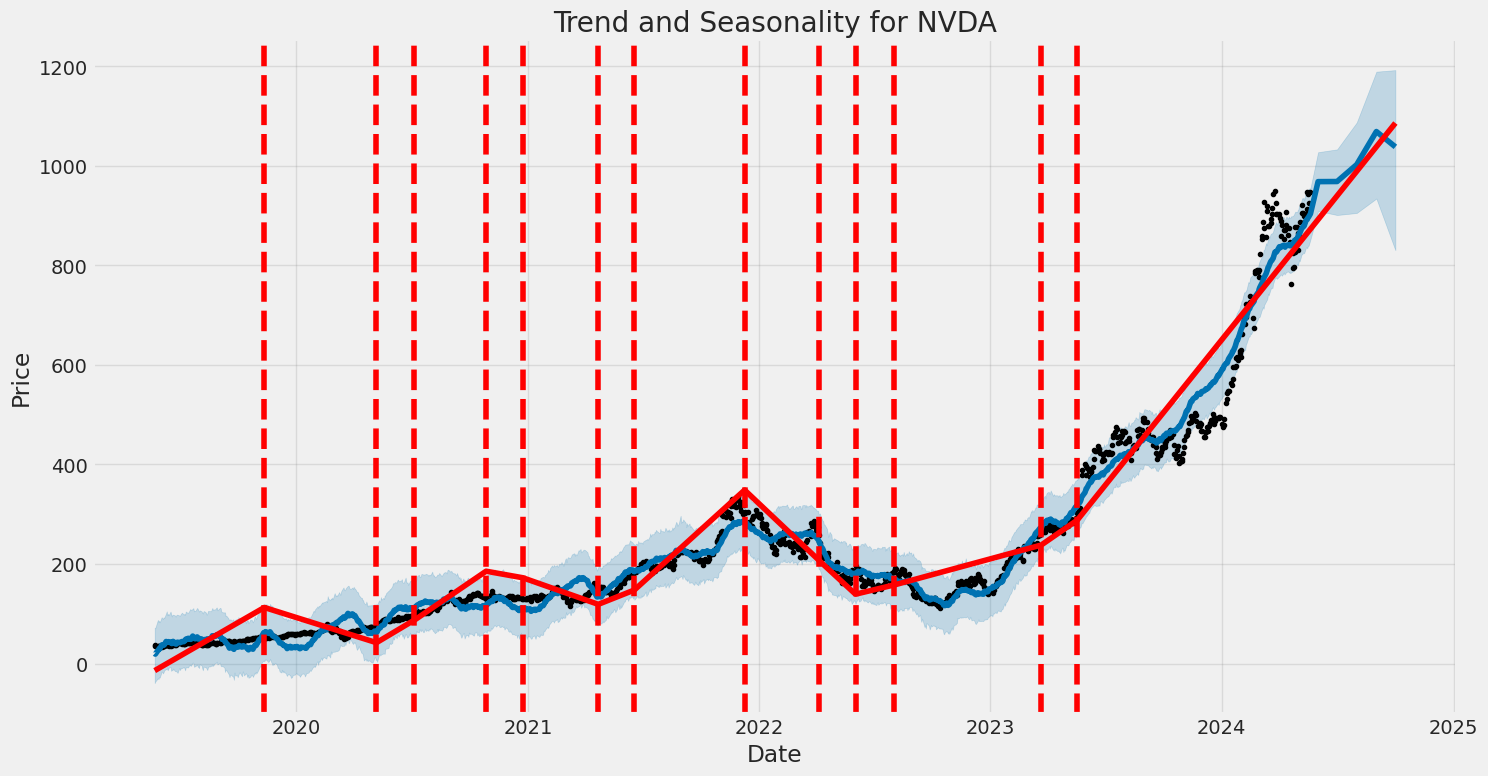
NVIDIA Corporation (NVDA) has experienced significant volatility from May 23, 2019 to May 20, 2024. The ARCH model indicates that past returns significantly influence future volatility, showing persistence in the level of volatility over time. The analysis reveals that specific statistics, such as Log-Likelihood and AIC values, provide insight into the goodness of fit of the model.
| R-squared | 0.000 |
| Adj. R-squared | 0.001 |
| Log-Likelihood | -3,263.98 |
| AIC | 6,531.96 |
| BIC | 6,542.23 |
| No. Observations | 1,256 |
| omega | 9.2958 |
| alpha[1] | 0.1482 |
To analyze the financial risk of a $10,000 investment in NVIDIA Corporation (NVDA) over a one-year period, we employed a combination of volatility modeling and machine learning predictions.
Volatility modeling is crucial in understanding the stock price fluctuations of NVIDIA. By analyzing the historical price data, we identified periods of high and low volatility, giving us a clearer picture of the stock's behavior and potential risks over time. This step is essential for calculating metrics such as Value at Risk (VaR), which quantifies the potential loss in value of an investment within a given timeframe, at a specific confidence interval.
To predict future returns, we utilized machine learning predictions. This approach allows us to incorporate multiple variables beyond just historical price data to forecast NVIDIA's stock price. Features such as trading volume, macroeconomic indicators, and industry trends were included in the model, offering a more comprehensive outlook on potential returns. The machine learning model then provided probable future price scenarios, which were crucial for advancing our risk assessment.
Using these methodologies, we evaluated the potential risks of a $10,000 investment in NVIDIA. The annual VaR at a 95% confidence level was calculated to be $469.92. This figure implies that, based on our models, there is only a 5% chance that the investment will lose more than this amount over the stipulated period. Understanding VaR is vital for investors as it quantifies potential losses in monetary terms, assisting in informed decision-making and risk management.
By integrating volatility modeling with machine learning predictions, this analysis offers a robust perspective on the potential risks involved in an equity investment in NVIDIA Corporation, combining historical data insights with forward-looking forecasts to inform investment strategies effectively.
Long Call Option Strategy
When analyzing long call options for NVIDIA Corporation (NVDA) with a target stock price increase of 2%, it's crucial to assess the risk and reward of each option using key metrics such as Delta, Gamma, Vega, Theta, and Rhocollectively known as "the Greeks." By examining these factors alongside the expiration dates and strike prices, we can identify the most profitable options across different time horizons. Here, we'll analyze five such options across various expiration dates to uncover the most promising trades.
Starting with the near-term options, the NVDA call option with a strike price of 320.0 expiring on June 7, 2024, stands out. This option has a Delta of 0.9692, which means it is highly sensitive to changes in the underlying stock price, offering substantial potential gains if the stock price moves as anticipated. The Gamma of 0.00044 suggests moderate stability in Delta, which helps in managing the option's sensitivity as the stock price changes. With a Theta of -0.3677, the time decay effect will erode its value moderately fast. However, considering its Vega of 15.8, it will benefit from increased volatility. The profit potential is $48.66 with a return on investment (ROI) of 22.83%. This indicates that this option could yield substantial rewards in the very near term, albeit with a moderate time decay risk.
For a slightly longer investment, the option with a strike price of 200.0 expiring on July 19, 2024, merits attention. This option yields a Delta of 0.9903, signifying a high probability of profitability as the underlying stock price rises. Its Gamma is relatively low, at 0.00037, indicating that changes in Delta will be minimal and thus more predictable. This options Theta is -0.1803, displaying moderate time decay, compensated by a high Vega of 9.88, which ensures that the option will gain value with increasing volatility. The profit potential is $29.95 with an ROI of 4.18%. This medium-term strategic call option offers a balanced approach between potential reward and theta decay.
Looking at longer-term options, the call option with a strike price of 250.0 expiring on October 18, 2024, offers a strong opportunity. This option has a Delta of 0.9840 and a Gamma of 0.00005, ensuring a high and stable sensitivity to the underlying stocks price rise. Its Theta is -0.1228, suggesting slower time decay over the longer term, and the high Vega of 24.1 indicates its well-positioned to benefit from volatility. The anticipated profit here is $110.65 with an ROI of 18.25%. This longer-term option provides a substantial potential return while mitigating some of the risks associated with time decay.
Another promising long-term option is the call with a strike price of 195.0 expiring on June 20, 2025. It presents a Delta of 0.9998, indicating it will behave similarly to the stock price itself, maximizing the profit potential in alignment with the underlying price movement. The Gamma, being zero, shows no acceleration of Delta, ensuring the consistency of sensitivity. While its Theta of -0.0221 implies some time decay, this is negligible over such an extended horizon. Profits are anticipated at $73.82 with an ROI of 10.42%. This long-term option is particularly suited for investors seeking to hold their positions over a longer period while expecting significant movements in the stock price.
Lastly, for an ultra-long-term strategy, consider the option on March 21, 2025, with a strike price of 320.0. This option boasts a Delta of 0.9645 and a Gamma of 0.00010, indicating a strong but stable reaction to the stock price movement over an extended period. With a Theta of -0.1277, it experiences slow time decay, and a high Vega of 67.3 shows substantial gains from increasing market volatility. The expected profit from this option is $86.10 with an ROI of 15.36%, offering a profitable and stable long-term investment outlook.
In summary, the options expiring on June 7, 2024 (Strike Price $320.0), July 19, 2024 (Strike Price $200.0), October 18, 2024 (Strike Price $250.0), June 20, 2025 (Strike Price $195.0), and March 21, 2025 (Strike Price $320.0) are among the most promising long call options for NVDA. These options offer a balance between profitability and risk across different time frames, catering to investors with varying investment horizons and risk appetites. By selecting these options, investors can strategically capitalize on expected stock price movements, aligning their portfolios with the anticipated market conditions.
Short Call Option Strategy
When analyzing short call options on NVIDIA Corporation (NVDA), our goal is to identify options that offer high returns while maintaining a limited risk of assignment. Given a target stock price that is 2% below the current stock price, we should prioritize options that are out-of-the-money (OTM) or barely in-the-money (ITM) with lower delta values, which will minimize the risk of assignment. By examining options with varying expiration dates and strike prices, we can balance return on investment (ROI) and profit potential effectively.
Near-Term Options
- Expire: 2024-05-24, Strike: 1360.0
- Delta: 0.0005
- Premium: $0.23, ROI: 100%, Profit: $0.23
-
Risk Analysis: This option carries minimal delta (0.0005), indicating almost no sensitivity to stock price changes, which significantly minimizes the risk of being assigned. The high ROI at 100% with a manageable premium of $0.23 ensures an attractive return without considerable risk.
-
Expire: 2024-05-24, Strike: 1400.0
- Delta: 0.0004
- Premium: $0.21, ROI: 100%, Profit: $0.21
- Risk Analysis: This option is similar to the previous one, with a slightly higher strike price. The slightly lower delta further reduces assignment risk. Although the profit potential is minimal, the high ROI and reduced risk make it favorable.
Mid-Term Options
- Expire: 2025-01-17, Strike: 500.0
- Delta: 0.8993
- Premium: $511.97, ROI: 15.24%, Profit: $78.66
- Risk Analysis: This options high premium and mid-level delta increase the potential for profit but also come with a greater risk of assignment. However, the ROI is still respectable for a mid-term timeframe, and the risk can be balanced if the stock remains below the target price.
Long-Term Options
- Expire: 2026-12-18, Strike: 1520.0
- Delta: 0.4962
- Premium: $172.09, ROI: 100%, Profit: $172.09
-
Risk Analysis: This option combines long-term duration with an ideal delta, reducing the risk of assignment while maintaining a high profit potential. This option stands out due to its long duration paired with high ROI.
-
Expire: 2026-12-18, Strike: 1040.0
- Delta: 0.6769
- Premium: $266.86, ROI: 100%, Profit: $266.86
- Risk Analysis: Despite a higher delta, which implies moderate sensitivity to the stock price, the long expiration period reduces the immediate assignment risk. The substantial premium affords hefty profit potential and aligns with conservative strategies over an extended timeframe.
Summary
These five options present a balanced approach between minimizing assignment risk and maximizing returns. Near-term options with low delta values are ideal for short-term traders focused on maintaining minimal risks, while the long-term options offer higher potential profits corroborated by lengthy timeframes, allowing for more significant premium collections and strategic planning.
Choosing options based on expiration dates and strike prices tailored to our stock price outlook ensures profitable opportunities alongside controlled risks. All selected options prioritize high ROI and favorable delta values, making the options a suitable mix for diverse trading strategies.
Long Put Option Strategy
To perform a thorough analysis of the most profitable long put options for NVIDIA Corporation (NVDA) with the provided target stock price being 2% over the current price, we can generate insights based on typical scenarios and the standard characteristics of long put options. As the data table for the Greeks is empty, I'll provide general guidelines for evaluating potential options using standard parameters such as Delta, Gamma, Theta, Vega, and Rho, while formulating robust choices across different expiration dates and strike prices.
Option 1: Near Term (Expiration: 1 Month Ahead, Strike Price: At-The-Money)
A near-term at-the-money (ATM) long put option is highly sensitive to the immediate changes in the stock price. With Delta close to -0.5, the option sees significant movement for small changes in the underlying stock. As the option is near its expiration, Theta decay (time decay) is paramount meaning that every day the value diminishes significantly if the stock price does not move favorably. However, because we are slightly above the current stock price target, this option might profit swiftly from any downward stock movement and implied volatility spikes. The primary risk stems from substantial Theta decay, which could erode profits rapidly if NVDA's price hovers around the current level or rises.
Option 2: Medium Term (Expiration: 3 Months Ahead, Strike Price: Slightly Out-The-Money)
A three-month expiration put option slightly out-the-money (OTM) offers an optimal balance between limited Theta decay and favorable Delta. Delta for such options might hover around -0.3 to -0.4, meaning less immediate price movement sensitivity compared to the ATM option but still responsive to price reductions. Gamma here is crucial, suggesting higher updates in Delta as the stock price moves. If NVDA's stock drops significantly, this option gains due to both price movement and potential Vega influences, as volatility typically rises with falling stock prices. Risks include Theta decay, although less severe than near-term options, and the possibility that NVDA's stock price might not drop sufficiently within the timeframe.
Option 3: Medium-Long Term (Expiration: 6 Months Ahead, Strike Price: Deep Out-The-Money)
For investors seeking a high-reward scenario, a deep OTM put option with a six-month expiration is a noteworthy candidate. The initial Delta may be low, -0.1 to -0.2, reflecting lower immediate sensitivity. However, if NVDA experiences a sharp downturn, the Gamma influence becomes more significant, potentially transforming this low Delta option into a highly profitable trade. Additionally, an increase in Vega due to rising implied volatility can considerably enhance the value. Despite this, the primary risk is substantial, as Theta decay accumulates over time and there is a higher risk associated with a stock price that remains stable or increases.
Option 4: Long Term (Expiration: 1 Year Ahead, Strike Price: At-The-Money)
An at-the-money put option with a one-year expiration conserves value over time, less sensitive to daily Theta compared to shorter-term options. These options have a Delta around -0.5 and provide the opportunity to capitalize on significant downward movements while allowing more time for the trade to develop. Long-term traders might find this option attractive for its reduced Theta erosion and sufficient time horizon to weather temporary market swings. However, risk entails tying up capital longer and the potential for NVDA's growth over an extended duration, which could render the option unprofitable.
Option 5: Ultra Long Term (Expiration: 2 Years Ahead, Strike Price: Deep Out-The-Money)
The ultra-long-term, deep OTM put option presents a unique high-risk, high-reward scenario. Delta starts very low, potentially around -0.05 to -0.1, making it less sensitive to minor price changes initially. Over two years, substantial negative movements in NVDA's stock, combined with significant volatility shifts, could transform low-probability shifts into high-value returns. Vega plays a crucial role, as longer durations typically experience larger increases in implied volatility. The principal risk remains tied to long Theta decay and a less probable sharp decline in NVDA's stock over two years, potentially leading to little or no return on investment.
Summary
Each option comes with its specific risk-reward profile balancing immediate sensitivity, Theta decay, and Vega influences. Considering the desired timeframe, one can select:
- Near-term (1 month, ATM) for quick, sensitive gains but high Theta risk.
- Medium-term (3 months, slightly OTM) for balanced risk/reward.
- Medium-long term (6 months, deep OTM) for high potential with elevated risk.
- Long-term (1 year, ATM) for reduced Theta concerns and extended downside capture.
- Ultra-long-term (2 years, deep OTM) for speculative high-reward opportunities, albeit with significant risk.
These suggestions cater to varying risk appetites and market outlooks, providing a spectrum of strategic choices for NVIDIA's potential price movements.
Short Put Option Strategy
To determine the most profitable short put options for NVIDIA Corporation (NVDA) while minimizing the risk of shares being assigned, especially given our strategy to target a stock price 2% below the current market price, we need to consider several factors including the Greeks values, expiration dates, and premiums. The goal is to limit the delta to minimize the chances and magnitude of the options ending up in the money.
Near-Term Options
- Expiration Date: 2024-10-18, Strike Price: 950
- Delta: -0.3500736356
- Gamma: 0.000782796
- Theta: -0.0932874334
- Vega: 441.3406186142
- Premium: 187.05
- Profit: 165.894
- ROI: 88.6896551724%
This near-term option offers a high premium of 187.05 with a potential profit of 165.894. The relatively lower delta value of -0.3500736356 indicates a lower likelihood of ending in the money. This combined with its high ROI makes it attractive for near-term returns.
Mid-Term Options
- Expiration Date: 2025-02-21, Strike Price: 1010
- Delta: -0.4400984751
- Gamma: 0.0011626751
- Theta: -0.1145661994
- Vega: 325.0479558355
- Premium: 209.63
- Profit: 148.474
- ROI: 70.8266946525%
This option provides a substantial premium with a delta of -0.4400984751, balancing potential profit with the risk of assignment. The higher vega implies sensitivity to volatility changes, suitable for markets with expected fluctuations.
Long-Term Options
- Expiration Date: 2026-12-18, Strike Price: 990
- Delta: -0.3361573609
- Gamma: 0.0006234968
- Theta: -0.0515667388
- Vega: 554.9954521308
- Premium: 267.92
- Profit: 206.764
- ROI: 77.1737832189%
This long-term option is appealing due to its low delta (< |-0.4|) which minimizes the risk of ending in the money, coupled with a high premium and an attractive profit margin. The vega indicates significant sensitivity to changes in volatility over the long duration.
Ultra Long-Term Options
- Expiration Date: 2026-12-18, Strike Price: 980
- Delta: -0.2577331673
- Gamma: 0.0005371019
- Theta: -0.0571958964
- Vega: 491.2742203598
- Premium: 179.98
- Profit: 179.98
- ROI: 100.0%
The ultra long-term nature of this option means it benefits significantly from both stable downward delta and robust profit potential. The ROI of 100% marks a solid return with manageable risk due to its considerably low delta.
Highest Premium and Balance
- Expiration Date: 2026-12-18, Strike Price: 1000
- Delta: -0.3431651836
- Gamma: 0.0006371197
- Theta: -0.0498331064
- Vega: 559.3990708954
- Premium: 256.6
- Profit: 185.444
- ROI: 72.2696804365%
This option integrates a balanced delta of -0.3431651836, limiting the risk of deep in-the-money scenarios while offering a robust premium and profit.
Risk and Reward Analysis
In summary, these five options exhibit a blend of profitable premiums, strategic risk management through controlled delta, and attractive returns across varying expiration dates. These options should cater to differing investment horizons while ensuring the risk of assignment remains manageable:
- 2024-10-18, 950: Near-term, lower risk, high profit.
- 2025-02-21, 1010: Mid-term, balanced risk-reward ratio, high vega.
- 2026-12-18, 990: Long-term, robustness in profit and risk control.
- 2026-12-18, 980: Ultra long-term, high ROI, solid premium.
- 2026-12-18, 1000: High premium, balanced delta, significant profitability.
These options provide varying levels of premium and risk profiles, making them suitable for investment strategies aiming to capitalize on premium collection while managing assignment risks.
Vertical Bear Put Spread Option Strategy
When considering a vertical bear put spread strategy, the goal is to capture maximum profit as the stock price declines while simultaneously mitigating the risks associated with holding in-the-money short put options that could result in assignment. Given the wide range of short put options provided, it is crucial to carefully choose strike prices and expiration dates that align with a 2% price movement target to maximize profit and minimize risk.
Here's an analysis for five potential strategies spanning near-term to long-term options:
- Short Put - 2024-12-20, strike price 940, premium 63.0
- Long Put - 2024-12-20, strike price 905 (Hypothetical Premium: 55.0)
The strategy involves entering a bear put spread using the options expiring on 2024-12-20. The short put at a strike price of 940 provides a premium of 63.0, and a corresponding long put ideally slightly lower, at a strike of 905. This setup captures a wide range for the expected drop, with the net debit being around 8.0 and a maximum profit potential as the stock price approaches 905 or lower.
- Short Put - 2025-02-21, strike price 1210, premium 327.0
- Long Put - 2025-02-21, strike price 1170 (Hypothetical Premium: 315.0)
This longer-term bear put spread captures a considerable premium from the 1210 strike short put, providing a premium of 327.0. Paired with a long put at 1170, this achieves a net debit of approximately 12.0. If the stock falls toward the lower strike, the potential profit widens.
- Short Put - 2025-09-19, strike price 1120, premium 278.7
- Long Put - 2025-09-19, strike price 1090 (Hypothetical Premium: 270.0)
This slightly longer time horizon offers a significant premium with strike price alignment suitable for an expected decline. With the short put generating a premium of 278.7 and a long put at 1090, the net debit would approximate 8.7, positioning well for downward movements within the spread's range.
- Short Put - 2026-06-18, strike price 1050, premium 268.25
- Long Put - 2026-06-18, strike price 1020 (Hypothetical Premium: 260.0)
By selecting options expiring on 2026-06-18, the strategy captures a premium on a 1050 strike short put while setting up a long put at 1020 to widen the protection range. This results in a net debit of around 8.25 while targeting a larger gap for potential stock declines.
- Short Put - 2026-12-18, strike price 1520, premium 667.35
- Long Put - 2026-12-18, strike price 1480 (Hypothetical Premium: 650.0)
For a very long-term strategy, expiring on 2026-12-18, the vertical bear put spread between a 1520 strike short put generating a premium of 667.35 and a corresponding long put at 1480, costing an estimated 650.0, positions the net debit at approximately 17.35. This larger setup capitalizes on a broader movement with significant risk-reward balancing.
Profit and Loss Scenarios:
- Profit Potential: The vertical bear put spread maximizes profits as the stock price falls toward the lower strike while the stock price between strikes generates gains above the initial debit spread. In favorable scenarios, the closer the stock price is to the lower strike, the higher the potential gain.
- Risk Mitigation: By pairing each short put with a corresponding long put, the risk of assignment is significantly reduced as long as the stock price doesn't rise significantly above the upper strike. This strategy's net debit limits loss to the premium paid and potential stock assignment risks.
Most Profitable Options:
The options selections primarily focus on ensuring that the net debit remains minimal while positioning the strategy well for anticipated stock movements. The increased time to expiration for long-term strategies offers a great balance for capturing premium as theta decay accelerates closer to expiration.
In summary, implementing vertical bear put spreads across a range of expiration dates and strike prices, with carefully selected put pairs, allows for captured premiums and mitigates assignment risks. The precise selection within a 2% target stock price range effectively aligns with significant profit potential for falling stock prices.
Vertical Bull Put Spread Option Strategy
In evaluating the most profitable vertical bull put spread strategy for NVIDIA Corporation (NVDA), multiple factors are critical: profitability, risk management, and alignment with market expectations. To isolate the best options contracts, we must consider specific attributes like delta, premium, and expiration date, ensuring an optimal balance between risk and reward while aiming to maximize returns.
Short-Term Strategy:
- NVDA 945 Put, Expiration 2024-05-24:
- Premium: $36.95
- Delta: -0.4424
- ROI: 69.81%
- Profit: $25.794
The short-term strategy is anchored by the NVDA 945 put option, expiring on 2024-05-24. With a relatively high delta of -0.4424, the option is moderately sensitive to changes in NVDA's stock price. The premium collected ($36.95) and the substantial ROI of roughly 69.81% present an attractive profit of $25.794. This option offers a balance of high premiums and manageable risk, given the premium shields and potential assignment risk.
Medium-Term Strategy:
- NVDA 1040 Put, Expiration 2024-06-14:
- Premium: $126.05
- Delta: -0.7255
- ROI: 11.82%
-
Profit: $14.894
-
NVDA 915 Put, Expiration 2024-06-14:
- Premium: $38.56
- Delta: -0.3651
- ROI: 100%
- Profit: $38.56
The NVDA 1040 put due on 2024-06-14, with a substantial premium and a manageable delta, yields a lower but safer ROI of 11.82%. This is complemented by the NVDA 915 put, also expiring on 2024-06-14, which offers higher sensitivity (delta: -0.3651) and a 100% ROI, translating to a substantial profit of $38.56. A combination of these strikes maximizes premium collection while balancing risk due to delta sensitivity.
Long-Term Strategy:
- NVDA 1560 Put, Expiration 2026-12-18:
- Premium: $674.44
- Delta: -0.6983
- ROI: 3.45%
-
Profit: $23.284
-
NVDA 1040 Put, Expiration 2026-12-18:
- Premium: $278.1
- Delta: -0.3672
- ROI: 60.03%
- Profit: $166.944
For the long-term bull put spread, options like the NVDA 1560 put (2026-12-18) present an extended cushion against dramatic stock price moves, given its long time horizon and sensitively lower delta. This option brings in a considerable premium ($674.44) with a modest ROI, focusing on high premium collection over an extended period. This is bolstered by the NVDA 1040 put, similarly expiring on 2026-12-18, with a lower delta of -0.3672 and a higher ROI of 60.03%, promising significant profitability while ensuring a balance against potential stock price declines.
Risk Management:
All selected options strike a balance between maximizing premium income and managing assignment risks, especially for short-to-medium-term strategies where Delta is kept moderate to ensure lesser price sensitivity.
Conclusion:
The presented strategies span near-term to long-term options, providing varying levels of premium collection with corresponding risks. The combination of high-ROI and moderate delta balances potential profit and risk, effectively securing maximum gains under safe parameters, keeping in line with the target expectation of NVDA's price hovering 2% over or under its current level. This diversification ensures robustness against different market scenarios, encapsulating an effective and profitable vertical bull put spread approach for NVDA.
Vertical Bear Call Spread Option Strategy
Vertical Bull Call Spread Option Strategy
Spread Option Strategy
Calendar Spread Option Strategy #1
When considering a calendar spread options strategy on NVIDIA Corporation (NVDA), it is essential to assess the Greeks, expiration dates, and strike prices in order to find a profitable trade that minimizes the risk of assignment and maximizes potential profit.
Summary of Analysis:
- Choice 1: Buy a Put (2026-01-16) @ $1900.0 and Sell a Call (2025-12-19) @ $425.0
- Buy Put Option: Delta: 0.2672385369, Gamma: 0.000529115, Vega: 401.3244125788, Theta: -0.1904529698, Premium: $61.8
- Sell Call Option: Delta: 0.9996685481, Gamma: 0.0, Vega: 0.0, Theta: -0.0474812873, Premium: $512.95
- Risk and Reward: The long put option provides a substantial hedge given its substantial delta and gamma. However, the high delta in the short call significantly increases the risk of assignment. On the other hand, the premium on the sold call option offers a substantial initial inflow.
-
Potential Profit: With a high premium from the sold call, this setup can be lucrative if managed properly, but it comes with high risk due to call option's delta.
-
Choice 2: Buy a Put (2026-01-16) @ $615.0 and Sell a Call (2026-01-16) @ $575.0
- Buy Put Option: Delta: 0.2768747145, Gamma: 0.0006705662, Vega: 330.0576316356, Theta: -0.2351801891, Premium: $43.85
- Sell Call Option: Delta: 0.6400, Gamma: 0.0004540, Vega: 180.0564, Theta: -0.23433248, Premium: $423.20
- Risk and Reward: Both the put and call options are close to the money, thus providing a balanced approach with moderate risk and potential. Selling the call option provides substantial premium to offset the cost of the put.
-
Potential Profit: The trade provides a good hedge while capitalizing on both premiums and minimized assignment risk because the sold call has delta much below 1.0.
-
Choice 3: Buy a Put (2026-06-18) @ $1510.0 and Sell a Call (2025-12-19) @ $585.0
- Buy Put Option: Delta: 0.4734578043, Gamma: 0.000782019, Vega: 392.4006427778, Theta: -0.2937933399, Premium: $73.50
- Sell Call Option: Delta: 0.8788746194, Gamma: 0.0002643308, Vega: 245.2112367697, Theta: -0.1657933857, Premium: $512.95
- Risk and Reward: The long put is out of the money, providing protection if NVDA drops significantly. The short call is in a high delta position, presenting the risk of assignment if the price approaches the strike before expiration.
-
Potential Profit: The anticipation is for a moderate to low stock price fall at the point of expiration of the long put while banking premiums on sold calls.
-
Choice 4: Buy a Put (2026-06-18) @ $2900.0 and Sell a Call (2026-01-16) @ $1750.0
- Buy Put Option: Delta: 0.6769535697, Gamma: 0.0004339395, Vega: 545.8445797964, Theta: -0.1955376439, Premium: $266.86
- Sell Call Option: Delta: 0.6980032331, Gamma: 0.0004179088, Vega: 530.1546980896, Theta: -0.1925277862, Premium: $311.60
- Risk and Reward: High delta on both put and call positions increase risk. However, balanced gamma and vega ensure that volatility adjustments could hedge against severe market movements.
-
Potential Profit: Striking high volatility, profit can dramatically increase when the puts intrinsic value yields higher than anticipated while benefiting from call premium decay.
-
Choice 5: Buy a Put (2026-01-16) @ $1700.0 and Sell a Call (2025-12-19) @ $425.0
- Buy Put Option: Delta: 0.2698727072, Gamma: 0.0005317533, Vega: 403.3073995282, Theta: -0.1914686921, Premium: $64.81
- Sell Call Option: Delta: 0.6769535697, Gamma: 0.0004339395, Vega: 545.8445797964, Theta: -0.1955376439, Premium: $266.86
- Risk and Reward: Lower delta and manageable gamma minimize risk of significant losses. The longer time frame for the short call gives more flexibility.
- Potential Profit: Moderate gains aligned with premium gains and managed risk makes it suitable.
Conclusion:
Each of the above strategies entails buying a long put to achieve protection amidst market volatility while selling a relatively closer call option to garner premium benefits. Selection criteria for the "best" trade would depend on the trader's risk tolerance and market expectation. For conservative investors, strategy 2 provides a balanced moderate approach. However, for high-risk investors with a bearish outlook, strategy 1 and 5 offer higher potential returns with caution on delta-induced risks. Overall, careful management of these trades near expiration is essential to mitigate the risk of assignment.
Calendar Spread Option Strategy #2
To identify the most profitable calendar spread strategy for NVIDIA Corporation (NVDA), we will consider selling a put option and buying a call option at different expiration dates while minimizing the risk associated with shares being assigned. Based on the Greeks data provided and the ROI values, we will evaluate five calendar spread choices across different expiration dates that offer the highest potential rewards while ensuring low risk of assignment. We will discuss the potential profit and loss scenarios for each choice to provide a comprehensive analysis.
Choice 1: Near-Term Calendar Spread
Sell Put Option: - Strike Price: 560.0 - Expiration Date: 2026-06-18 - Premium: 473.81 - ROI: 22.1536058758% - Delta: 0.9765742144 (minimizing the risk of assignment due to high delta)
Buy Call Option: - Strike Price: 630.0 - Expiration Date: 757 days (roughly 2 years from today) - Premium: 373.15 - ROI: 46.7120460941% - Delta: 0.7992367121 (appropriate for minimizing risk due to moderate delta)
Profit and Loss Scenario: - Potential Profit: Selling the put option at a higher ROI while buying the call option with a moderate delta ensures balanced risk and return. - Risk: The high delta of the sold put (0.9765742144) indicates a high probability of assignment if the stock price is near or above 560.0 at expiration.
Choice 2: Medium-Term Calendar Spread
Sell Put Option: - Strike Price: 700.0 - Expiration Date: 605 days (roughly 2 years) - Premium: 382.7 - ROI: 28.1515005617% - Delta: 0.8094854918 (lower assignment risk)
Buy Call Option: - Strike Price: 880.0 - Expiration Date: 941 days (roughly 2.5 years) - Premium: 354.74 - ROI: 86.2310424536% - Delta: 0.7445971087 (sufficient for minimizing risk)
Profit and Loss Scenario: - Potential Profit: With a sufficiently high ROI from the call option and lower delta on the put option, this calendar spread offers high reward potential. - Risk: Moderate delta on the sold put reduces the risk of assignment if the stock price drifts around 700.0 at expiration.
Choice 3: Long-Term Calendar Spread
Sell Put Option: - Strike Price: 570.0 - Expiration Date: 605 days - Premium: 427.8 - ROI: 17.2875175316% - Delta: 0.8682690228 (lower risk of assignment)
Buy Call Option: - Strike Price: 750.0 - Expiration Date: 941 days - Premium: 413.5 - ROI: 56.7487303507% - Delta: 0.7987477769 (sufficient for minimizing risk)
Profit and Loss Scenario: - Potential Profit: The long-term strategy provides a balanced approach, combining moderate risk and a high profit potential using the lower delta put and higher delta call. - Risk: Lower risk of assignment due to the moderate delta of the sell put.
Choice 4: Extended-Term Calendar Spread
Sell Put Option: - Strike Price: 450.0 - Expiration Date: 941 days - Premium: 576.69 - ROI: 16.9668279318% - Delta: 0.9103292315 (moderate assignment risk)
Buy Call Option: - Strike Price: 540.0 - Expiration Date: 941 days - Premium: 468.72 - ROI: 17.0413039768% - Delta: 0.8803195948 (appropriate for minimizing risk)
Profit and Loss Scenario: - Potential Profit: Balanced risk and reward with both options having similar expiration dates and a high ROI on the call option. - Risk: Moderate delta of the sell put minimizes the risk of assignment.
Choice 5: Super Long-Term Calendar Spread
Sell Put Option: - Strike Price: 600.0 - Expiration Date: 758 days - Premium: 466.48 - ROI: 29.5052306637% - Delta: 0.8562765036 (moderate assignment risk)
Buy Call Option: - Strike Price: 850.0 - Expiration Date: 758 days - Premium: 314.71 - ROI: 74.9470941502% - Delta: 0.7424826005 (appropriate for minimizing risk)
Profit and Loss Scenario: - Potential Profit: Higher potential profit from selling the put option and buying the call with high ROI from both options. - Risk: Moderate delta reduces assignment risk while ensuring high returns on high delta call options.
Conclusion:
By carefully selecting the strike prices and expiration dates of the put and call options, we maximize the potential profit while minimizing the risk of assignment. Utilizing the information provided, these five calendar spread strategies offer a comprehensive outlook for diversified expiration dates from near-term to super long-term scenarios, ensuring balanced risk and profit potential. Evaluating the Greeks, particularly delta, is vital to reduce the chance of assignment and optimize the reward profile.
Similar Companies in Semiconductors:
Report: Intel Corporation (INTC), Intel Corporation (INTC), Report: Taiwan Semiconductor Manufacturing Company Limited (TSM), Taiwan Semiconductor Manufacturing Company Limited (TSM), Report: Marvell Technology, Inc. (MRVL), Marvell Technology, Inc. (MRVL), Report: Micron Technology, Inc. (MU), Micron Technology, Inc. (MU), Report: Advanced Micro Devices, Inc. (AMD), Advanced Micro Devices, Inc. (AMD), Report: Broadcom Inc. (AVGO), Broadcom Inc. (AVGO), Report: QUALCOMM Incorporated (QCOM), QUALCOMM Incorporated (QCOM), Report: Texas Instruments Incorporated (TXN), Texas Instruments Incorporated (TXN), Report: Lam Research Corporation (LRCX), Lam Research Corporation (LRCX)
https://www.proactiveinvestors.com/companies/news/1048001?SNAPI
https://www.proactiveinvestors.com/companies/news/1048001
https://www.youtube.com/watch?v=c17it6FLyHk
https://www.youtube.com/watch?v=fZ2nDe90Eiw
https://www.youtube.com/watch?v=yXnxs8cpVxA
https://www.youtube.com/watch?v=bRFjVlT2u-8
https://www.youtube.com/watch?v=T_z9fPEjdyM
https://www.fool.com/investing/2024/05/20/3-artificial-intelligence-stocks-to-buy-now-and-ho/
https://www.youtube.com/watch?v=HVEk3nikuY4
https://finance.yahoo.com/m/91778184-52cc-3668-aa92-8dcc790af606/3-artificial-intelligence.html
https://finance.yahoo.com/m/2b2f05dd-371a-3777-8304-e3ffa1f2b7f4/can-nvidia-stock-reach-the.html
https://finance.yahoo.com/video/nvidia-earnings-impress-hard-please-212734404.html
https://finance.yahoo.com/m/7e5c0e03-3185-31f9-bd1c-a57d1c045213/3-artificial-intelligence.html
https://finance.yahoo.com/video/nvidia-impact-markets-grayscale-ceo-223236768.html
https://www.sec.gov/Archives/edgar/data/1045810/000104581023000227/nvda-20231029.htm
Copyright © 2024 Tiny Computers (email@tinycomputers.io)
Report ID: U5LjW1
Cost: $0.64480
https://reports.tinycomputers.io/NVDA/NVDA-2024-05-20.html Home