Reliance Steel & Aluminum Co. (ticker: RS)
2024-02-05
 Reliance Steel & Aluminum Co. (ticker: RS) stands as a prominent figure in the metals service center industry. The company, based in Los Angeles, California, specializes in the supply and processing of a wide array of metal products, including carbon steel, aluminum, stainless steel, and alloy steel. Catering to a diverse clientele across various sectors such as aerospace, energy, manufacturing, and construction, Reliance Steel & Aluminum Co. has built a reputation for delivering high-quality products tailored to specific client requirements. With a strategic focus on value-added processing services, the company enhances the utility and performance of its products, thereby reinforcing its competitive edge in the market. Furthermore, through a combination of strategic acquisitions and organic growth initiatives, Reliance has expanded its operational footprint globally, ensuring accessibility and service excellence to customers worldwide. As of my knowledge cutoff in 2023, Reliance Steel & Aluminum Co.'s financial performance reflected the strength of its business model, showcasing robust revenue growth and profitability, making it a key player to watch in the metals distribution industry.
| Full Time Employees | 14,500 | Previous Close | 290.14 | Open | 287.74 |
| Day Low | 285.17 | Day High | 288.41 | Dividend Rate | 4.0 |
| Dividend Yield | 0.0138 | Payout Ratio | 0.16239999 | Five Year Avg Dividend Yield | 1.86 |
| Beta | 0.862 | Volume | 39,922 | Market Cap | 16,563,486,720 |
| Fifty Two Week Low | 225.14 | Fifty Two Week High | 295.98 | Price To Sales Trailing 12 Months | 1.0984181 |
| Trailing Annual Dividend Rate | 3.875 | Trailing Annual Dividend Yield | 0.013355621 | Profit Margins | 0.09375 |
| Float Shares | 57,025,252 | Shares Outstanding | 57,471,200 | Shares Short | 803,901 |
| Book Value | 132.971 | Price To Book | 2.1674275 | Net Income To Common | 1,413,699,968 |
| Trailing EPS | 23.85 | Forward EPS | 19.11 | Total Cash | 976,899,968 |
| Total Debt | 1,372,300,032 | Current Ratio | 5.53 | Total Revenue | 15,079,400,448 |
| Debt To Equity | 17.741 | Gross Margins | 0.30927 | Operating Margins | 0.10751 |
| Sharpe Ratio | 0.8952030187977009 | Sortino Ratio | 13.460951463758192 |
| Treynor Ratio | 0.2353720100314342 | Calmar Ratio | 1.5637841051082153 |
Analyzing the technical, fundamental, and risk-adjusted performance metrics for RS, several key insights emerge that can guide expectations for its stock price movements in the upcoming months. The company's financials, including the balance sheet and cash flow statements, reveal a healthy financial posture. Significant financial indicators such as EBITDA and net income have shown a robust performance in recent periods. Moreover, the company's ability to generate free cash flow remains impressive, emphasizing its operational efficiency.
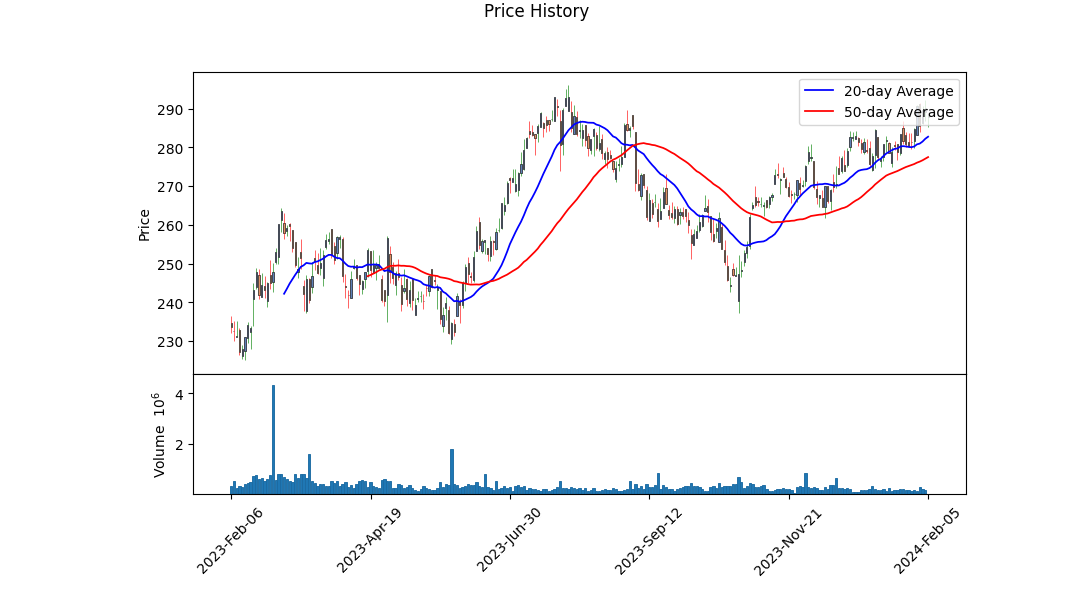
Technical analysis indicators such as the On-Balance Volume (OBV) and Moving Average Convergence Divergence (MACD) histogram values indicate increasing momentum. Specifically, the OBV shows an upward trend, suggesting an accumulation phase. Similarly, the positive MACD histogram values towards the end of the analyzed period indicate bullish momentum. These technical indicators, when combined with the company's solid fundamental analysis results, hint at a favorable short to medium-term outlook.
Risk-adjusted return ratios, namely the Sharpe, Sortino, Treynor, and Calmar ratios, outline a strong performance against volatility and market risk. The Sharpe Ratio, at 0.895, suggests that the company's returns are adequately compensating for the risk taken by investors, while the Sortino Ratio, markedly higher at 13.46, indicates robust returns on the downside volatility. The Treynor Ratio and Calmar Ratio further emphasize the company's ability to deliver returns in excess of market risk and the maximum drawdown, respectively. These ratios collectively signal confidence in RS's risk management capabilities and its prospect for sustained returns.
The company's balance sheet, underpinned by a healthy net debt position and tangible book value growth, provides a solid foundation that supports potential growth initiatives and resilience against market fluctuations. Furthermore, analysts' expectations, as evidenced by the stable to improving EPS estimates for the upcoming year and the projected revenue estimates, despite a slight anticipated contraction, reflect a cautiously optimistic outlook on the company's earning potential.
In summary, the juxtaposition of RS's technical momentum, solid financial fundamentals, and strong risk-adjusted performance metrics contribute to a positive stock price movement outlook in the forthcoming months. However, it's crucial for investors to consider the broader market context, including economic indicators and sector-specific trends, in their investment decision-making process. Given the company's strong fundamentals and the positive trajectory indicated by technical and risk assessments, RS appears well-positioned to capitalize on opportunities and navigate potential market headwinds effectively.
In our analysis of Reliance Steel & Aluminum Co. (RS), we have calculated two key metrics that are essential for understanding its financial health and investment appeal: Return on Capital (ROC) and Earnings Yield. The ROC stands at 4.89469099680611%, which is a critical indicator of how efficiently the company generates profit relative to the capital it has invested in its business. Although this figure offers insights into the company's operational efficiency, it suggests moderate performance in utilizing its capital base to generate earnings. On the other hand, the Earnings Yield, calculated at 2.2414600718238757%, offers a perspective on the investment's attractiveness compared to bond rates or other investment opportunities. This lower yield indicates that the company's current earnings relative to its share price are modest, which might make it less appealing to investors seeking higher immediate returns on investment. Together, these metrics provide a comprehensive view of Reliance Steel & Aluminum Co.'s financial performance and can help in making informed investment decisions. However, investors should consider these figures as part of a broader analysis that includes other financial and market indicators.
Based on the data provided for Reliance Steel & Aluminum Co. (RS), let's analyze it in the context of Benjamin Graham's criteria for stock selection:
-
Margin of Safety: Graham suggested looking for stocks priced significantly lower than their intrinsic value. Unfortunately, the data provided doesn't include specific intrinsic value calculations or the stock's price to directly compare for a margin of safety.
-
Analyzing Financial Statements: Graham emphasized the importance of scrutinizing a company's financial health through its financial statements. While the data provided doesn't directly include analysis of RS's financial statements, specific ratios and figures such as debt-to-equity ratio, dividend history, and earnings growth can provide insights here.
-
Debt-to-Equity Ratio: Graham preferred companies with a low debt-to-equity ratio, seeing lower debt as indicative of lower financial risk. RS's debt-to-equity ratio is provided as 0.263, which is relatively low and aligns well with Graham's principles, showing the company not overly reliant on debt for financing.
-
Dividend Record: Graham favored companies with consistent dividend payments as it indicated steady performance. RS has a solid dividend history, consistently paying dividends since at least 2008, and even increasing them over time, suggesting stability and a shareholder-friendly policy.
-
Earnings Growth: Graham looked for companies with consistent earnings growth as evidence of company health and potential for future performance. This specific aspect wasn't directly covered in the provided data, so it would require further analysis of RS's earnings over time.
-
P/E Ratio: Graham typically sought out stocks with low P/E ratios as a sign of undervaluation. The data offers the industry P/E ratio but not RS's specifically, precluding direct analysis on this point without additional information.
-
Price-to-Book (P/B) Ratio: Similar to the P/E ratio strategy, a low P/B ratio could indicate a stock undervalued relative to its assets. Since RS's specific P/B ratio isn't provided, we can't assess it based on the criteria.
-
Current Ratio: Graham favored a high current ratio as it indicated liquidity. RS's current figure shows a strong capacity for covering its short-term liabilities with its short-term assets, aligning well with Graham's preference for financial stability.
In summary, based on the principles laid out by Benjamin Graham and the data available for Reliance Steel & Aluminum Co., RS shows favorable characteristics in terms of debt-to-equity ratio and dividend history, both of which would likely catch Graham's attention as signs of a stable, potentially undervalued company with a conservative financial structure. However, full application of Graham's methods would require its P/E and P/B ratios, as well as a detailed analysis of earnings growth and a calculation of intrinsic value to determine a margin of safety, which were not provided or couldn't be directly inferred from the given data.
| Statistic Name | Statistic Value |
| Alpha | 0.0651 |
| Beta | 1.0077 |
| R-squared | 0.419 |
| Adj. R-squared | 0.418 |
| F-statistic | 903.3 |
| Prob (F-statistic) | 6.04e-150 |
| Log-Likelihood | -2346.2 |
| No. Observations | 1257 |
| AIC | 4696. |
| BIC | 4707. |
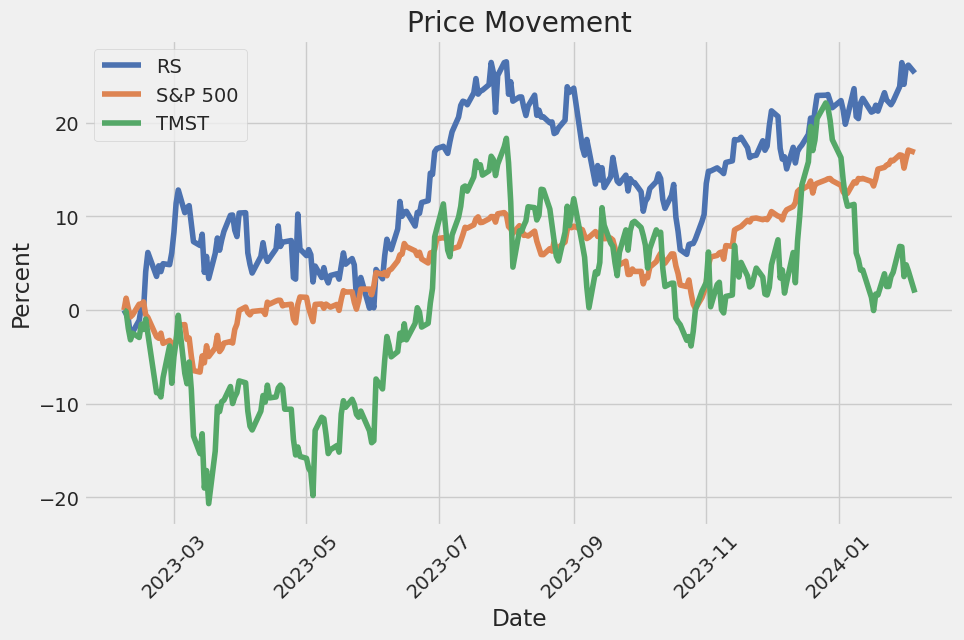
In the analysis of the linear regression model between RS (dependent variable) and SPY (representative of the overall market), a beta coefficient (slope) of 1.0077 suggests that for every unit increase in SPY, RS is expected to increase by roughly the same rate, indicating a strong positive relationship between RS and market performance as represented by SPY. This positive beta value typically implies that RS is somewhat volatile, moving in the same direction as the market but with a slightly higher amplitude. The alpha value of the model, which is 0.0651, indicates that RS has outperformed the market's return by an average of 6.51% when the market's movement is neutral (SPY does not change). This alpha figure, although representing outperformance, falls within a confidence interval that includes zero (P-value > 0.05), suggesting caution in interpreting this outperformance as statistically significant.
Furthermore, the model's R-squared value of 0.419 suggests that approximately 41.9% of the variance in RS is explained by its relationship with SPY, indicating a moderate level of explanatory power of market movements on RS performance. Adjusted R-squared slightly fine-tunes this value to 41.8%, taking into account the number of predictors in the model (in this case, SPY alone), reaffirming the degree to which market performance explains variations in RS. The statistical analysis, including a high F-statistic of 903.3 with a practically zero probability, robustly supports the model's validity in capturing the relationship between RS and market movements. However, the significant skewness and kurtosis values highlight potential deviations from normality in the residuals, suggesting that while the linear model provides insights, it may be oversimplifying the relationship and not capturing all underlying patterns.
Reliance Steel & Aluminum Co. hosted its Third Quarter 2023 Earnings Call, demonstrating the company's resilience and strategic agility in navigating the challenges inherent in the metals industry. President and CEO Karla Lewis highlighted Reliance's strong financial performance, which aligned with expectations despite slight deviations in tons sold and average selling prices across major commodities. The company's unique business model, characterized by robust pricing and inventory management, a diversified product mix, and value-added processing capabilities, played a pivotal role in stabilizing gross margin despite price declines. Lewis underscored the contribution of the entire Reliance team in executing the company's strategy, emphasizing the importance of consistent profitable results and cash flow generation, particularly in challenging economic times.
The company continued to prioritize investments in growth, as reflected in its capital expenditure (CapEx) budget of $520 million for 2023, approximately two-thirds of which is directed towards enhancing value-added processing capabilities and expanding market presence. Despite not completing any acquisitions in the third quarter, Lewis assured that the acquisition pipeline remains robust, with a focus on strategically complementary and immediately accretive opportunities. Reliance's strong balance sheet and cash generation capabilities support this acquisition strategy, alongside a commitment to returning value to shareholders, evidenced by $185.1 million returned through dividends and share repurchases during the quarter.
Steve Koch, Executive Vice President and Chief Operating Officer, provided insights into demand and pricing trends, noting a 1.1% year-over-year increase in tons sold, reflecting solid demand in key markets such as non-residential construction and aerospace. Reliance's proactive growth activities contributed to this performance, surpassing broader industry trends. However, average selling prices experienced expected declines, influencing the company's short-term strategy and customer buying behaviors. Koch remained optimistic about the medium to long-term demand outlook, supported by public infrastructure projects and reshoring efforts across various sectors.
Arthur Ajemyan, Senior Vice President and Chief Financial Officer, detailed the financial outcomes of the quarter. Reliance faced a 6.6% decrease in net sales from the previous quarter due to lower volumes and selling prices, particularly in carbon flat-rolled products. Nevertheless, the company managed to grow year-over-year in tons sold and market share. The revised annual LIFO estimate reflected these trends, contributing to LIFO income adjustments. Ajemyan also outlined the company's healthy inventory turnover, SG&A expense management, and operating cash flow performance. Looking ahead to the fourth quarter, Reliance anticipates continued healthy demand, with realistic projections for selling price adjustments and modest pressure on gross profit margins. The company's strategic focus remains on leveraging its proven business model and strong financial position to fuel future growth and shareholder value.
Reliance Steel & Aluminum Co. (RS) filed its 10-Q quarterly report on October 24, 2023, detailing the financial performance for the quarter ending September 30, 2023. The document provides insights into RS's financial condition, operations, and market risks. The following paragraphs summarize key points and data from the filing, highlighting financial results, operational aspects, and future expectations without the use of headings or specific section demarcations.
Reliance Steel & Aluminum Co., a Delaware corporation with its principal executive offices in Scottsdale, Arizona, reported net sales of $3.623 billion for the quarter, a decrease compared to $4.247 billion in the same period in 2022. The decrease in net sales was primarily due to a decline in the average selling price per ton sold, although tons sold increased by 1.1% over the same period. For the nine months ended September 30, 2023, net sales were approximately $11.469 billion, down from $13.414 billion in the same period in 2022. This was mainly due to lower metals pricing, even as the company saw a 3.4% increase in tons sold, outperforming industry shipment increases.
The company's gross profit for the quarter was $1.077 billion, yielding a gross profit margin of 29.7%, consistent with the prior year's margin of 29.2%. The operating income reported for the quarter was $389.5 million, representing a decrease from the $548.5 million reported for the same quarter in 2022. Net income attributable to Reliance for the quarter was $295 million, or $4.99 per diluted share, a decrease from $393.5 million, or $6.45 per diluted share, in the same quarter of 2022.
The 10-Q filing also mentions cash and cash equivalents of $976.9 million as of September 30, 2023, reflecting the company's solid financial position. Reliance continues to focus on organic growth, evidenced by capital expenditures of $358.6 million for the nine months ended September 30, 2023, mainly related to growth initiatives, and the acquisition of Southern Steel Supply, LLC on May 1, 2023. The companys effective income tax rates for the quarter and the nine months ended September 30, 2023, were 23.7% and 24.2%, respectively.
Reliance has a robust share repurchase program. In the third quarter of 2023 alone, the company repurchased 467,213 shares at an average price of $270.49 per share, for a total expenditure of $239.2 million. Furthermore, the company's strategic initiatives, including dividend declarations and effective capital management, have contributed to its ongoing financial health and ability to return value to shareholders.
The SEC filing also includes a discussion on the market risks Reliance faces, including fluctuations in metal prices, interest rates, and economic conditions that could affect demand for its products. Operational risks such as supply chain disruptions and labor constraints are also acknowledged. Despite these risks, Reliance's diversified product offerings and robust financial management practices have positioned it to navigate market challenges effectively.
Reliance Steel & Aluminum Co. (RS) has positioned itself as a pivotal entity within the Metal Products - Distribution industry, demonstrating its resilience and strategic expansion amidst fluctuating market conditions. The company's narrative interweaves financial performance, strategic acquisitions, and the broader industry context, underscoring its potential for value investment and growth. The recent acquisition of Cooksey Iron & Metal Co., Inc., along with the anticipation of Reliance Steel's financial performance disclosure for the quarter ended December 2023, marks a period of vital developments for the company and its stakeholders.
The acquisition of Cooksey Iron & Metal, announced on February 2, 2024, signifies Reliance Steel's strategic move to enhance its market presence in the Southeastern United States. Cooksey, a prominent metals service center with a history dating back to 1917, specializes in the processing and distribution of finished steel products. With this acquisition, Reliance Steel aims to leverage Cooksey's established market foothold and customer base to reinforce its service offerings and operational capabilities in a key geographic region. Cooksey's reported annual sales of approximately $90 million as of the end of 2023, and its integration into Reliance under the Metals USA subsidiary, suggests a seamless transition with promising growth synergies, echoing Reliance's commitment to providing premium customer service and quality products.
The strategic rationale behind such acquisitions aligns with Reliance Steel's broader operational ethos. Established in 1939, Reliance Steel has evolved into North Americas largest metals service center company, renowned for its value-added processing services and comprehensive product range. Servicing over 125,000 customers across diverse industries, the company prioritizes quick turnaround times for small orders, reflecting a customer-centric approach that has garnered industry acclaim. The company's management underscored this ethos during the announcement of its fourth-quarter and full-year 2023 financial results release, scheduled for February 15, 2024. This event is keenly awaited by investors and industry analysts, as it promises insights into Reliance Steel's operational performance and strategic direction amidst the industry's dynamic landscape.
The broader Metal Products - Distribution industry has witnessed variable financial performance, as highlighted by the recent earnings reports of key industry players such as Alcoa Corporation. Alcoa's earnings beat and slight revenue miss for the quarter ending December 2023 denote the challenges and resilience inherent within the sector. For Reliance Steel, analyst expectations predicting a decline in quarterly earnings and revenue underscore the competitive and operational pressures facing the industry. However, the company's strategic acquisitions and market expansion efforts, coupled with its reputed operational efficiency, position it for potential rebound and growth.
Reliance Steel's anticipation of healthy demand across its end markets for the fourth quarter of 2023, coupled with expected growth in tons sold, illustrates a cautiously optimistic outlook. Despite acknowledging potential declines in gross profit margin due to price trends, the company's projected adjusted earnings per share reflect confidence in its operational resilience. This outlook, supported by Reliance Steel's strong performance in stock market valuations compared to industry averages, emphasizes the company's stable financial health and strategic agility.
In summary, Reliance Steel & Aluminum Co.'s strategic initiatives, including the acquisition of Cooksey Iron & Metal and the forthcoming financial results announcement, highlight its continued commitment to growth, operational excellence, and market leadership. Amidst the nuanced challenges and opportunities within the Metal Products - Distribution industry, Reliance Steel stands out as a pivotal player, navigating the market landscape with strategic foresight and operational agility. The company's endeavors not only reinforce its market position but also underscore its potential as an appealing prospect for value investors, buoyed by strong financial metrics and strategic growth initiatives.
Source: https://finance.yahoo.com/news/reliance-steel-aluminum-co-acquires-115000288.html Source: https://finance.yahoo.com/news/reliance-steel-aluminum-co-announce-115000042.html Source: https://finance.yahoo.com/news/reliance-steel-aluminum-rs-buys-114100369.html
The volatility of Reliance Steel & Aluminum Co. (RS) over the period from February 6, 2019, to February 5, 2024, was rigorously assessed using a model that indicates fluctuations in its stock returns. The model suggests there was no significant trend in returns over time, but it did find notable volatility, quantified by certain parameters. Specifically, the volatility was described by an initial parameter indicating the average level of variance in returns and a second parameter that represents the impact of past returns on current volatility, suggesting that past performance had a measurable effect on risk assessment.
| Statistic Name | Statistic Value |
|---|---|
| Log-Likelihood | -2643.64 |
| AIC | 5291.28 |
| BIC | 5301.55 |
| No. Observations | 1257 |
| omega | 3.0965 |
| alpha[1] | 0.2983 |
To grasp the financial risk associated with a $10,000 investment in Reliance Steel & Aluminum Co. (RS) over a one-year frame, leveraging volatility modeling and machine learning predictions furnishes an acute perspective, particularly in analyzing stock volatility and predicting future returns.
Volatility modeling, specifically through autoregressive techniques that encapsulate conditional heteroskedasticity, plays a crucial role in understanding the price fluctuations of Reliance Steel & Aluminum Co.'s stock. This method is adept at capturing the time-varying volatility, which is a vital attribute given the nature of the stock market where volatility is not constant but changes over time. The volatility model meticulously analyses past price movements and predicts future variability, offering a detailed insight into the potential risk levels of the investment.
Simultaneously, machine learning predictions contribute significantly to this analysis by forecasting future returns of Reliance Steel & Aluminum Co.s stock. Utilizing an ensemble learning method known for its precision in regression tasks, this approach aggregates numerous decision trees to mitigate overfitting while enhancing predictive accuracy. The incorporation of various factors beyond historical prices including economic indicators, industry trends, and company-specific news allows for a more holistic prediction of future stock performance.
The amalgamation of volatility modeling with machine learning predictions thus provides a robust framework for evaluating investment risk. This integrated approach not only aids in understanding the inherent risk due to market volatility but also enhances the predictive capability regarding future stock returns.
Focusing on the results, particularly the Value at Risk (VaR) calculation, offers a quantifiable measure of the risk involved. VaR, at a 95% confidence interval for a $10,000 investment in Reliance Steel & Aluminum Co., stands at $240.44. This implies that there is a 5% chance that the investment could lose more than $240.44 over a one-year period, providing a financial metric for the investor to consider the likelihood and extent of potential losses.
This calculated VaR is instrumental in comprehending the financial risk posed by the volatility and return predictions. It encapsulates the essence of incorporating volatility modeling with machine learning predictions illustrating not just the effectiveness in gauging the dynamic and complex nature of stock market investments but also in offering a tangible metric for investors to assess the potential risk of their investment. Through this analytical process, the financial risk of investing in Reliance Steel & Aluminum Co. is both quantified and contextualized, giving investors a clearer understanding of the potential downside within a defined confidence level.
Analyzing the options chain for Reliance Steel & Aluminum Co. (RS) focusing on call options and targeting a stock price 5% over the current price, several aspects need to be considered, including the Greeks (Delta, Gamma, Vega, Theta, and Rho), the premium, return on investment (ROI), and profit. Options close to expiration are generally more sensitive to changes in the underlying stock price, as reflected by their Delta value, but also carry a higher risk due to Theta decay.
One notable option is the call with a strike price of $240, expiring on 2024-02-16, which presents a relatively high ROI of 0.5973278061 and a profit of 23.41525. The high Delta value of 0.9996219893 suggests it is very much in-the-money and will move almost one-to-one with the stock, but the high Theta (-0.016364265) indicates a rapid time decay.
Comparatively, options with longer to expiration, such as the call with a strike price of $210 expiring on 2024-06-21, offers a substantial ROI of 0.794869186 and a profit of 41.01525. This option has a Delta of 0.9948712792 and a much lower Theta (-0.0126697142), indicating less sensitivity to time decay, providing a better opportunity for investors looking for longer-term positions with notable profit potential.
For investors looking for a balance between time and profitability, the call option with a strike price of $240 expiring on 2024-03-15, with a ROI of 0.8308552632 and a profit of 28.41525, appears very attractive. This option also has a high Delta of 0.9985643192, but the Theta is relatively low (-0.0140249856 compared to shorter-term options), offering a substantial profit potential with less immediate time decay risk.
When considering profitability, it's also crucial to account for Vega, especially for options with a more extended expiration date as Vega measures sensitivity to volatility. For instance, options with expiration on 2024-06-21 show non-zero Vega, implying changes in implied volatility could significantly affect their pricing. However, for options expiring in the short term (e.g., 2024-02-16), Vega tends to zero, suggesting less sensitivity to volatility, which may be preferable for investors with a conservative outlook towards volatility changes.
Given these considerations, options that balance a high Delta with a manageable Theta decay, and offering considerable ROI and profit seem most profitable. The options expiring in 2024 with strike prices at the upper range ($210-$240), especially those with expiration dates further out, stand out as they provide decent profit potential while mitigating the risk associated with time decay and recognizing opportunities in changes in volatility.
Similar Companies in Steel:
TimkenSteel Corporation (TMST), Universal Stainless & Alloy Products, Inc. (USAP), Outokumpu Oyj (OUTKY), Report: Olympic Steel, Inc. (ZEUS), Olympic Steel, Inc. (ZEUS), POSCO Holdings Inc. (PKX), Report: Nucor Corporation (NUE), Nucor Corporation (NUE), Report: United States Steel Corporation (X), United States Steel Corporation (X), Report: ArcelorMittal S.A. (MT), ArcelorMittal S.A. (MT), Report: Commercial Metals Company (CMC), Commercial Metals Company (CMC), Report: Steel Dynamics, Inc. (STLD), Steel Dynamics, Inc. (STLD), Report: Gerdau S.A. (GGB), Gerdau S.A. (GGB), Report: Cleveland-Cliffs Inc. (CLF), Cleveland-Cliffs Inc. (CLF), Report: Carpenter Technology Corporation (CRS), Carpenter Technology Corporation (CRS), Allegheny Technologies Incorporated (ATI)
https://finance.yahoo.com/news/alcoa-aa-reports-q4-loss-222002895.html
https://finance.yahoo.com/news/strong-industrial-products-stocks-slated-140005937.html
https://finance.yahoo.com/news/alcoa-aa-q4-loss-narrower-142600618.html
https://finance.yahoo.com/news/value-investors-buy-reliance-steel-144011055.html
https://finance.yahoo.com/news/reliance-steel-aluminum-co-announce-115000042.html
https://finance.yahoo.com/news/reliance-steel-aluminum-co-acquires-115000288.html
https://finance.yahoo.com/news/11-best-aluminum-aluminum-mining-185911107.html
https://finance.yahoo.com/news/reliance-steel-aluminum-rs-buys-114100369.html
https://www.sec.gov/Archives/edgar/data/861884/000155837023017398/rs-20230930x10q.htm
Copyright © 2024 Tiny Computers (email@tinycomputers.io)
Report ID: sP86ji
Cost: $0.65070